Diagnostic logs for Application Gateway
Application Gateway logs provide detailed information for events related to a resource and its operations. These logs are available for events such as Access, Activity, Firewall, and Performance (only for V1). The granular information in logs is helpful when troubleshooting a problem or building an analytics dashboard by consuming this raw data.
Logs are available for all resources of Application Gateway; however, to consume them, you must enable their collection in a storage location of your choice. Logging in Azure Application Gateway is enabled by the Azure Monitor service. We recommend using the Log Analytics workspace as you can readily use its predefined queries and set alerts based on specific log conditions.
Types of Diagnostic logs
You can use different types of logs in Azure to manage and troubleshoot application gateways. You can learn more about these types below:
- Activity log: You can use Azure activity logs (formerly known as operational logs and audit logs) to view all operations that are submitted to your Azure subscription, and their status. Activity log entries are collected by default, and you can view them in the Azure portal.
- Access log: You can use this log to view Application Gateway access patterns and analyze important information. This includes the caller's IP, requested URL, response latency, return code, and bytes in and out. An access log is collected every 60 seconds. This log contains one record per instance of Application Gateway. The Application Gateway instance is identified by the instanceId property.
- Performance log: You can use this log to view how Application Gateway instances are performing. This log captures performance information for each instance, including total requests served, throughput in bytes, total requests served, failed request count, and healthy and unhealthy backend instance count. A performance log is collected every 60 seconds. The Performance log is available only for the v1 SKU. For the v2 SKU, use Metrics for performance data.
- Firewall log: You can use this log to view the requests that are logged through either detection or prevention mode of an application gateway that is configured with the web application firewall. Firewall logs are collected every 60 seconds.
Note
Logs are available only for resources deployed in the Azure Resource Manager deployment model. You can't use logs for resources in the classic deployment model. For a better understanding of the two models, see the Understanding Resource Manager deployment and classic deployment article.
Storage locations
You have the following options to store the logs in your preferred location.
Log Analytic workspace: This option allows you to readily use the predefined queries, visualizations, and set alerts based on specific log conditions. The tables used by resource logs in log analytics workspace depend on what type of collection the resource is using:
Azure diagnostics: Data is written to the Azure Diagnostics table. Azure Diagnostics table is shared between multiple resource type, with each of them adding their own custom fields. When number of custom fields ingested to Azure Diagnostics table exceeds 500, new fields aren't added as top level but added to "AdditionalFields" field as dynamic key value pairs.
Resource-specific(recommended): Data is written to dedicated tables for each category of the resource. In resource specific mode, each log category selected in the diagnostic setting is assigned its own table within the chosen workspace. This has several benefits, including:
- Easier data manipulation in log queries
- Improved discoverability of schemas and their structures
- Enhanced performance in terms of ingestion latency and query times
- The ability to assign Azure role-based access control rights to specific tables
For Application Gateway, resource specific mode creates three tables:
Note
The resource specific option is currently available in all public regions.
Existing users can continue using Azure Diagnostics, or can opt for dedicated tables by switching the toggle in Diagnostic settings to Resource specific, or to Dedicated in API destination. Dual mode isn't possible. The data in all the logs can either flow to Azure Diagnostics, or to dedicated tables. However, you can have multiple diagnostic settings where one data flow is to azure diagnostic and another is using resource specific at the same time.
Selecting the destination table in Log analytics : All Azure services eventually use the resource-specific tables. As part of this transition, you can select Azure diagnostic or resource specific table in the diagnostic setting using a toggle button. The toggle is set to Resource specific by default and in this mode, logs for new selected categories are sent to dedicated tables in Log Analytics, while existing streams remain unchanged. See the following example.

Workspace Transformations: Opting for the Resource specific option allows you to filter and modify your data before it’s ingested with workspace transformations. This provides granular control, allowing you to focus on the most relevant information from the logs there by reducing data costs and enhancing security. For detailed instructions on setting up workspace transformations, please refer:Tutorial: Add a workspace transformation to Azure Monitor Logs by using the Azure portal.
Examples of optimizing access logs using Workspace Transformations
Example 1: Selective Projection of Columns: Imagine you have application gateway access logs with 20 columns, but you’re interested in analyzing data from only 6 specific columns. By using workspace transformation, you can project these 6 columns into your workspace, effectively excluding the other 14 columns. Even though the original data from those excluded columns won’t be stored, empty placeholders for them still appear in the Logs blade. This approach optimizes storage and ensures that only relevant data is retained for analysis.
Note
Within the Logs blade, selecting the Try New Log Analytics option gives greater control over the columns displayed in your user interface.
Example 2: Focusing on Specific Status Codes: When analyzing access logs, instead of processing all log entries, you can write a query to retrieve only rows with specific HTTP status codes (such as 4xx and 5xx). Since most requests ideally fall under the 2xx and 3xx categories (representing successful responses), focusing on the problematic status codes narrows down the data set. This targeted approach allows you to extract the most relevant and actionable information, making it both beneficial and cost-effective.
Recommended transition strategy to move from Azure diagnostic to resource specific table:
- Assess current data retention: Determine the duration for which data is presently retained in the Azure diagnostics table (for example: assume the diagnostics table retains data for 15 days).
- Establish resource-specific retention: Implement a new Diagnostic setting with resource specific table.
- Parallel data collection: For a temporary period, collect data concurrently in both the Azure Diagnostics and the resource-specific settings.
- Confirm data accuracy: Verify that data collection is accurate and consistent in both settings.
- Remove Azure diagnostics setting: Remove the Azure Diagnostic setting to prevent duplicate data collection.
Other storage locations:
- Azure Storage account: Storage accounts are best used for logs when logs are stored for a longer duration and reviewed when needed.
- Azure Event Hubs: Event hubs are a great option for integrating with other security information and event management (SIEM) tools to get alerts on your resources.
- Azure Monitor partner integrations.
Learn more about the Azure Monitor's diagnostic settings destinations .
Enable logging through PowerShell
Activity logging is automatically enabled for every Resource Manager resource. You must enable access and performance logging to start collecting the data available through those logs. To enable logging, use the following steps:
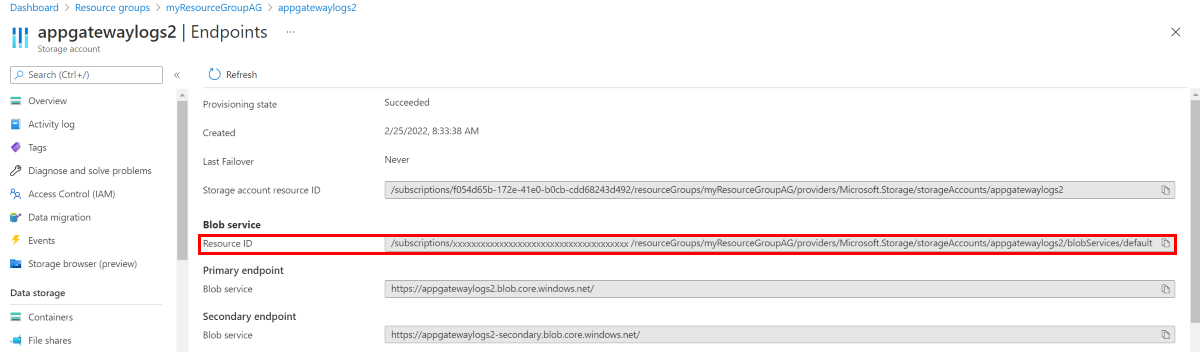
Note your storage account's resource ID, where the log data is stored. This value is of the form: /subscriptions/<subscriptionId>/resourceGroups/<resource group name>/providers/Microsoft.Storage/storageAccounts/<storage account name>. You can use any storage account in your subscription. You can use the Azure portal to find this information.
Note your application gateway's resource ID for which logging is enabled. This value is of the form: /subscriptions/<subscriptionId>/resourceGroups/<resource group name>/providers/Microsoft.Network/applicationGateways/<application gateway name>. You can use the portal to find this information.

Enable diagnostic logging by using the following PowerShell cmdlet:
Set-AzDiagnosticSetting -ResourceId /subscriptions/<subscriptionId>/resourceGroups/<resource group name>/providers/Microsoft.Network/applicationGateways/<application gateway name> -StorageAccountId /subscriptions/<subscriptionId>/resourceGroups/<resource group name>/providers/Microsoft.Storage/storageAccounts/<storage account name> -Enabled $true


Tip
Activity logs do not require a separate storage account. The use of storage for access and performance logging incurs service charges.
Enable logging through the Azure portal
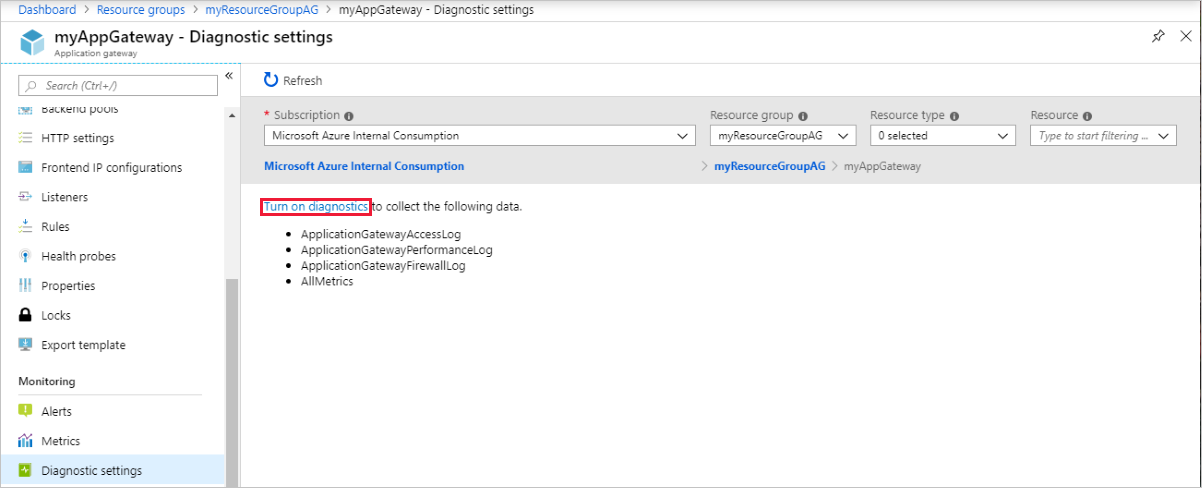
In the Azure portal, find your resource and select Diagnostic settings.
For Application Gateway, three logs are available:
- Access log
- Performance log
- Firewall log
To start collecting data, select Turn on diagnostics.
The Diagnostics settings page provides the settings for the diagnostic logs. In this example, Log Analytics stores the logs. You can also use event hubs and a storage account to save the diagnostic logs.
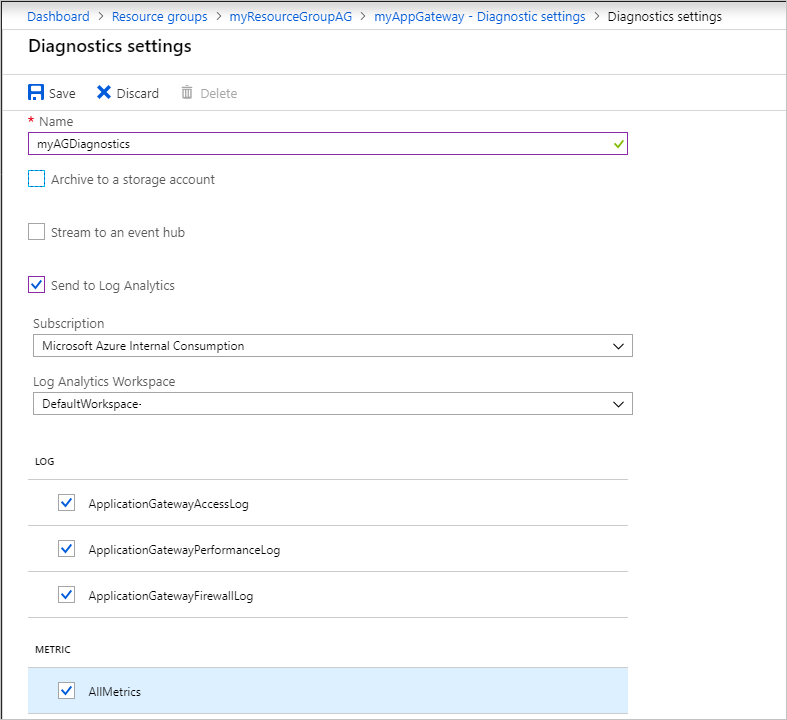
Type a name for the settings, confirm the settings, and select Save.
Activity log
Azure generates the activity log by default. The logs are preserved for 90 days in the Azure event logs store. Learn more about these logs by reading the View events and activity log article.
Access log
The access log is generated only if you've enabled it on each Application Gateway instance, as detailed in the preceding steps. The data is stored in the storage account that you specified when you enabled the logging. Each access of Application Gateway is logged in JSON format as shown below.
For Application Gateway and WAF v2 SKU
Note
For TLS/TCP proxy related information, visit data reference.
| Value | Description |
|---|---|
| instanceId | Application Gateway instance that served the request. |
| clientIP | IP of the immediate client of Application Gateway. If another proxy fronts your application gateway, this displays the IP of that fronting proxy. |
| httpMethod | HTTP method used by the request. |
| requestUri | URI of the received request. |
| UserAgent | User agent from the HTTP request header. |
| httpStatus | HTTP status code returned to the client from Application Gateway. |
| httpVersion | HTTP version of the request. |
| receivedBytes | Size of packet received, in bytes. |
| sentBytes | Size of packet sent, in bytes. |
| clientResponseTime | Time difference (in seconds) between the first byte and the last byte application gateway sent to the client. Helpful in gauging Application Gateway's processing time for responses or slow clients. |
| timeTaken | Length of time (in seconds) that it takes for the first byte of a client request to be processed and its last-byte sent in the response to the client. It's important to note that the Time-Taken field usually includes the time that the request and response packets are traveling over the network. |
| WAFEvaluationTime | Length of time (in seconds) that it takes for the request to be processed by the WAF. |
| WAFMode | Value can be either Detection or Prevention |
| transactionId | Unique identifier to correlate the request received from the client |
| sslEnabled | Whether communication to the backend pools used TLS. Valid values are on and off. |
| sslCipher | Cipher suite being used for TLS communication (if TLS is enabled). |
| sslProtocol | SSL/TLS protocol being used (if TLS is enabled). |
| serverRouted | The backend server that application gateway routes the request to. |
| serverStatus | HTTP status code of the backend server. |
| serverResponseLatency | Latency of the response (in seconds) from the backend server. |
| host | Address listed in the host header of the request. If rewritten using header rewrite, this field contains the updated host name |
| originalRequestUriWithArgs | This field contains the original request URL |
| requestUri | This field contains the URL after the rewrite operation on Application Gateway |
| upstreamSourcePort | The source port used by Application Gateway when initiating a connection to the backend target |
| originalHost | This field contains the original request host name |
| error_info | The reason for the 4xx and 5xx error. Displays an error code for a failed request. More details in Error code information. |
| contentType | The type of content or data that is being processed or delivered by the application gateway |
{
    "timeStamp": "2021-10-14T22:17:11+00:00",
    "resourceId": "/SUBSCRIPTIONS/{subscriptionId}/RESOURCEGROUPS/{resourceGroupName}/PROVIDERS/MICROSOFT.NETWORK/APPLICATIONGATEWAYS/{applicationGatewayName}",
    "listenerName": "HTTP-Listener",
    "ruleName": "Storage-Static-Rule",
    "backendPoolName": "StaticStorageAccount",
    "backendSettingName": "StorageStatic-HTTPS-Setting",
    "operationName": "ApplicationGatewayAccess",
    "category": "ApplicationGatewayAccessLog",
    "properties": {
        "instanceId": "appgw_2",
        "clientIP": "185.42.129.24",
        "clientPort": 45057,
        "httpMethod": "GET",
        "originalRequestUriWithArgs": "\/",
        "requestUri": "\/",
        "requestQuery": "",
        "userAgent": "Mozilla\/5.0 (Windows NT 6.1; WOW64) AppleWebKit\/537.36 (KHTML, like Gecko) Chrome\/52.0.2743.116 Safari\/537.36",
        "httpStatus": 200,
        "httpVersion": "HTTP\/1.1",
        "receivedBytes": 184,
        "sentBytes": 466,
        "clientResponseTime": 0,
        "timeTaken": 0.034,
        "WAFEvaluationTime": "0.000",
        "WAFMode": "Detection",
        "transactionId": "592d1649f75a8d480a3c4dc6a975309d",
        "sslEnabled": "on",
        "sslCipher": "ECDHE-RSA-AES256-GCM-SHA384",
        "sslProtocol": "TLSv1.2",
        "sslClientVerify": "NONE",
        "sslClientCertificateFingerprint": "",
        "sslClientCertificateIssuerName": "",
        "serverRouted": "52.239.221.65:443",
        "serverStatus": "200",
        "serverResponseLatency": "0.028",
        "upstreamSourcePort": "21564",
        "originalHost": "20.110.30.194",
        "host": "20.110.30.194",
        "error_info":"ERRORINFO_NO_ERROR",
        "contentType":"application/json"
    }
}
Note
Access logs with clientIP value 127.0.0.1 originate from an internal security process running on the application gateway instances. You can safely ignore these log entries.
For Application Gateway Standard and WAF SKU (v1)
| Value | Description |
|---|---|
| instanceId | Application Gateway instance that served the request. |
| clientIP | Originating IP for the request. |
| clientPort | Originating port for the request. |
| httpMethod | HTTP method used by the request. |
| requestUri | URI of the received request. |
| RequestQuery | Server-Routed: Backend pool instance that was sent the request.X-AzureApplicationGateway-LOG-ID: Correlation ID used for the request. It can be used to troubleshoot traffic issues on the backend servers. SERVER-STATUS: HTTP response code that Application Gateway received from the back end. |
| UserAgent | User agent from the HTTP request header. |
| httpStatus | HTTP status code returned to the client from Application Gateway. |
| httpVersion | HTTP version of the request. |
| receivedBytes | Size of packet received, in bytes. |
| sentBytes | Size of packet sent, in bytes. |
| timeTaken | Length of time (in milliseconds) that it takes for a request to be processed and its response to be sent. This is calculated as the interval from the time when Application Gateway receives the first byte of an HTTP request to the time when the response send operation finishes. It's important to note that the Time-Taken field usually includes the time that the request and response packets are traveling over the network. |
| sslEnabled | Whether communication to the backend pools used TLS/SSL. Valid values are on and off. |
| host | The hostname for which the request has been sent to the backend server. If backend hostname is being overridden, this name reflects that. |
| originalHost | The hostname for which the request was received by the Application Gateway from the client. |
{
    "resourceId": "/SUBSCRIPTIONS/{subscriptionId}/RESOURCEGROUPS/PEERINGTEST/PROVIDERS/MICROSOFT.NETWORK/APPLICATIONGATEWAYS/{applicationGatewayName}",
    "operationName": "ApplicationGatewayAccess",
    "time": "2017-04-26T19:27:38Z",
    "category": "ApplicationGatewayAccessLog",
    "properties": {
        "instanceId": "ApplicationGatewayRole_IN_0",
        "clientIP": "191.96.249.97",
        "clientPort": 46886,
        "httpMethod": "GET",
        "requestUri": "/phpmyadmin/scripts/setup.php",
        "requestQuery": "X-AzureApplicationGateway-CACHE-HIT=0&SERVER-ROUTED=10.4.0.4&X-AzureApplicationGateway-LOG-ID=874f1f0f-6807-41c9-b7bc-f3cfa74aa0b1&SERVER-STATUS=404",
        "userAgent": "-",
        "httpStatus": 404,
        "httpVersion": "HTTP/1.0",
        "receivedBytes": 65,
        "sentBytes": 553,
        "timeTaken": 205,
        "sslEnabled": "off",
        "host": "www.contoso.com",
        "originalHost": "www.contoso.com"
    }
}
Error code Information
If the application gateway can't complete the request, it stores one of the following reason codes in the error_info field of the access log.
| 4XX Errors | (The 4xx error codes indicate that there was an issue with the client's request, and the Application Gateway can't fulfill it.) |
|---|---|
| ERRORINFO_INVALID_METHOD | The client has sent a request which is non-RFC compliant. Possible reasons: client using HTTP method not supported by server, misspelled method, incompatible HTTP protocol version etc. |
| ERRORINFO_INVALID_REQUEST | The server can't fulfill the request because of incorrect syntax. |
| ERRORINFO_INVALID_VERSION | The application gateway received a request with an invalid or unsupported HTTP version. |
| ERRORINFO_INVALID_09_METHOD | The client sent request with HTTP Protocol version 0.9. |
| ERRORINFO_INVALID_HOST | The value provided in the "Host" header is either missing, improperly formatted, or doesn't match the expected host value. For example, when there's no Basic listener, and none of the hostnames of Multisite listeners match with the host. |
| ERRORINFO_INVALID_CONTENT_LENGTH | The length of the content specified by the client in the content-Length header doesn't match the actual length of the content in the request. |
| ERRORINFO_INVALID_METHOD_TRACE | The client sent HTTP TRACE method, which isn't supported by the application gateway. |
| ERRORINFO_CLIENT_CLOSED_REQUEST | The client closed the connection with the application gateway before the idle timeout period elapsed. Check whether the client timeout period is greater than the idle timeout period for the application gateway. |
| ERRORINFO_REQUEST_URI_INVALID | Indicates issue with the Uniform Resource Identifier (URI) provided in the client's request. |
| ERRORINFO_HTTP_NO_HOST_HEADER | Client sent a request without Host header. |
| ERRORINFO_HTTP_TO_HTTPS_PORT | The client sent a plain HTTP request to an HTTPS port. |
| ERRORINFO_HTTPS_NO_CERT | Indicates client isn't sending a valid and properly configured TLS certificate during Mutual TLS authentication. |
| 5XX Errors | Description |
|---|---|
| ERRORINFO_UPSTREAM_NO_LIVE | The application gateway is unable to find any active or reachable backend servers to handle incoming requests |
| ERRORINFO_UPSTREAM_CLOSED_CONNECTION | The backend server closed the connection unexpectedly or before the request was fully processed. This could happen due to backend server reaching its limits, crashing etc. |
| ERRORINFO_UPSTREAM_TIMED_OUT | The established TCP connection with the server was closed as the connection took longer than the configured timeout value. |
Performance log
The performance log is generated only if you have enabled it on each Application Gateway instance, as detailed in the preceding steps. The data is stored in the storage account that you specified when you enabled the logging. The performance log data is generated in 1-minute intervals. It's available only for the v1 SKU. For the v2 SKU, use Metrics for performance data. The following data is logged:
| Value | Description |
|---|---|
| instanceId | Application Gateway instance for which performance data is being generated. For a multiple-instance application gateway, there's one row per instance. |
| healthyHostCount | Number of healthy hosts in the backend pool. |
| unHealthyHostCount | Number of unhealthy hosts in the backend pool. |
| requestCount | Number of requests served. |
| latency | Average latency (in milliseconds) of requests from the instance to the back end that serves the requests. |
| failedRequestCount | Number of failed requests. |
| throughput | Average throughput since the last log, measured in bytes per second. |
{
    "resourceId": "/SUBSCRIPTIONS/{subscriptionId}/RESOURCEGROUPS/{resourceGroupName}/PROVIDERS/MICROSOFT.NETWORK/APPLICATIONGATEWAYS/{applicationGatewayName}",
    "operationName": "ApplicationGatewayPerformance",
    "time": "2016-04-09T00:00:00Z",
    "category": "ApplicationGatewayPerformanceLog",
    "properties":
    {
        "instanceId":"ApplicationGatewayRole_IN_1",
        "healthyHostCount":"4",
        "unHealthyHostCount":"0",
        "requestCount":"185",
        "latency":"0",
        "failedRequestCount":"0",
        "throughput":"119427"
    }
}
Note
Latency is calculated from the time when the first byte of the HTTP request is received to the time when the last byte of the HTTP response is sent. It's the sum of the Application Gateway processing time plus the network cost to the back end, plus the time that the back end takes to process the request.
Firewall log
The firewall log is generated only if you have enabled it for each application gateway, as detailed in the preceding steps. This log also requires that the web application firewall is configured on an application gateway. The data is stored in the storage account that you specified when you enabled the logging. The following data is logged:
| Value | Description |
|---|---|
| instanceId | Application Gateway instance for which firewall data is being generated. For a multiple-instance application gateway, there's one row per instance. |
| clientIp | Originating IP for the request. |
| clientPort | Originating port for the request. |
| requestUri | URL of the received request. |
| ruleSetType | Rule set type. The available value is OWASP. |
| ruleSetVersion | Rule set version used. Available values are 2.2.9 and 3.0. |
| ruleId | Rule ID of the triggering event. |
| message | User-friendly message for the triggering event. More details are provided in the details section. |
| action | Action taken on the request. Available values are Blocked and Allowed (for custom rules), Matched (when a rule matches a part of the request), and Detected and Blocked (these are both for mandatory rules, depending on if the WAF is in detection or prevention mode). |
| site | Site for which the log was generated. Currently, only Global is listed because rules are global. |
| details | Details of the triggering event. |
| details.message | Description of the rule. |
| details.data | Specific data found in request that matched the rule. |
| details.file | Configuration file that contained the rule. |
| details.line | Line number in the configuration file that triggered the event. |
| hostname | Hostname or IP address of the Application Gateway. |
| transactionId | Unique ID for a given transaction which helps group multiple rule violations that occurred within the same request. |
{
    "timeStamp": "2021-10-14T22:17:11+00:00",
    "resourceId": "/SUBSCRIPTIONS/{subscriptionId}/RESOURCEGROUPS/{resourceGroupName}/PROVIDERS/MICROSOFT.NETWORK/APPLICATIONGATEWAYS/{applicationGatewayName}",
    "operationName": "ApplicationGatewayFirewall",
    "category": "ApplicationGatewayFirewallLog",
    "properties": {
        "instanceId": "appgw_2",
        "clientIp": "185.42.129.24",
        "clientPort": "",
        "requestUri": "\/",
        "ruleSetType": "OWASP_CRS",
        "ruleSetVersion": "3.0.0",
        "ruleId": "920350",
        "message": "Host header is a numeric IP address",
        "action": "Matched",
        "site": "Global",
        "details": {
            "message": "Warning. Pattern match \\\"^[\\\\d.:]+$\\\" at REQUEST_HEADERS:Host .... ",
            "data": "20.110.30.194:80",
            "file": "rules\/REQUEST-920-PROTOCOL-ENFORCEMENT.conf",
            "line": "791"
        },
        "hostname": "20.110.30.194:80",
        "transactionId": "592d1649f75a8d480a3c4dc6a975309d",
        "policyId": "default",
        "policyScope": "Global",
        "policyScopeName": "Global"
    }
}
View and analyze the activity log
You can view and analyze activity log data by using any of the following methods:
- Azure tools: Retrieve information from the activity log through Azure PowerShell, the Azure CLI, the Azure REST API, or the Azure portal. Step-by-step instructions for each method are detailed in the Activity operations with Resource Manager article.
- Power BI: If you don't already have a Power BI account, you can try it for free. By using the Power BI template apps, you can analyze your data.
View and analyze the access, performance, and firewall logs
Azure Monitor logs can collect the counter and event log files from your Blob storage account. It includes visualizations and powerful search capabilities to analyze your logs.
You can also connect to your storage account and retrieve the JSON log entries for access and performance logs. After you download the JSON files, you can convert them to CSV and view them in Excel, Power BI, or any other data-visualization tool.
Tip
If you're familiar with Visual Studio and basic concepts of changing values for constants and variables in C#, you can use the log converter tools available from GitHub.
Analyzing Access logs through GoAccess
We have published a Resource Manager template that installs and runs the popular GoAccess log analyzer for Application Gateway Access Logs. GoAccess provides valuable HTTP traffic statistics such as Unique Visitors, Requested Files, Hosts, Operating Systems, Browsers, HTTP Status codes and more. For more details, please see the Readme file in the Resource Manager template folder in GitHub.
Next steps
- Visualize counter and event logs by using Azure Monitor logs.
- Visualize your Azure activity log with Power BI blog post.
- View and analyze Azure activity logs in Power BI and more blog post.
Feedback
Coming soon: Throughout 2024 we will be phasing out GitHub Issues as the feedback mechanism for content and replacing it with a new feedback system. For more information see: https://aka.ms/ContentUserFeedback.
Submit and view feedback for