Configure Power BI dashboards
The Higher Education Crisis Financial Impact Tracker app is designed to collect data pertaining to sponsored research programs or projects. Researchers can use the app to submit projected lost effort and loss reasons organized by grant, employee, and pay period.
By using Power BI, you can analyze and visualize the data from the app. The Power BI template described in this article pulls in the data that's collected by the Higher Education Crisis Financial Impact Tracker.
These reports are intended to be used by directors, deans, and research administrators who will monitor the data collected on behalf of their respective departments, sponsors, and colleges or schools.
Prerequisites
The Higher Education Crisis Financial Impact Tracker app pulls data from Microsoft Dataverse into this Power BI template, which empowers you to securely store, integrate, and automate the data for use with other business apps, including Power BI, Dynamics 365, and Power Automate.
To use this Power BI template, you need these prerequisites:
Download the free Power BI Desktop app.
Sign up for the Power BI service.
Create a Dataverse environment with maker permissions to access the portal and read permissions to access data within the entities.
You can configure Power BI dashboards in two ways:
Configure a Power BI report by using a blank report canvas
To configure a Power BI report by using a blank report canvas:
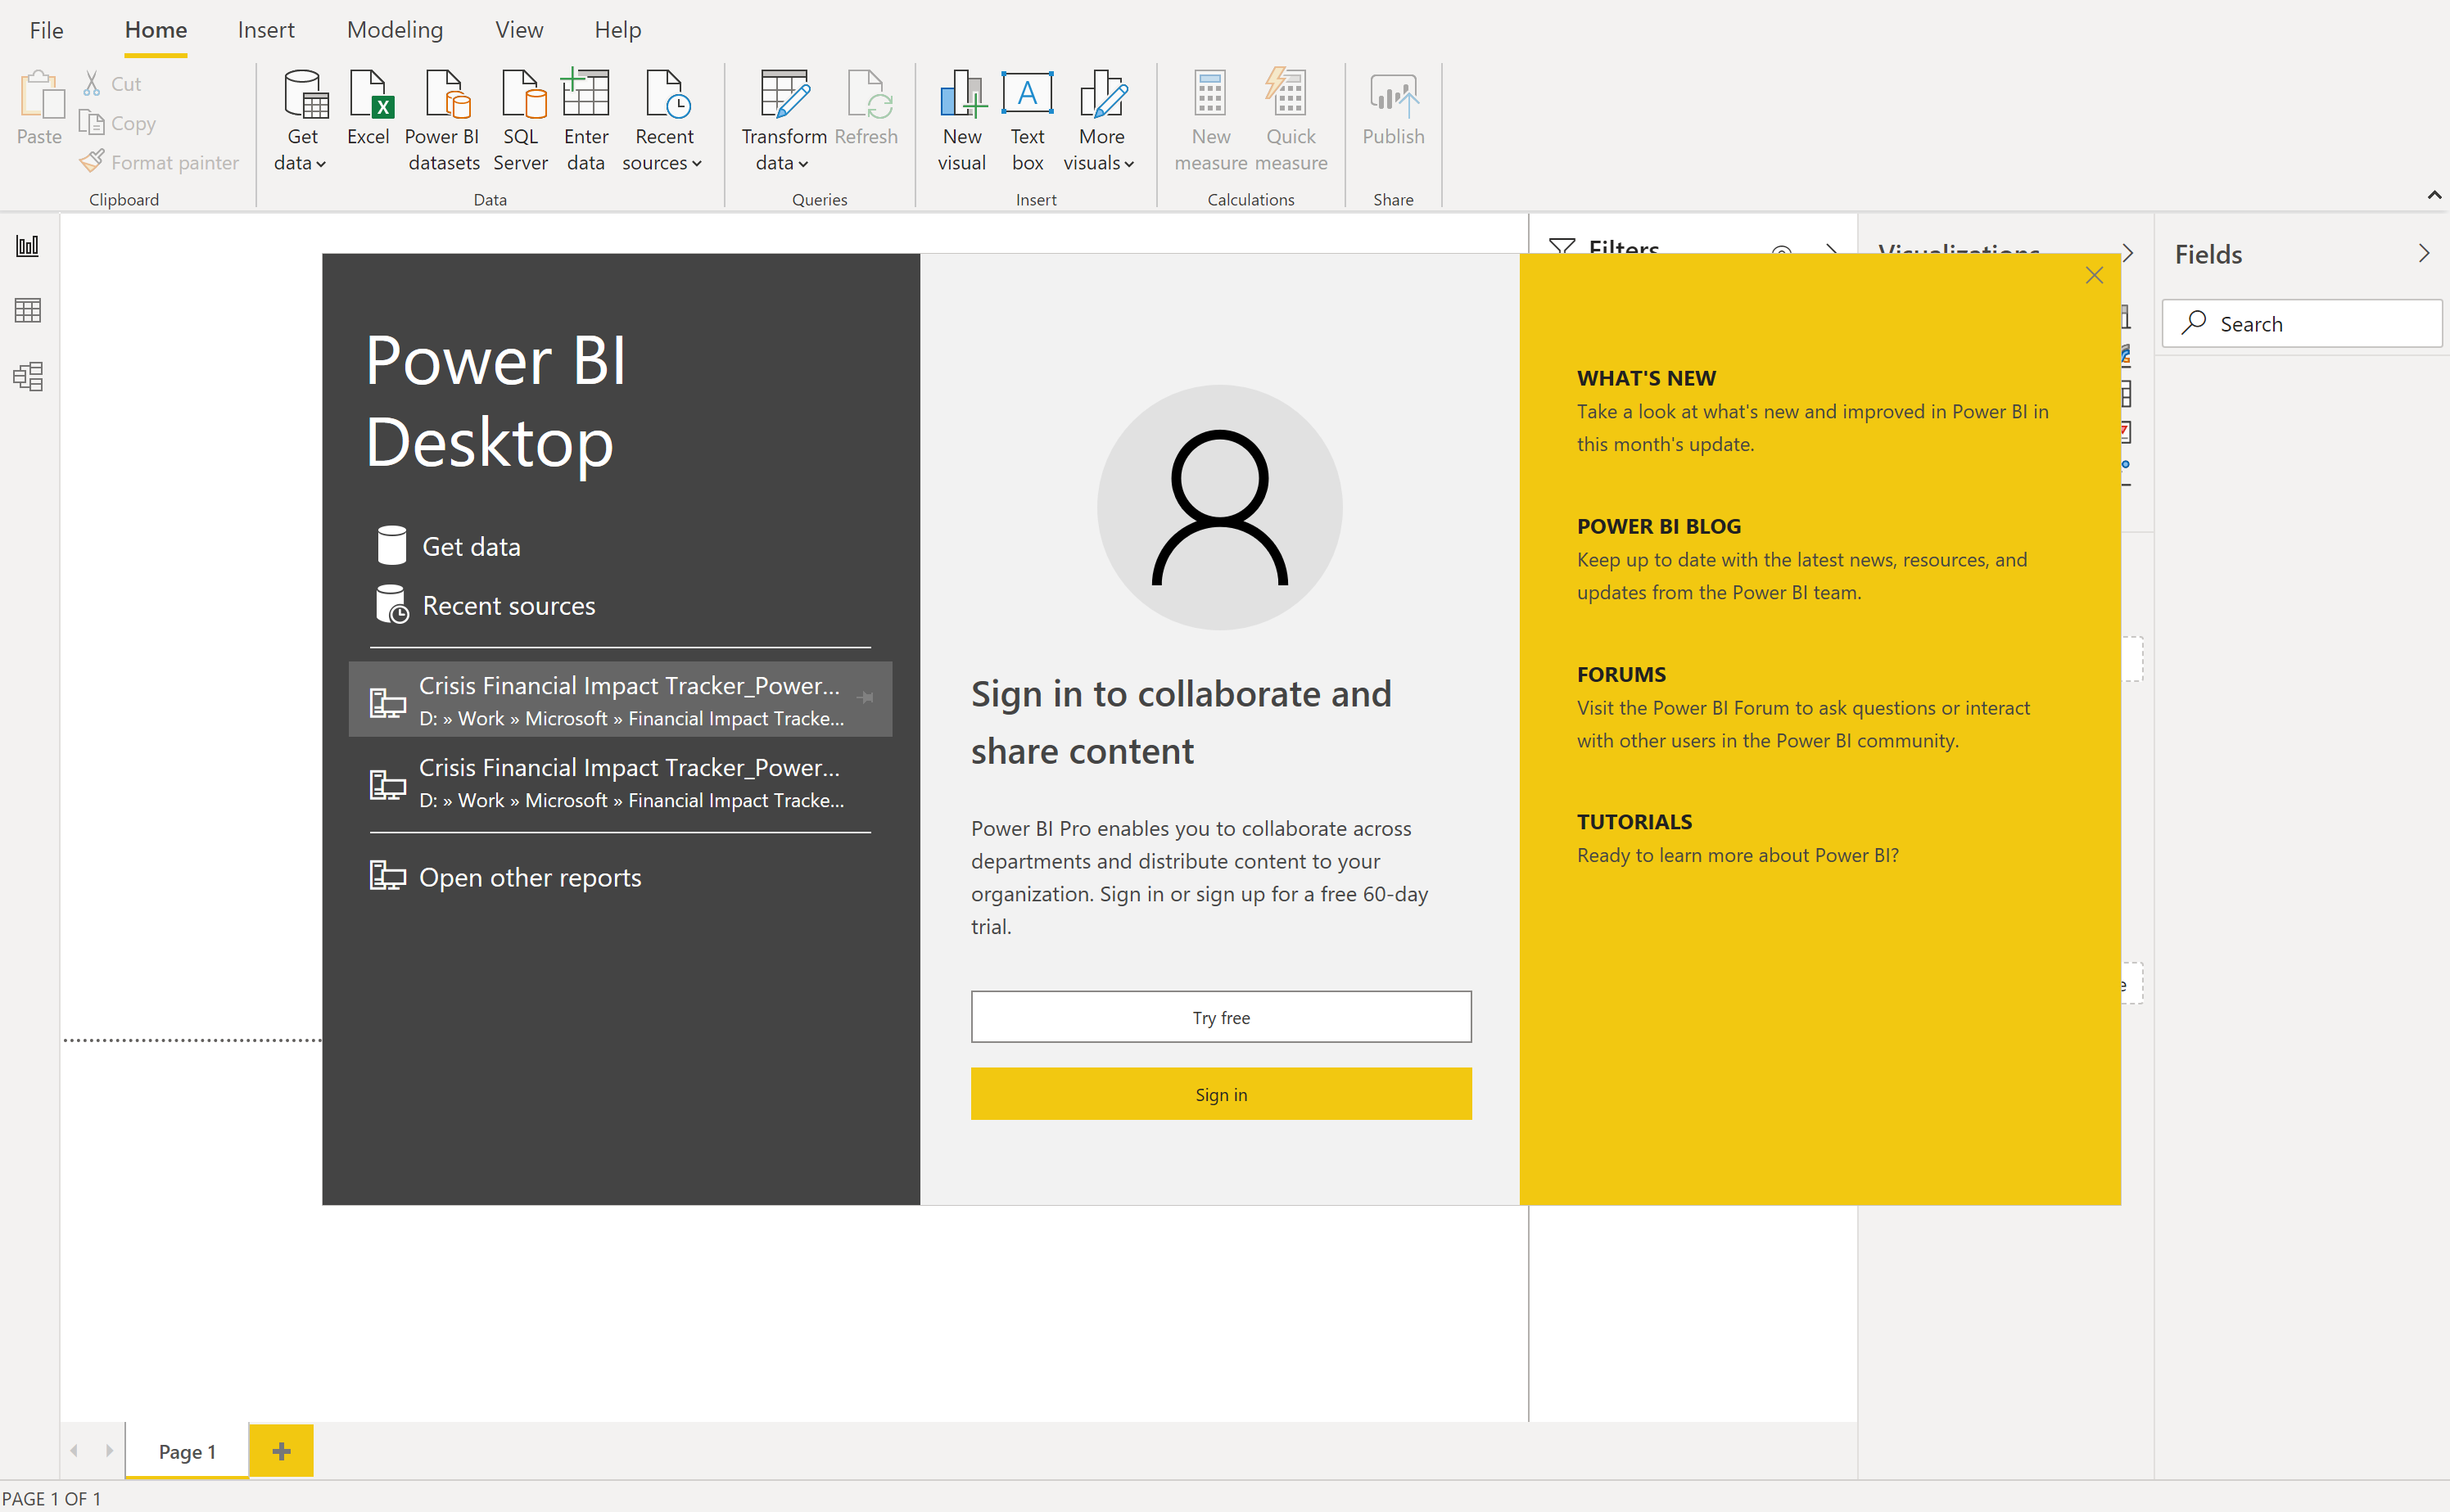
Open Power BI Desktop. You might be prompted to Sign in to the Power BI service by using your work or school account.
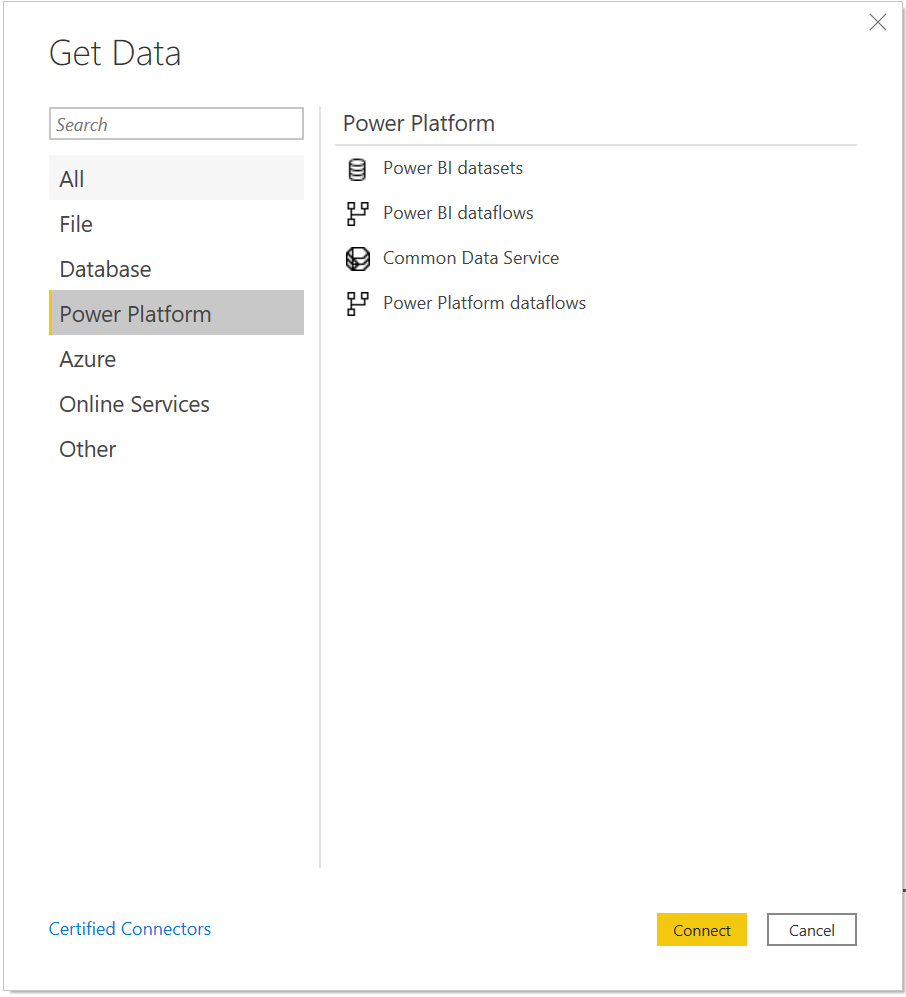
Select Get data > Power Platform > Common Data Service, and then select Connect.

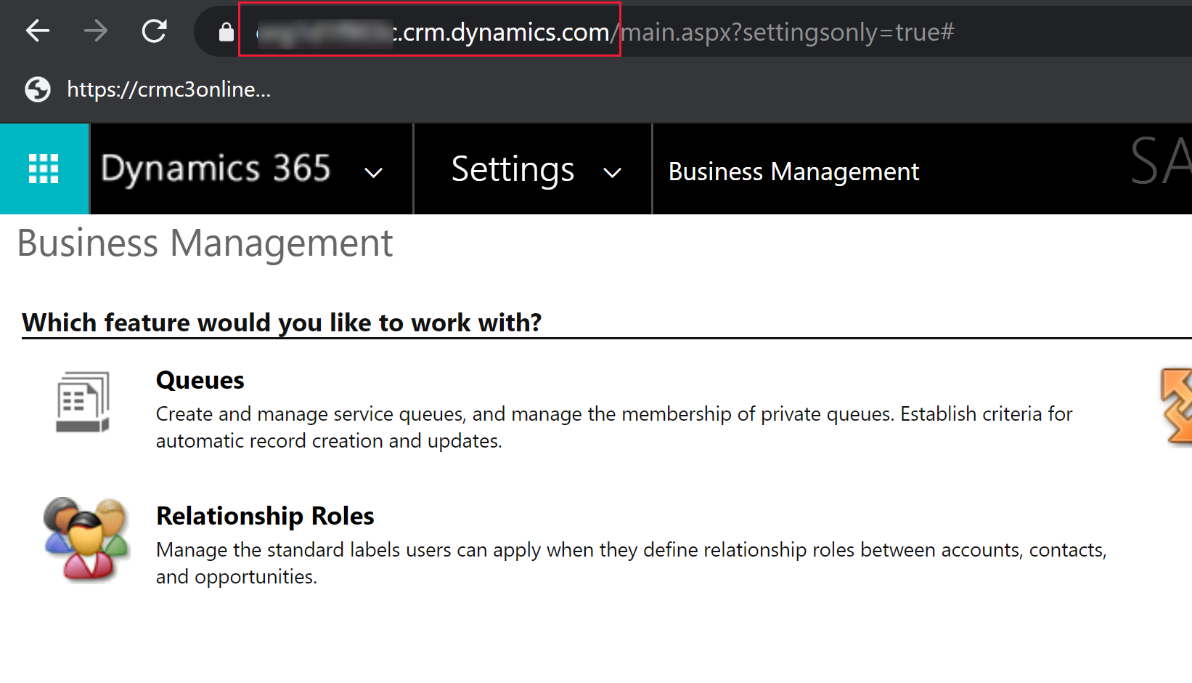
Enter the Server Url that's specific to your Dataverse environment. To get the Dataverse environment URL, do the following:
Open Power Apps, select the environment you're going to connect to, select Settings in the upper-right corner, and then select Advanced settings.
In the new browser tab that opens, copy the root of the URL. This is the unique URL for your environment. The URL will be in the format https://yourenvironmentid.crm.dynamics.com/. Be sure not to copy the rest of the URL.
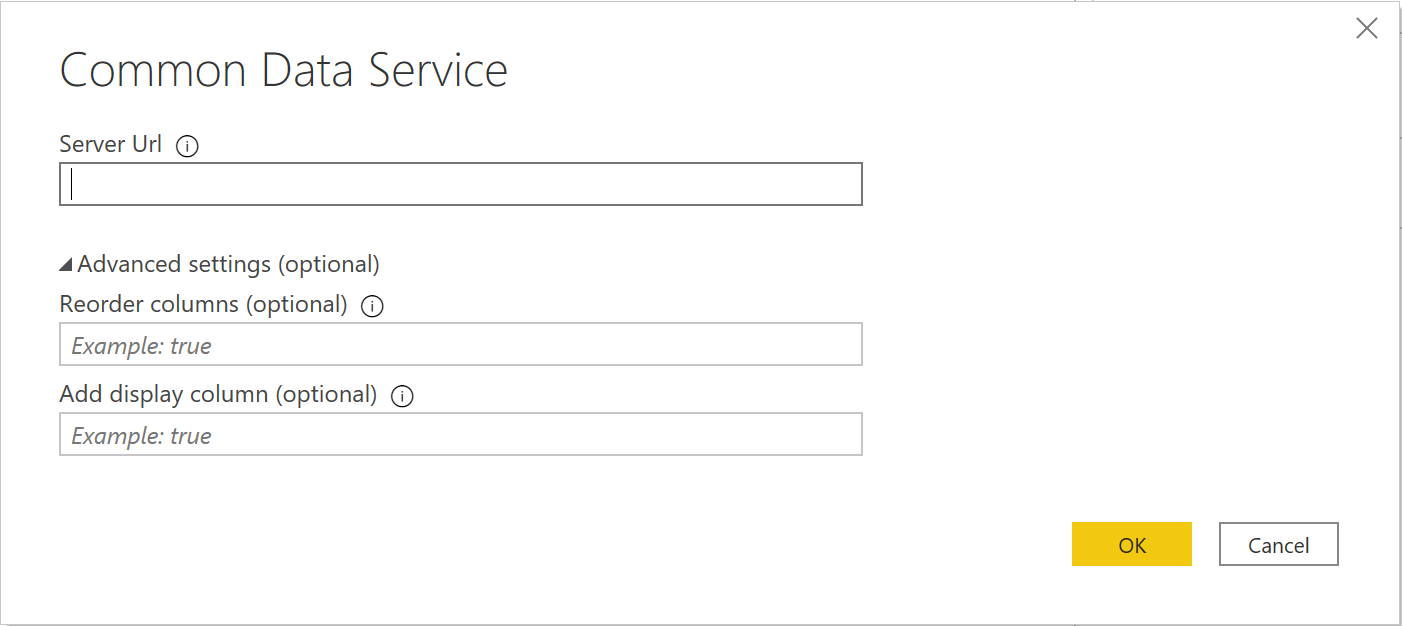
After you successfully connect to your environment, you can see the folders for Entities and System in the Navigator. Expand Entities, and select the check boxes for the following entities:
Account
Contact
msft_Campus
msft_College
msft_Department
msft_EmployeeCompensation
msft_Grant
msft_LossReason
msft_PayPeriod
msft_SponsoredProgram
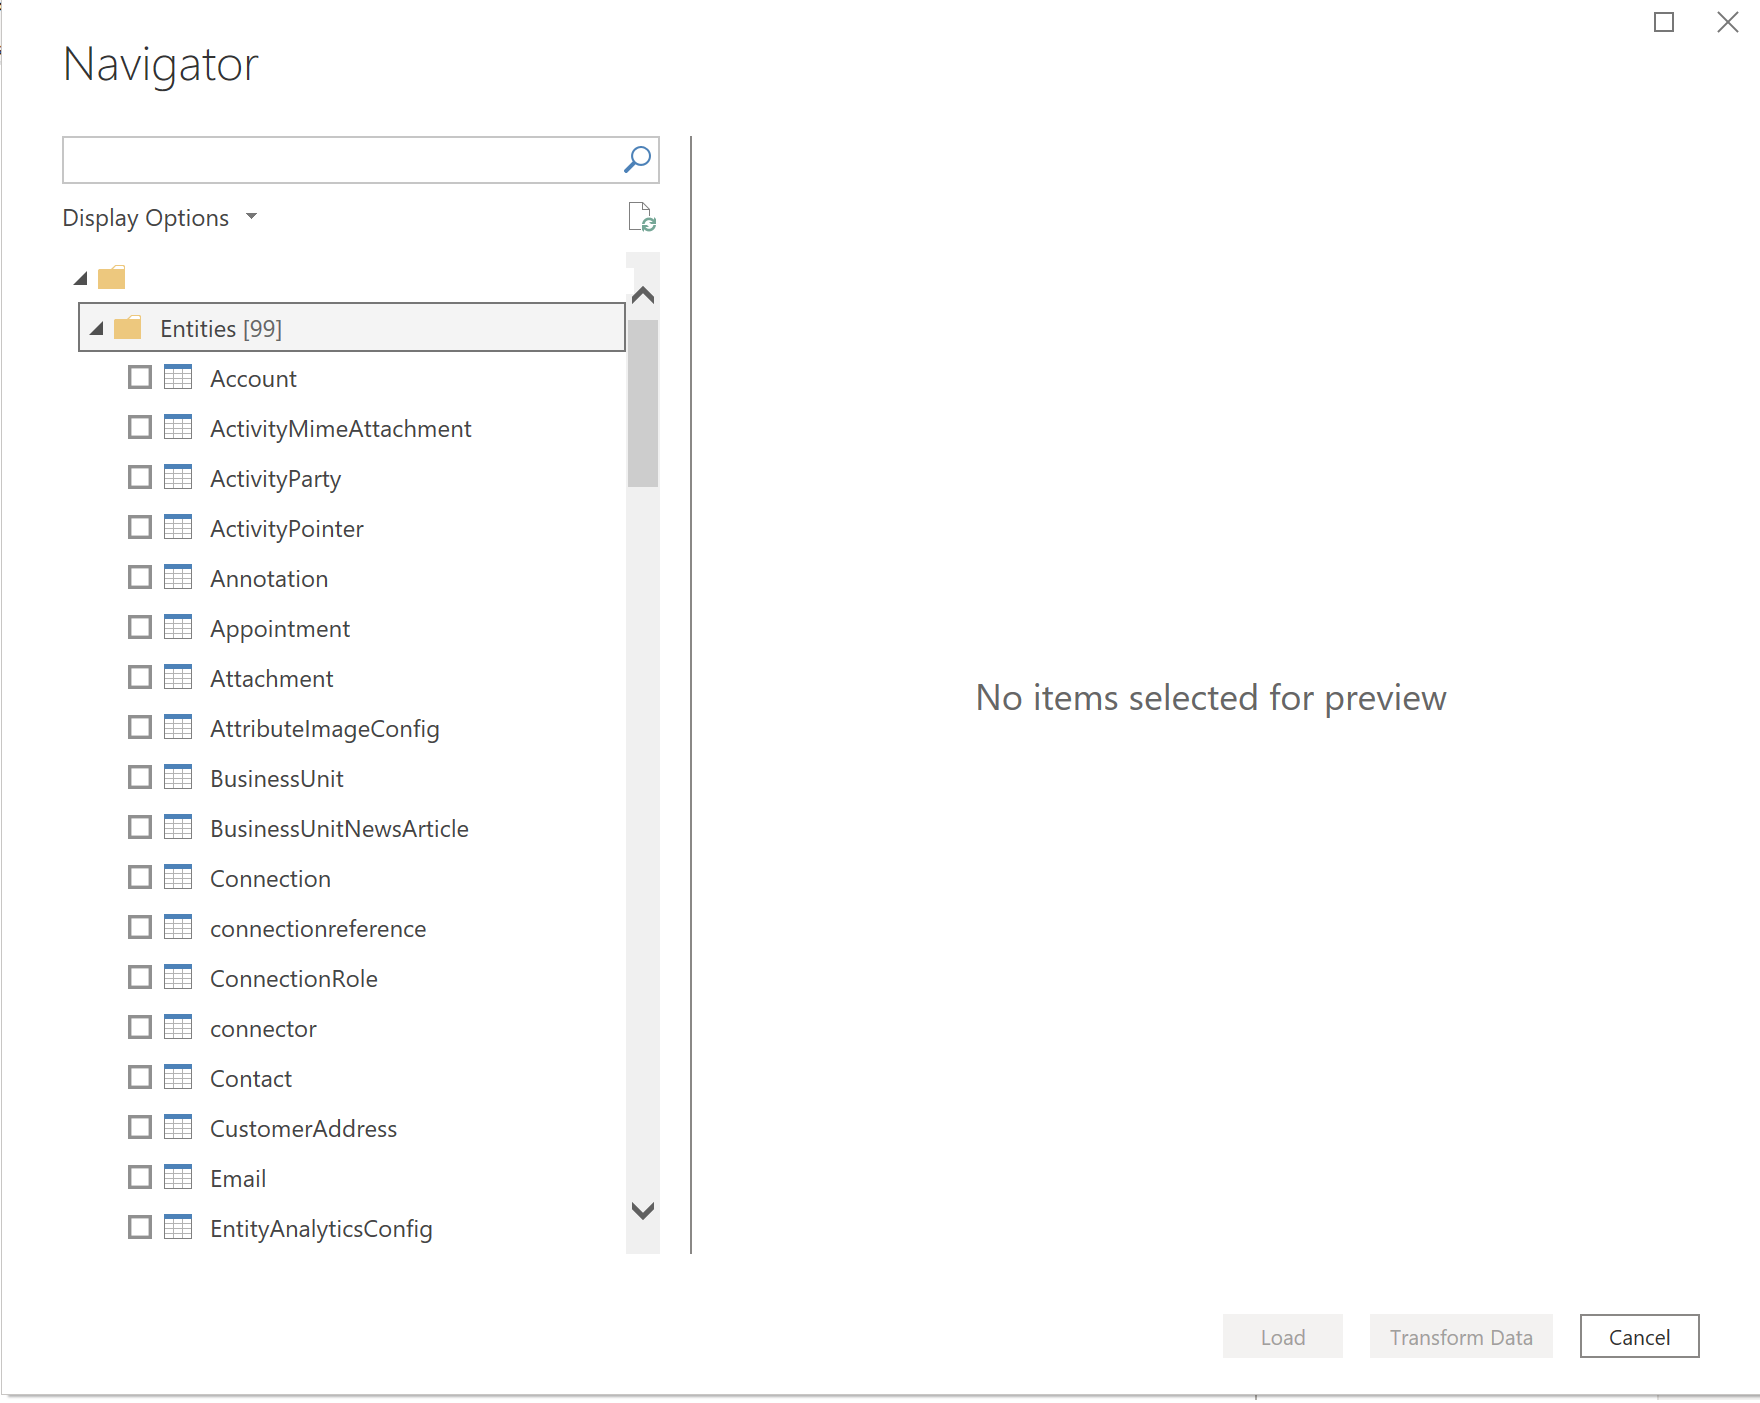
After you finish selecting the list of entitites, select Transform Data. The Query Editor window opens with the selected tables and data loaded.
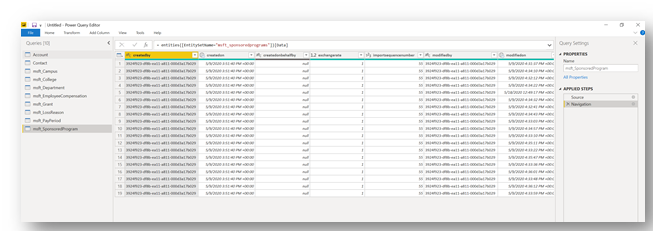
For each entity, select Choose Columns in the ribbon to open the console and select which fields to use in the data model and in reports.

The following are suggested fields for the Contact entity:
- msft_annualbasesalary
- msft_annualbasesalary_base
- msft_annualtuitionreimbursement
- msft_annualtuitionreimbursement_base
- msft_contacttype
- msft_department
- msft_employmentclass
- msft_showwelcomemessage
- msft_userid
The following are suggested fields for the msft_Campus entity:
- msft_campusdescription
- msft_campusid
- msft_campusname
The following are suggested fields for the msft_College entity:
- msft_campus
- msft_collegedescription
- msft_collegeid
- msft_collegename
The following are suggested fields for the msft_Department entity:
- msft_college
- msft_departmentdescription
- msft_departmentid
- msft_departmentname
The following are suggested fields for the msft_EmployeeCompensation entity:
- msft_effortamount
- msft_effortamount_base
- msft_effortpercentage
- msft_employee
- msft_employeecompensationid
- mstf_fte
- msft_lossamount
- msft_lossamount_base
- msft_losspercentage
- msft_lossreason
- msft_name
- msft_paygroup
- msft_paygroup_display
- msft_payperiod
- msft_payrate
- msft_payrate_base
- msft_sponsoredprogram
The following are suggested fields for the msft_Grant entity:
- msft_enddate
- msft_grantdescription
- msft_grantid
- msft_grantnumber
- msft_grantstatus
- msft_grantstatus_display
- msft_granttitle
- msft_principalinvestigator
- msft_startdate
The following are suggested fields for the msft_LossReason entity:
- msft_lossreasoncode
- msft_lossreasondescription
- msft_lossreasonid
The following are suggested fields for the msft_PayPeriod entity:
- msft_enddate
- msft_payperiodcode
- msft_payperioddescription
- msft_payperiodid
- msft_startdate
The following are suggested fields for the msft_SponsoredProgram entity:
- msft_availablebalance
- msft_availablebalance_base
- msft_awardamount
- msft_awardamount_base
- msft_coprincipalinvestigator
- msft_department
- msft_effortlossimpactamount
- msft_effortlossimpactamount_base
- msft_effortlossimpactamount_date
- msft_effortlossimpactamount_state
- msft_effortlossimpactpercentage
- msft_grant
- msft_primesponsorname
- msft_sponsoredprogramdescription
- msft_sponsoredprogramid
- msft_sponsoredprogramnumber
- msft_sponsorname
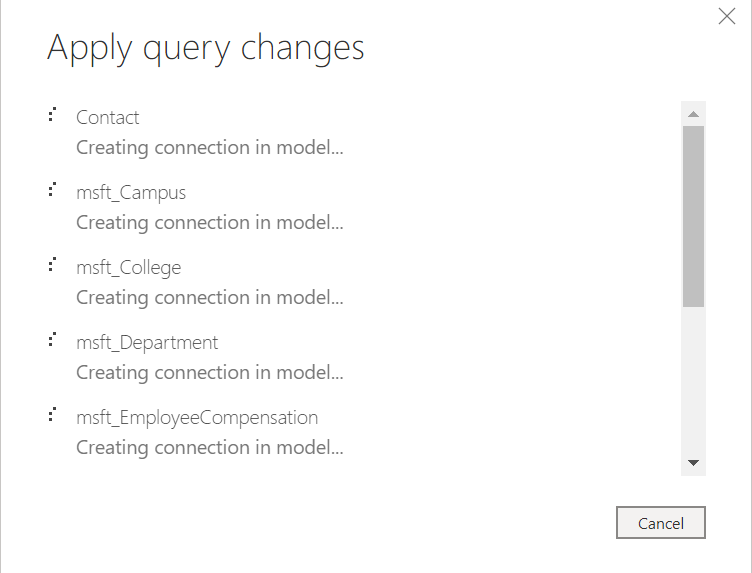
Select Close & Apply to close the Query Editor and apply the changes you made.
You'll see the following screen in the Power BI report canvas. It might take several minutes for the queries to run.
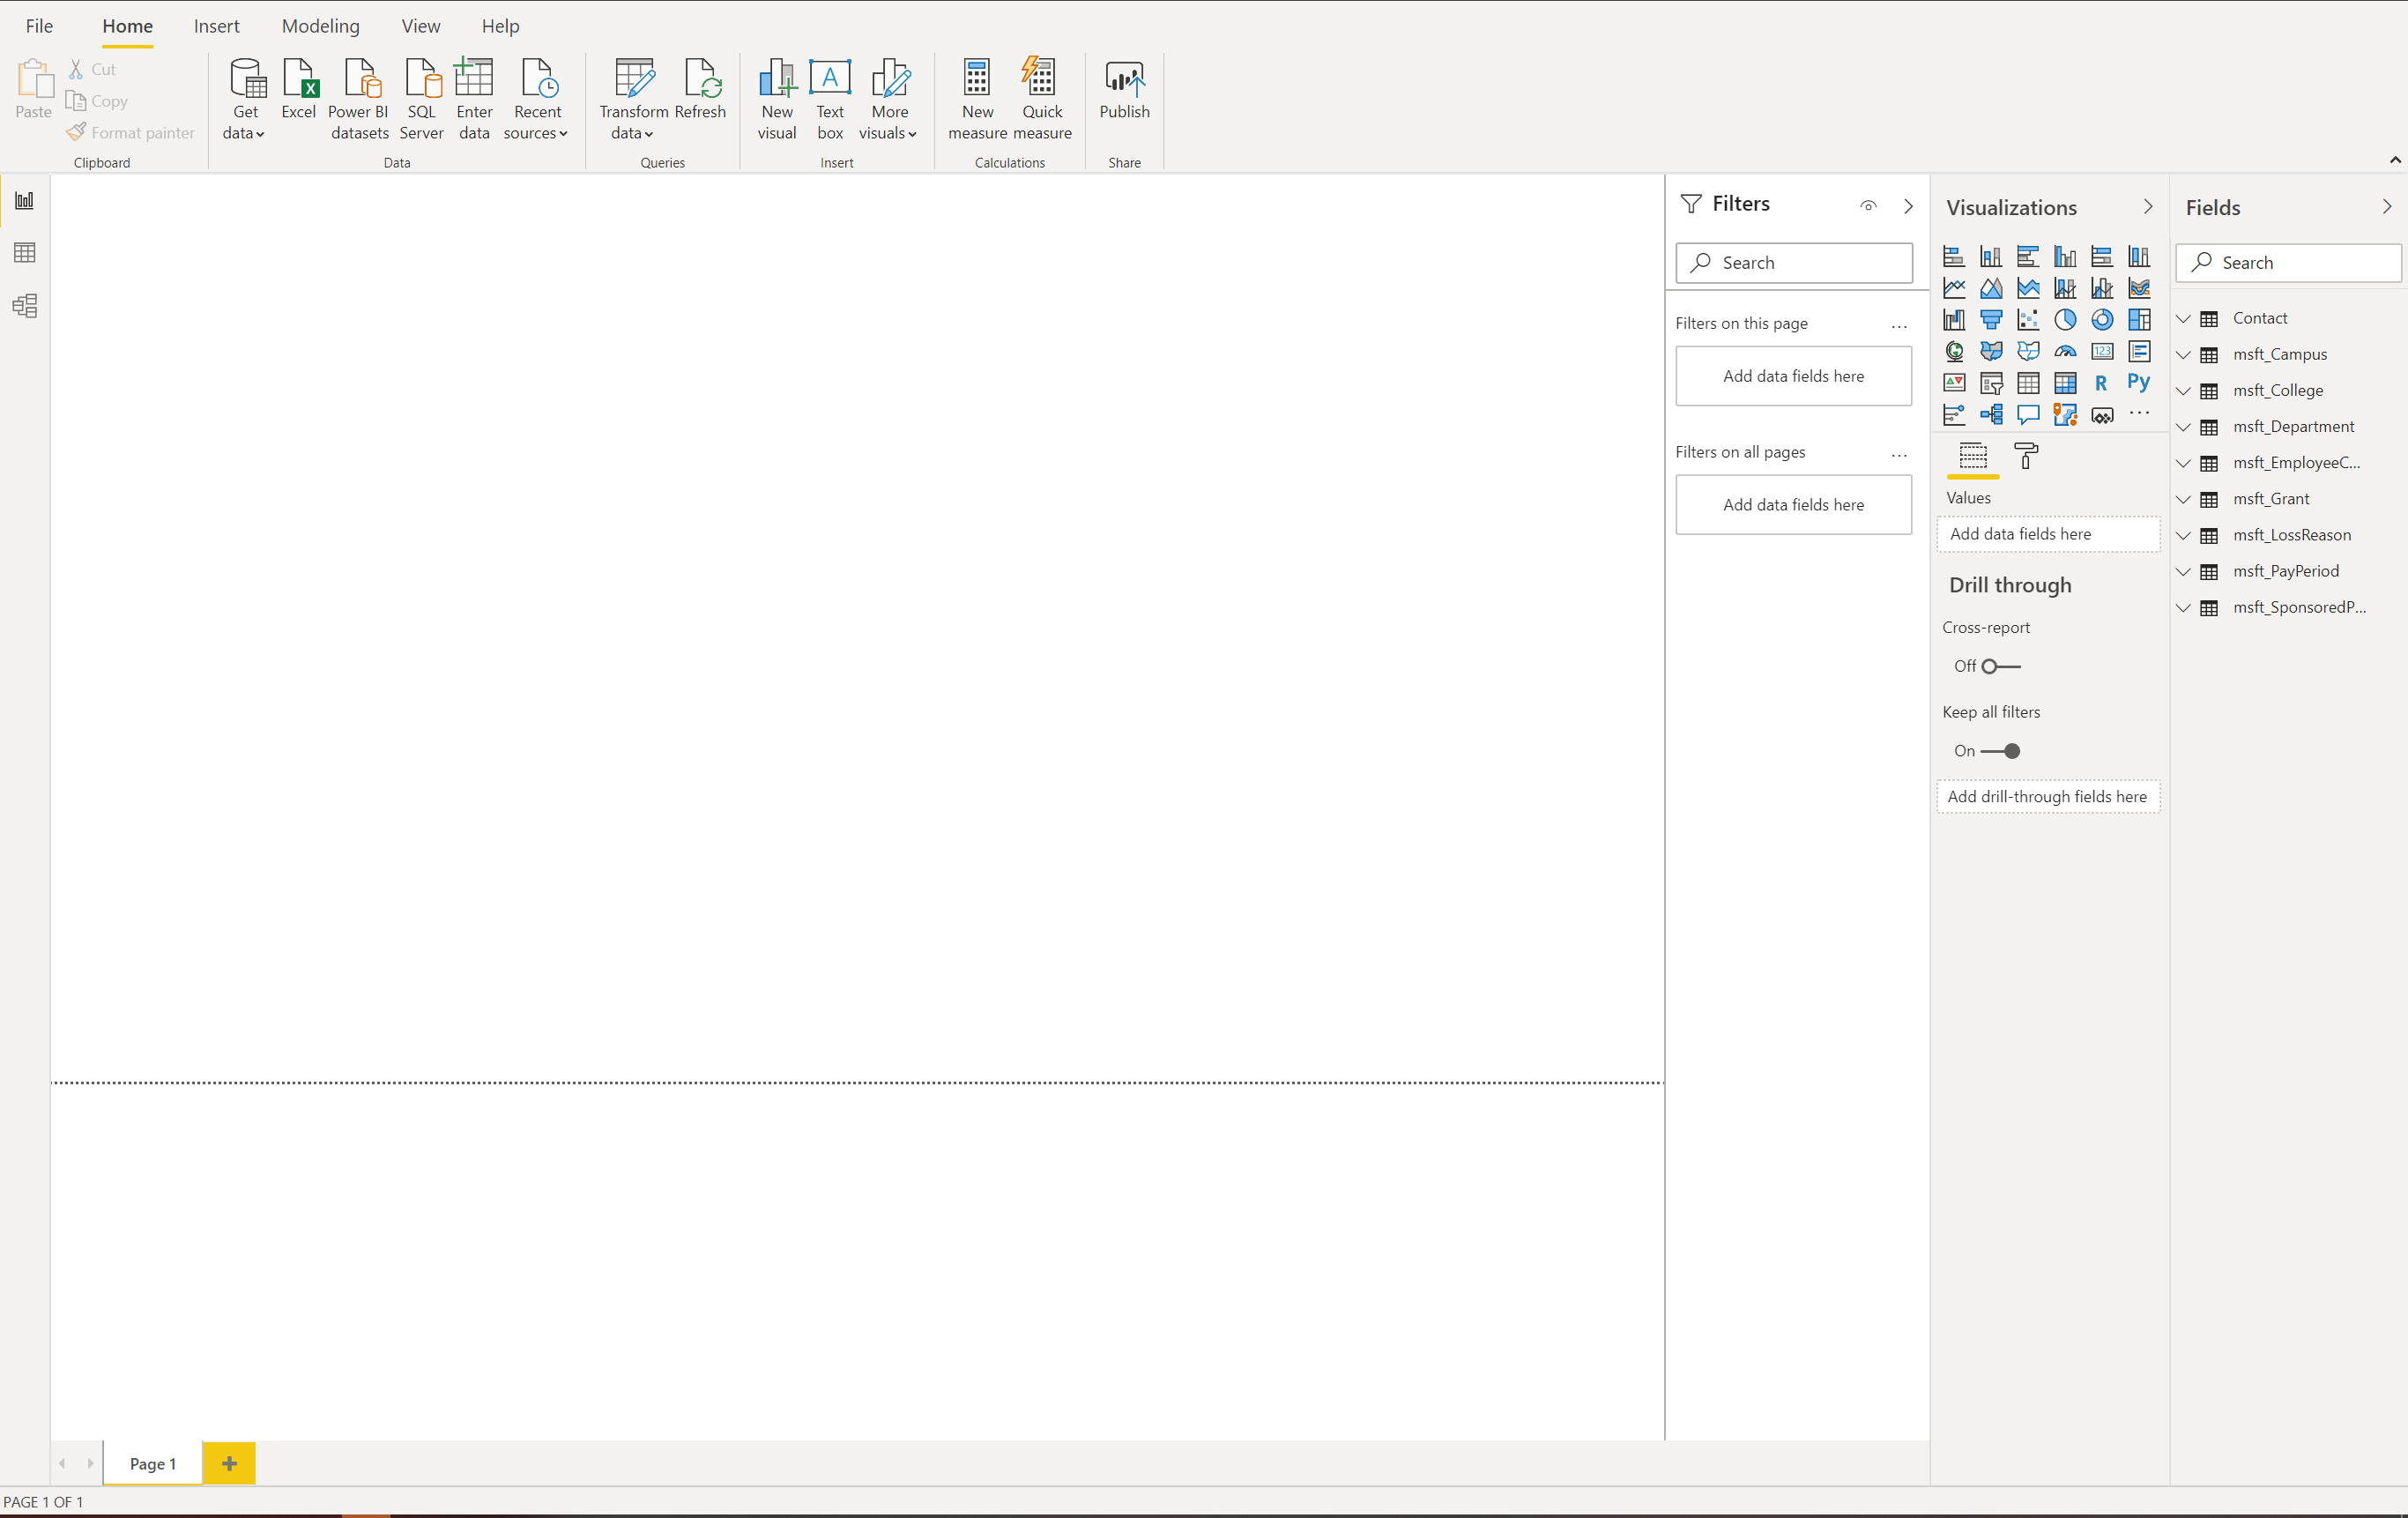
After the changes are applied, the Power BI report canvas looks similar to the following screenshot, including the tables listed in the Fields panel on the right side of the page.
Select the icon on the left side of the page to open the Model view. You will see the tables that you selected. Use the slider in the lower-right corner to adjust the view size.


On the Home tab, select Manage Relationships to open the console where you'll create new relationships among the entities.

When creating or editing relationships among entities, you select the tables and columns to be joined, in addition to the Cardinality and Cross-filter direction for the relationship.
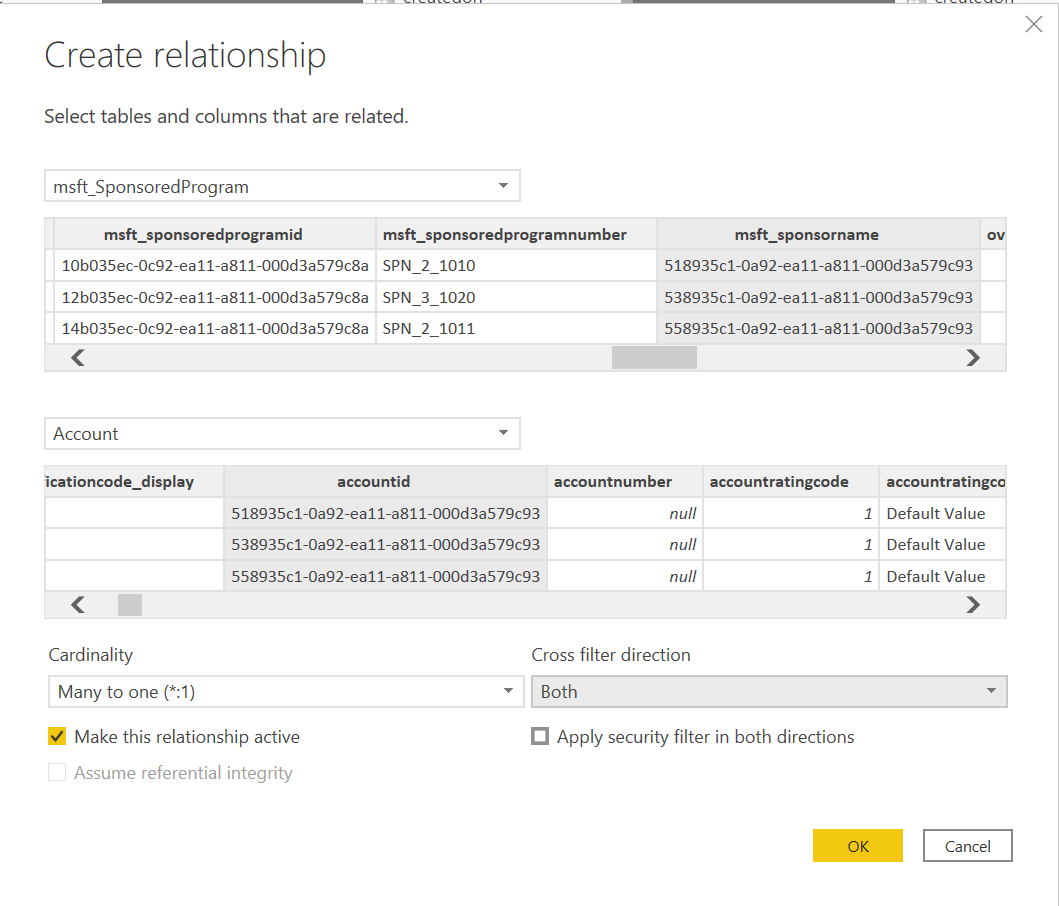
To use the suggested fields in Dataverse that are pertinent to the Power BI template, your relationship mapping between tables should look like the following.
From: Table To: Table msft_College (msft_campus) msft_Campus (msft_campusid) msft_Department (msft_college) msft_College (msft_collegeid) msft_EmployeeCompensation (msft_lossreason) msft_LossReason (msft_lossreasonid) msft_EmployeeCompensation (msft_payperiod) msft_PayPeriod (msft_payperiodid) msft_EmployeeCompensation (msft_sponsoredprogram) msft_SponsoredProgram (msft_sponsoredprogramid) msft_SponsoredProgram (msft_coprincipalinvestigator) Contact (contactid) msft_SponsoredProgram (msft_department) msft_Department (msft_departmentid) msft_SponsoredProgram (msft_grant) msft_Grant (msft_grantid) 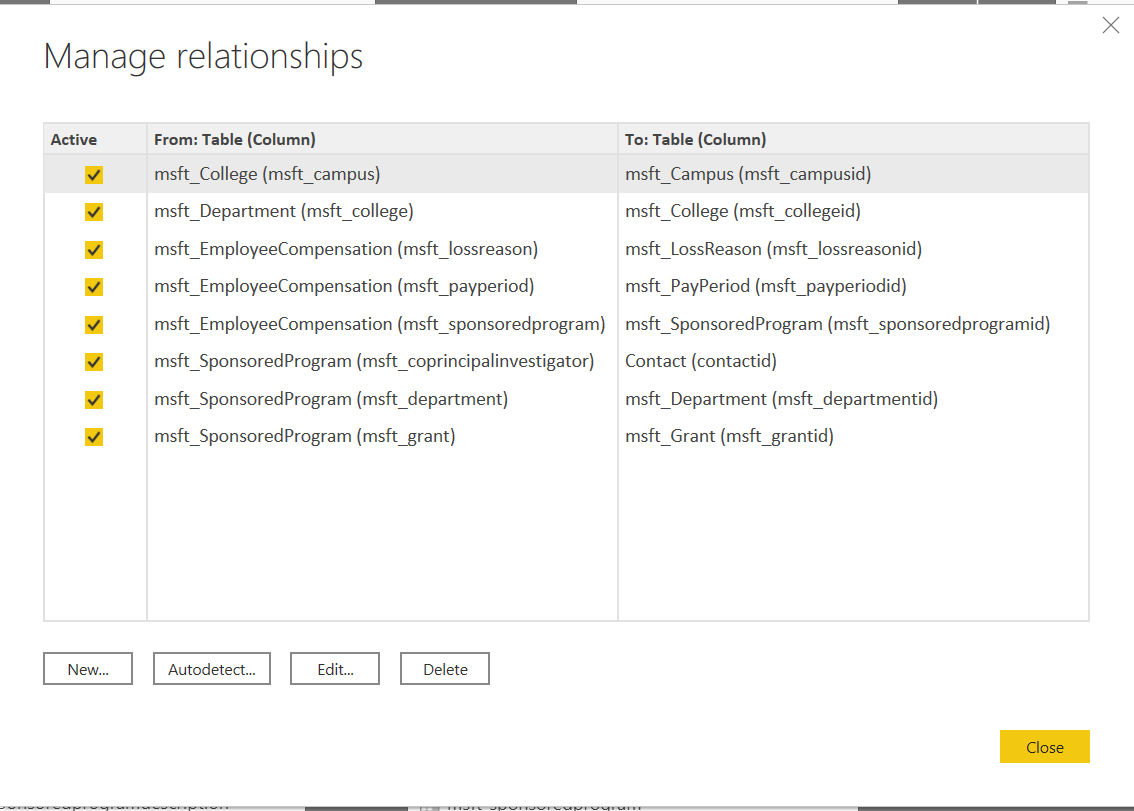
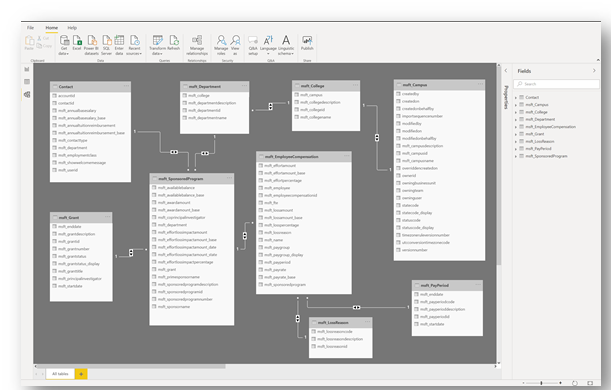
The following screenshot shows the Entity Relationship Diagram in the Model view.
Configure a Power BI report by using a Power BI template
The Power BI template contains sample data and interactive graphics in a .pbix file format that you can further edit and update in Power BI Desktop. Download the template as part of the overall solution from GitHub.
Open the Power BI template
When you open the template, you're greeted with a Power BI splash screen. You might also be prompted to Sign in to the Power BI service by using your work or school account.
When you open the Power BI template, you'll see a series of tabs at the bottom of the report:
Legal: Contains Microsoft legal disclaimer.
Home: Contains sample text that you can use and modify according to yoru preference.
Information: Contains general information.
FAQ: Contains frequently asked questions.
Submissions: Opens the Submissions Report page.
Sponsors: Opens the Impact by Sponsor Report page.
Department: Opens the Department view.
Your organization can add its logos to all pages in the template by inserting an image on the page and then copying it to other pages. More information: Copy and paste a report visualization
Connect to Dataverse
To use your own data collected by the Higher Education Crisis Financial Impact Tracker app, you need to update the data connection in the template. More information: Create a Power BI report using the Common Data Service connector
To change the data source, select Transform data to open Query Editor. In the Applied Steps of Query Editor, change the Source for each entity. Use the Dataverse environment URL.
Issues and feedback
- To report an issue with the Higher Education Crisis Financial Impact Tracker app, visit https://aka.ms/crisis-financial-impact-tracker-issues.
- For feedback about Higher Education Crisis Financial Impact Tracker app, visit https://aka.ms/crisis-financial-impact-tracker-feedback.
Feedback
Coming soon: Throughout 2024 we will be phasing out GitHub Issues as the feedback mechanism for content and replacing it with a new feedback system. For more information see: https://aka.ms/ContentUserFeedback.
Submit and view feedback for