Part2 : Visual Studio 2012 Profiler
In this post, we will cover the new features added in Visual Studio 2012 (VS12) Profiler. In addition to features present in Visual Studio 2010(VS10) Profiling tools, VS12 also supports Windows 8 and Windows Server 2012 Apps profiling for testing, analyzing and finding performance bottlenecks.
This post gives a high level idea about profiling on Windows 8 and Windows Server 2012 platforms. Content of this post comes from one of the A-Team members Harsh Jain.
Windows 8 and Windows Server 2012 Apps (Apps) can be written in
a. JavaScript and HTML5
b. Visual C++, Visual C#, or Visual Basic
When profiling a Windows Store app that is written in JavaScript and HTML 5, Instrumentation method is used to collect data for the JavaScript code. For Windows Store app that is written in Visual C++, Visual C#, or Visual Basic, CPU sampling method is used to collect data for the native and managed code.
Windows Store apps run on a wide variety of devices, form factors, and processor types which need not have Visual Studio installed. Profiling on Windows Store Apps can be done on local machine as well as on a remote device. Profiling on Remote Device has been introduced in VS12 for Windows Store Apps.
Remote profiling lets you collect performance data on any device that is connected to your Visual Studio computer over a network or that is connected directly through an Ethernet cable. When you profile remotely, Visual Studio deploys the latest build of your app. You can start your app immediately, or you can profile your app after it is started by a contract or some other process.
Steps for Profiling Win8
App written in JavaScript and HTML5 on Local Machine:-
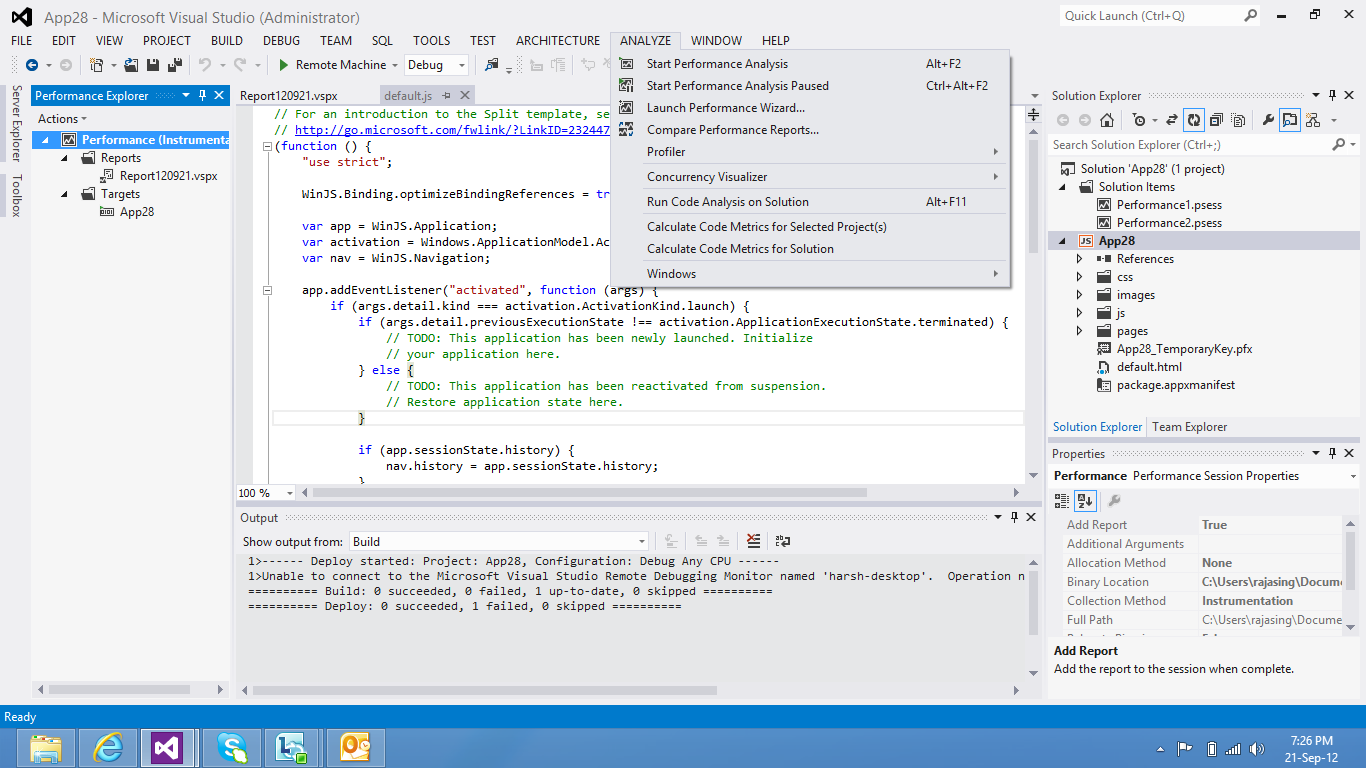
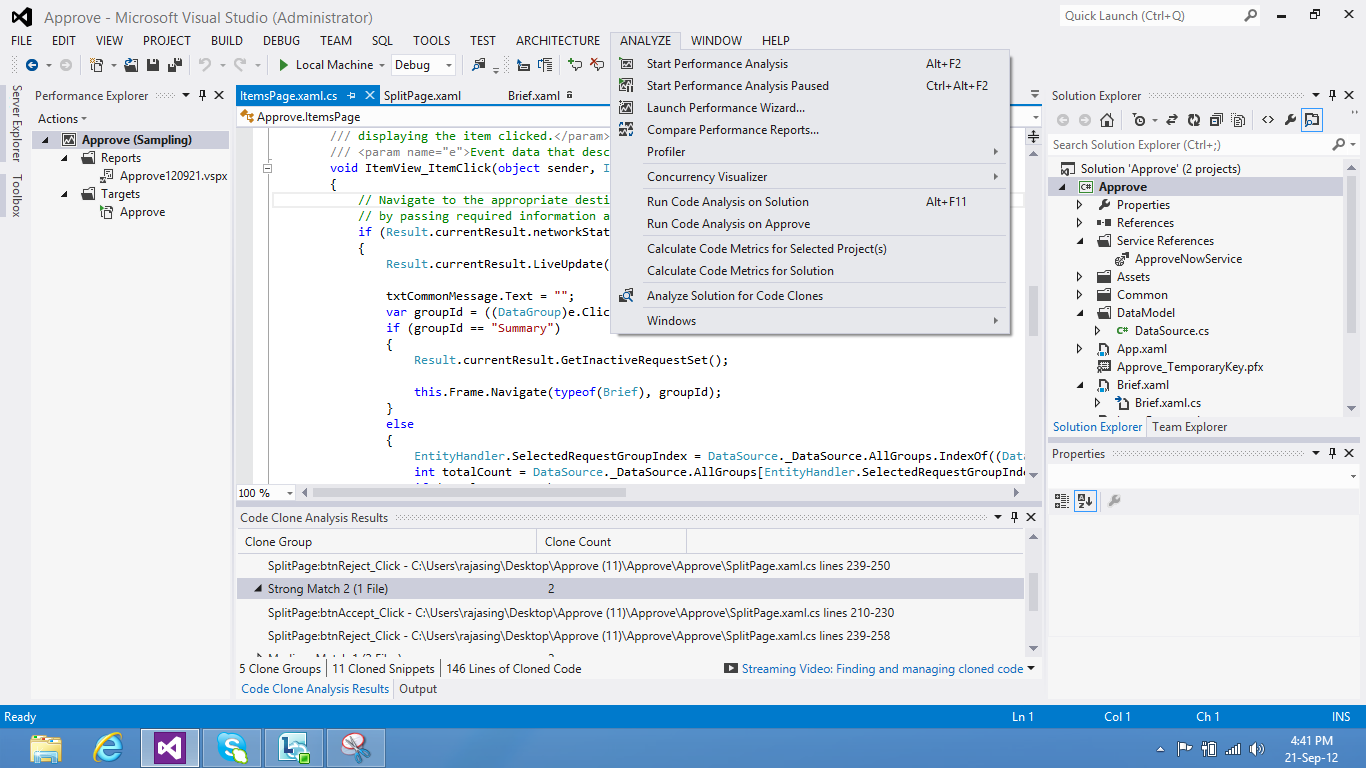
1. Select ANALYZE option from Menu Bar. Click on Launch Performance Wizard.
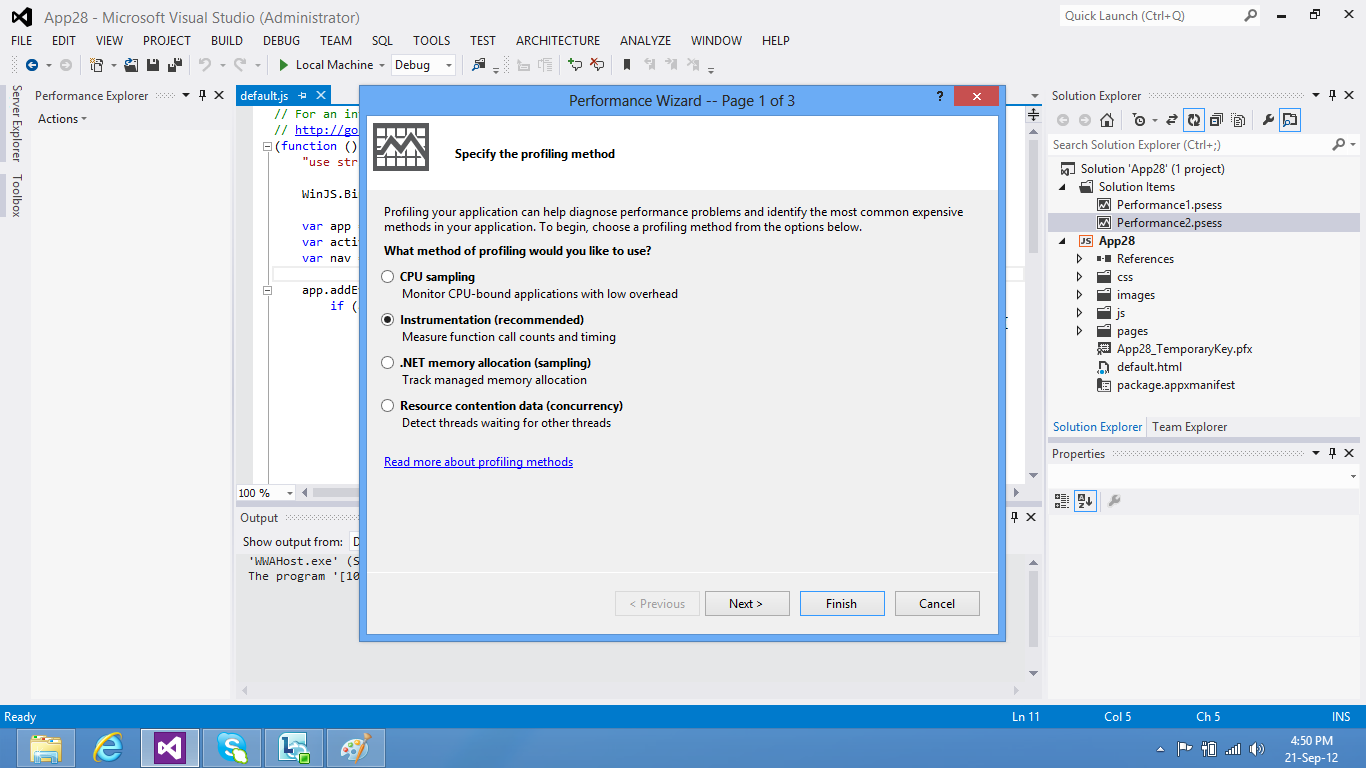
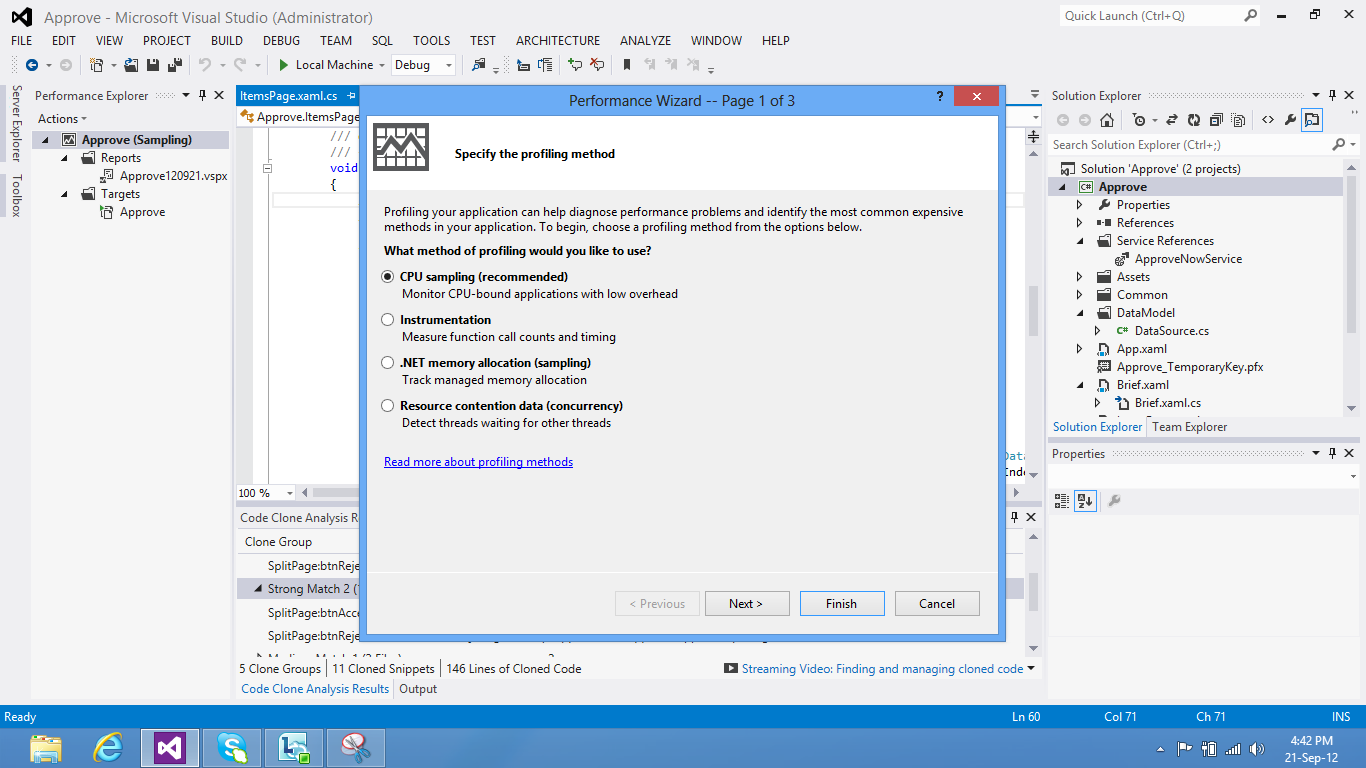
2. Specify the Profiling method you want to use. Instrumentation option is selected by default (and recommended) when we launch Performance Wizard. Click Next.
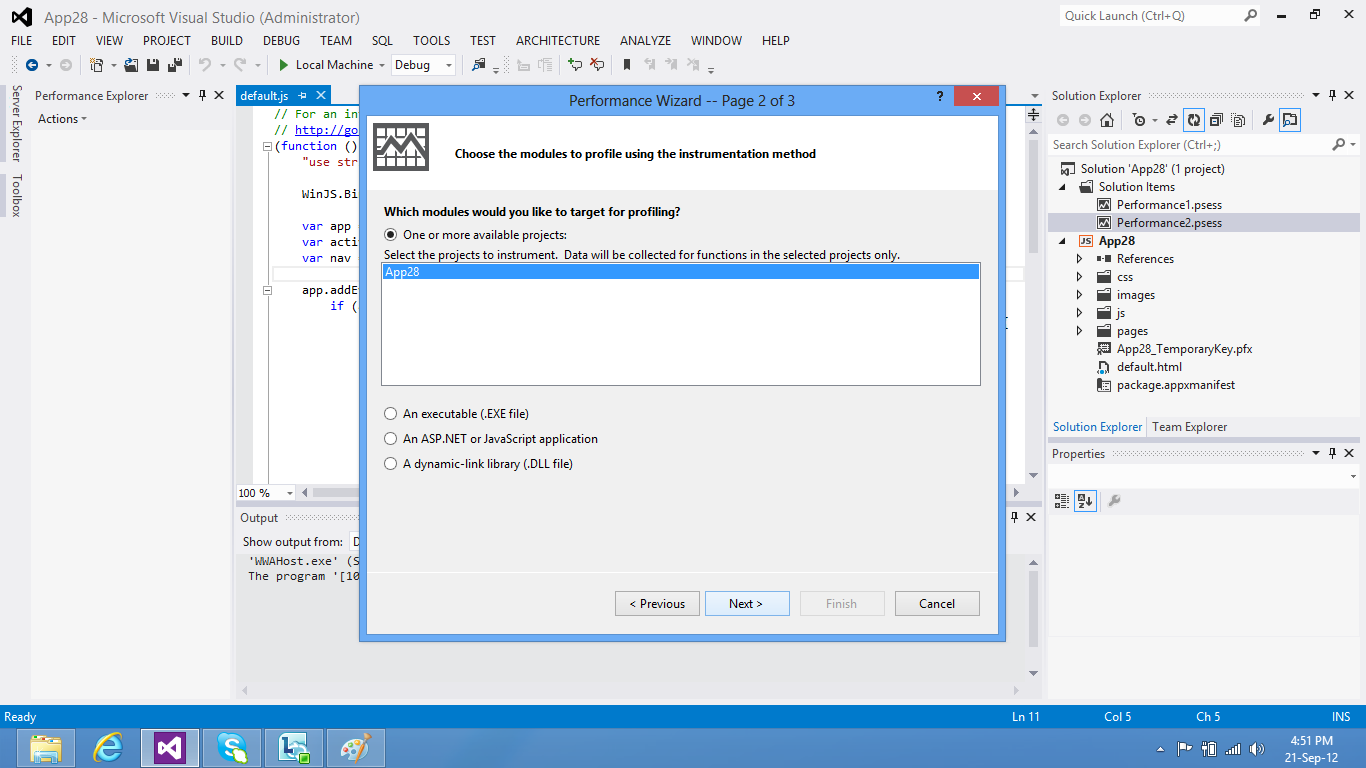
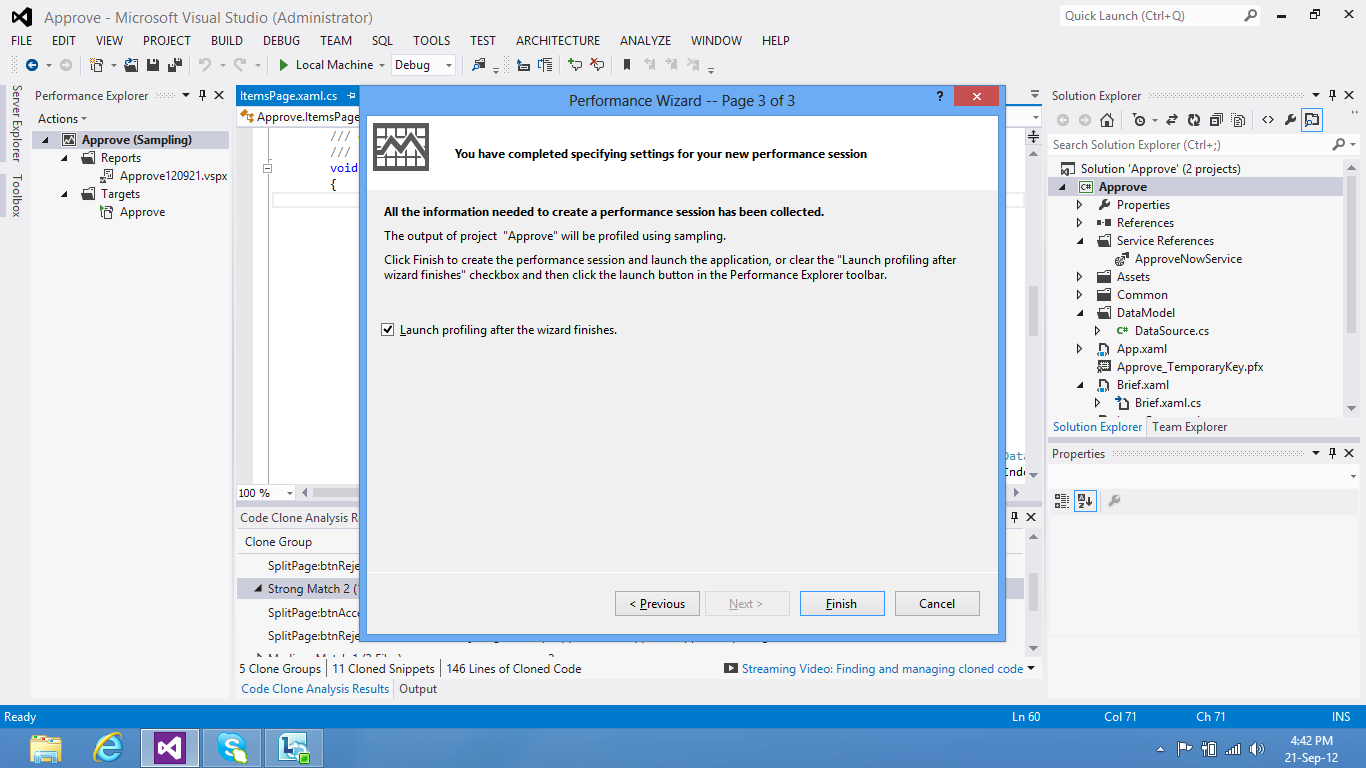
3. Choose the module to profile. Project app will be selected by default. Click Next. In the next screen, click Finish. If you don’t want to start profiling immediately, Uncheck “Launch profiling after the Wizard finishes” and click Finish.
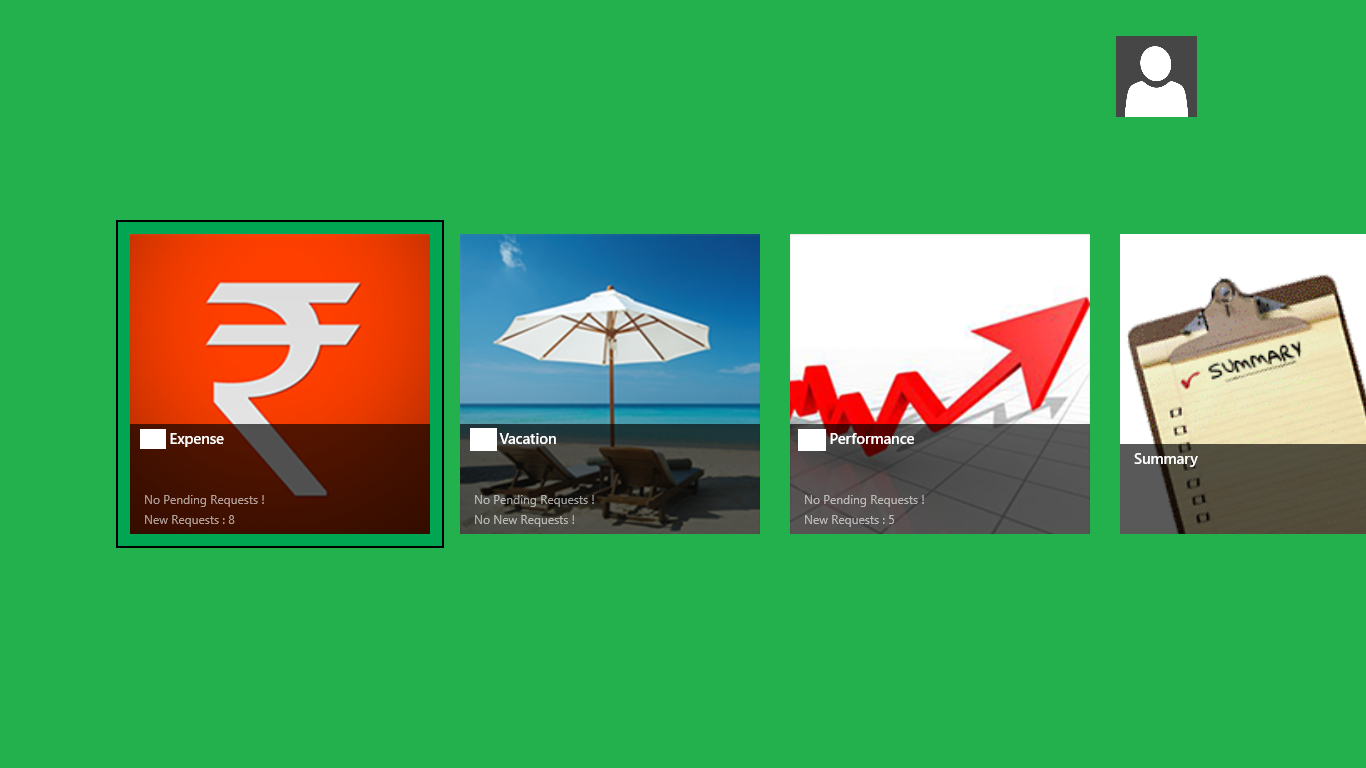
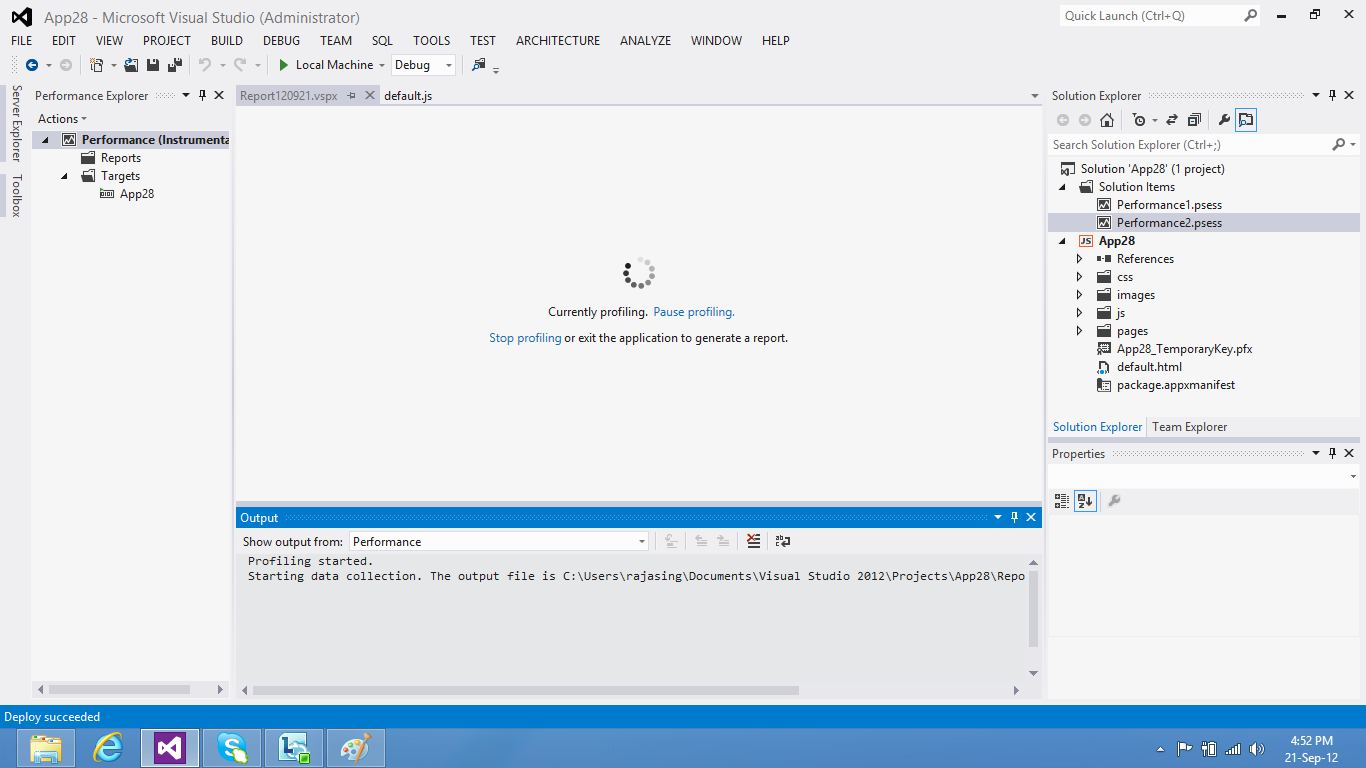
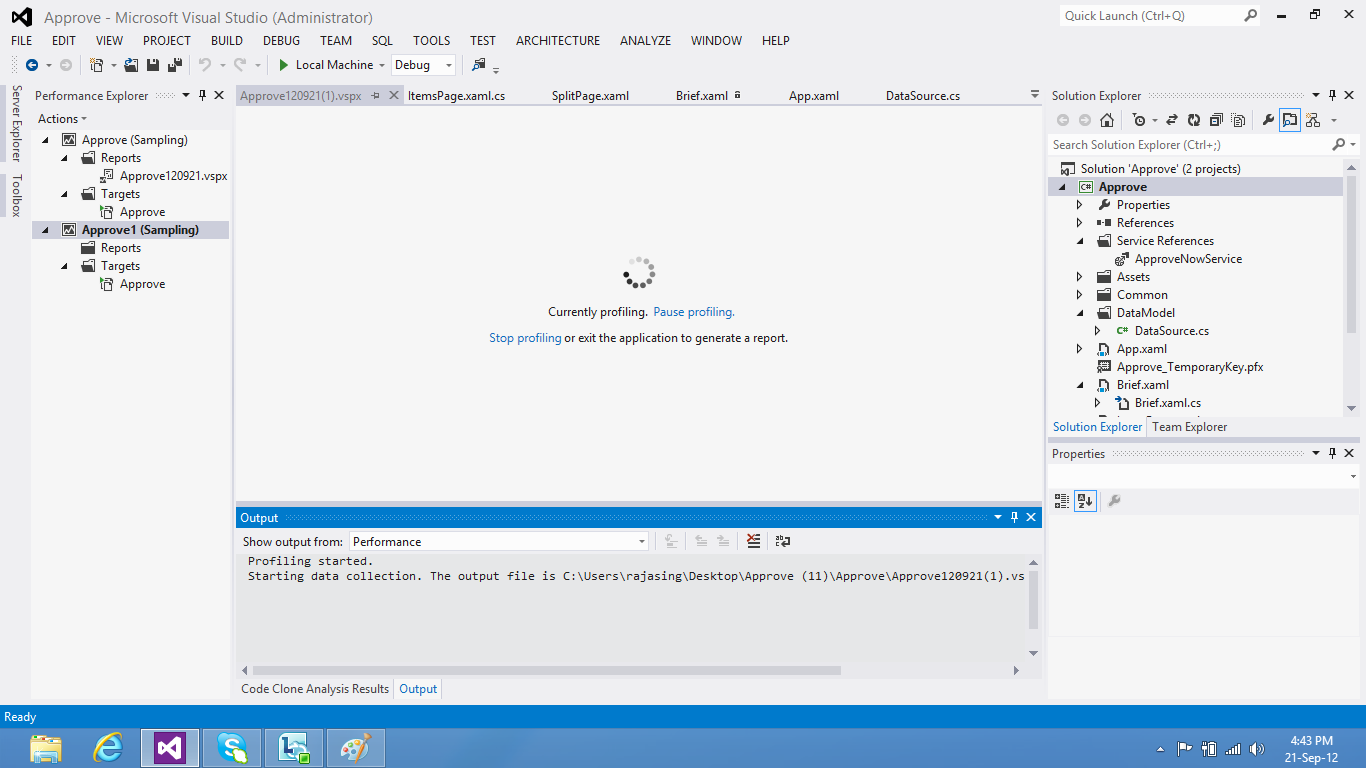
4. Application will be launched with profiler. Execute the functionality of app. Use profiler session screen to pause/stop profiling as shown below
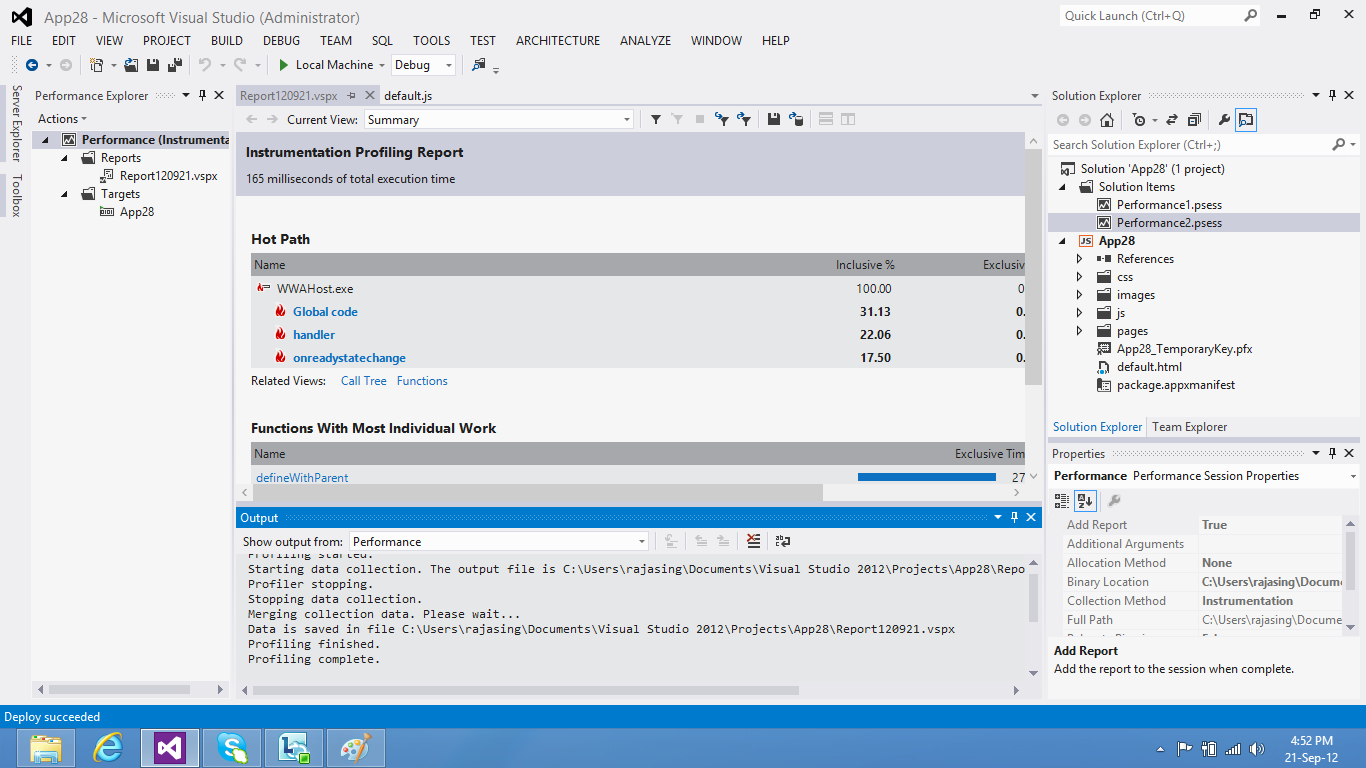
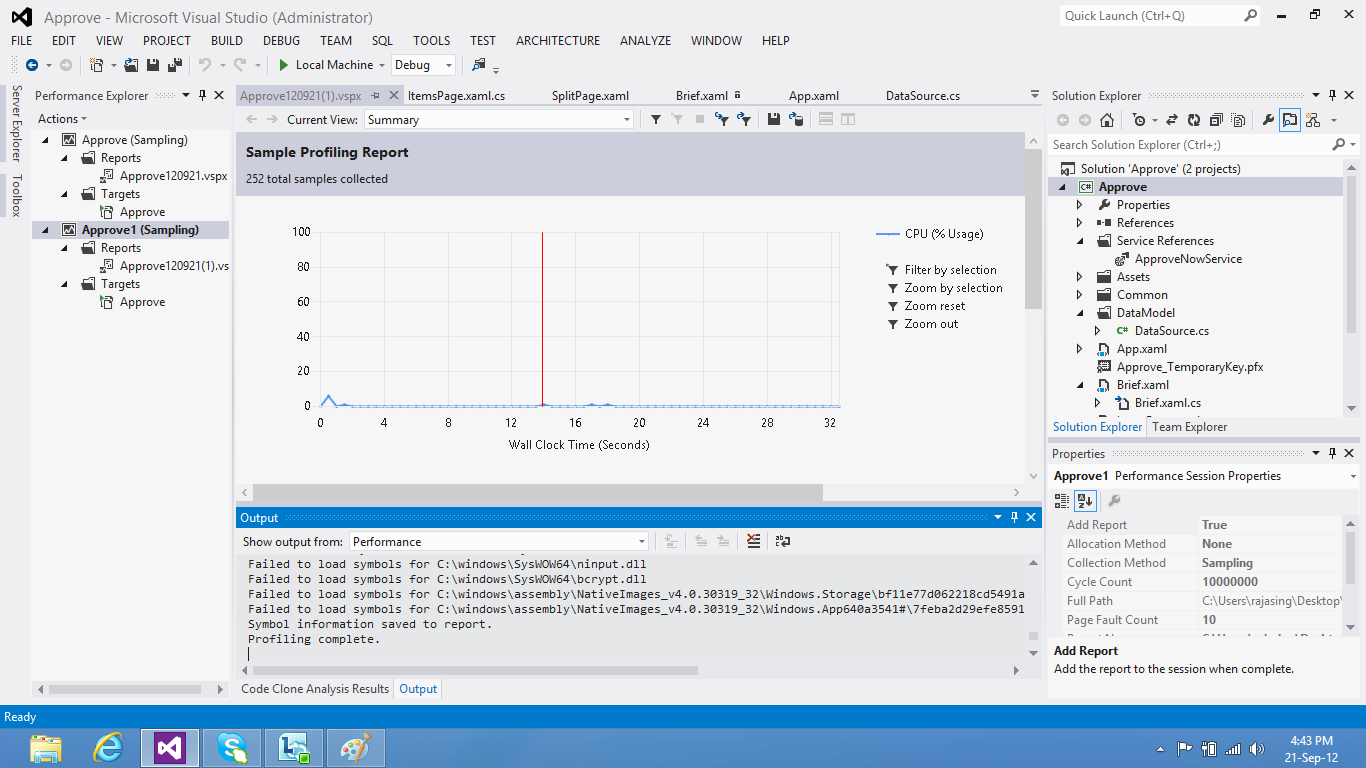
5.Report will be displayed once you stop profiling.
For Remote Devices
Following configuration changes are required to profile a Windows 8 App on Remote Device
1. In Visual Studio, open the project that you want to profile.
2. On the Debug menu, choose Project Properties.
3. Choose Debugging in the Configuration Properties node.
4. From the Debugger to launch list, choose Remote Machine.
5. In the Machine Name row, type the name or IP address of the remote device.
If the remote device is on the same subnet as the Visual Studio computer, or if the device is directly connected to the Visual Studio computer, you can choose the down arrow in the row, choose the <Locate...> item, and then select the device on the Remote Debugger connections dialog box.
6. From the Debugger Type list, choose whether to profile JavaScript or Visual C++, Visual C#, or Visual Basic code in app components:
1. Choose Script only to profile JavaScript.
2. Choose any other value to profile C#/VB/C++ components of the JavaScript app.
Rest of the steps are same as profiling on Local Machine.
Steps for Profiling Win8 App written in Visual C++, Visual C#, or Visual Basic on Local Machine :
1.Select ANALYZE option from Menu Bar. Click on Launch Performance Wizard
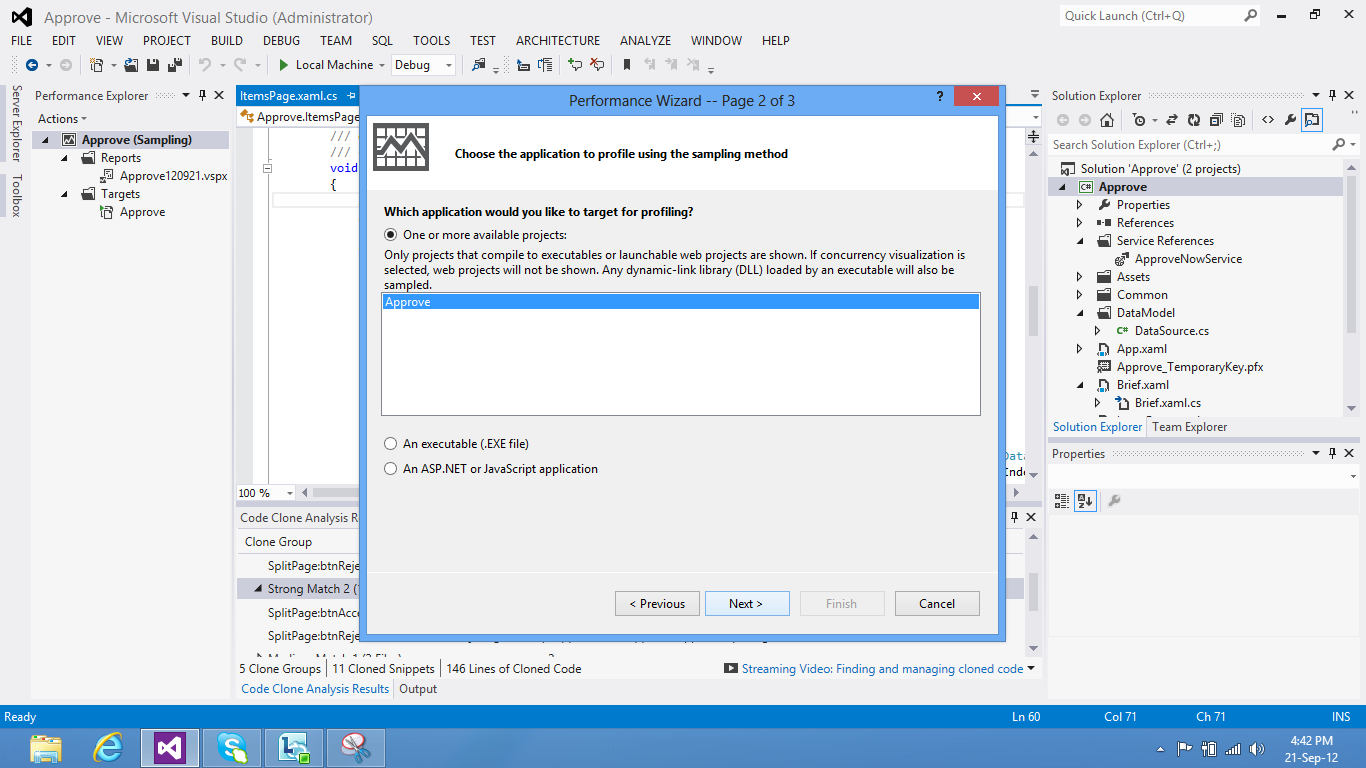
2.Specify the Profiling method you want to use. CPU Sampling option is selected by default (and recommended) when we launch Performance Wizard. Click Next.
3. Choose the module to profile. Project app will be selected by default. Click Next. In the next screen, click Finish. If you don’t want to start profiling immediately, Uncheck “Launch profiling after the Wizard finishes” and click Finish.

4. Application will be launched with profiler. Execute the functionality of app. Use profiler session screen to pause/stop profiling as shown below
5. Report will be displayed once you stop profiling.
For Remote Machine
Following configuration changes are required to profile a Windows 8 App on Remote Device
1. On the Debug menu, choose Project Properties.
2. Choose the Debug menu item.
3. From the Target Device list, choose Remote Machine.
4. In the Remote Machine box, type the name or IP address of the remote device.
If the remote device is on the same subnet as the Visual Studio computer, or if the device is directly connected to the Visual Studio computer, you can choose Find, and then select the device on the Remote Debugger connections dialog box.
Require Authentication should always be set to Yes. Not requiring network authentication puts your network at significant risk of attacks by malicious users.
Rest of the steps are same as profiling on Local Machine.
As compared to normal profiling options and features in VS10, following are not supported when profiling Windows Store apps in VS12:
• Profiling JavaScript apps using the sampling method.
• Profiling managed and native code using the instrumentation method.
• Concurrency profiling
• .NET memory profiling
• Tier interaction profiling (TIP)
• Sampling options, such as setting the sampling event and timing interval, or collecting additional performance counter data.
• Instrumentation options, such as collecting performance and windows counter data, or specifying additional command-line options.