Lab 12: IntelliTraceCollector
This articles has been migrated to its new home here: https://benperk.github.io/msdn/2016/2016-IISLAB-lab-12-intellitracecollector.html
Prerequisites
- Read about the InteliTraceCollector here
- Read about debugging the iTrace in Visual Studio here
- Download the InteliTraceCollector here, view system requirements
- Some PowerShell understanding, perform Lab 8
Setup
- Install and Configure CSharpGuitarBugs on an IIS server as described in Lab 1
- Copy IntelliTraceCollection.exe to the IIS web server and expand into c:\IntelliTraceCollection and install it, as per the instructions in the lab…not now J
- Create C:\IntelliTraceLogFiles directory
Lab 12-1
1. Open PowerShell as Administrator
2. Expand the Cab file by entering the following command
3. Enter ‚Set-ExecutionPolicy Unrestricted‘ if required
4. Enter ‘import-module c:\IntelliTraceCollector\Microsoft.VisualStudio.IntelliTrace.PowerShell.dll’
5. Start-IntelliTraceCollection "<ApplicationPool>" <PathToCollectionPlan> <FullPathToITraceFileDirectory>, TIP: when entering the Path, just enter the first few letter then TAB.
a. Ex: Start-IntelliTraceCollection "WebExceptionApp" "C:\IntelliTraceCollector\collection_plan.ASP.NET.default.xml " "C:\IntelliTraceLogFiles"
6. Open the CSharpGuitarBugs website and click on the “View by 6, 7 or 8 String“ link
7. Enter the following command: Stop-IntelliTraceCollection "<ApplicationPool>". The execution of this commend generates the iTrace file.
8. The iTrace file is created and stored in the C:\IntelliTraceLogFiles directory
9. Double-click on the .iTrace file which opens Visual Studio Ultimate/Enterprise, only available in Ultimate/Enterprise
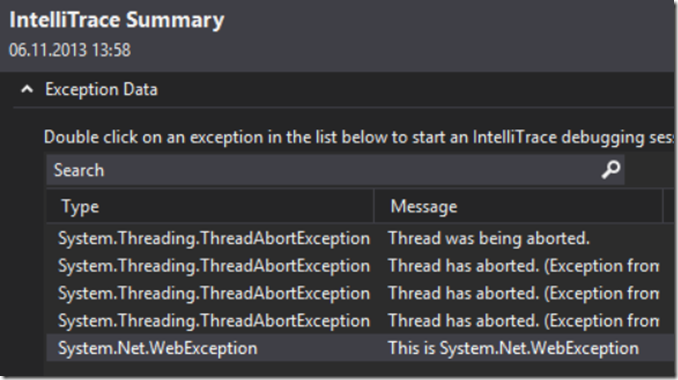
10. There is a summary of Exception Data, you are interested in finding out why the System.Net.Exception was thrown. So double-click on that one.
11. Once the Symbols have been downloaded, the debugger will most likely navigate directly to the line of code which triggered the error…
a. If this is native code or the source code is not visible, copy symbols (.pbd files) into same directory as the iTrace file
12. Click on the InteliTrace tab on the right-hand side of the IDE, same place a Solution Explorer usually is. Navigate up and down the trace to see how the events and method executed leading to the exception and after the exception.


