Using the .NET Compact Framework Remote Performance Monitor to Configure Diagnostic Options
Diagnostic, performance and debugging tools are very cool. The more tools available, the easier it tends to be to find and fix application issues. With Visual Studio 2005, several handy tools were added. I use the Remote Registry Editor and Remote File Viewer just about every day. Version 2 of the .NET Compact Framework added diagnostic logs (enabled via the device registry) to help identify application problems in places where it was very difficult, or not possible to find them with other tools.
One difficulty with using the diagnostic logs is setting the registry options. Modifying the registry can be intimidating and, if done incorrectly, a risky proposition. Readers familiar with my writings on using the diagnostic logs will recall that every time I mention the Remote Registry Editor, I include a warning to use the tool with great care.
A few months ago, Steven posted a tour of the .NET Compact Framework Remote Performance Monitor. He talked about installation, getting connected, publishing the statistics to the Windows Performance Monitor and touched upon what I am going to talk about today.
Did you know that you can use the .NET Compact Framework Remote Performance Monitor to configure diagnostic options on a device?
The other day, I was writing about using the MDbg command line debugger to attach to a .NET Compact Framework application and I needed to enable attach to process support. On my way to the Start menu to run the Remote Registry Editor, I noticed that I had the .NET Compact Framework Remote Performance Monitor running and remembered that it could configure the device registry for me. Having had the experience of incorrectly modifying this very registry flag while presenting at MEDC, I decided to save myself the embarrassment of making the same mistake again.
On the Device menu of the .NET Compact Framework Remote Performance Monitor, select Logging Options.
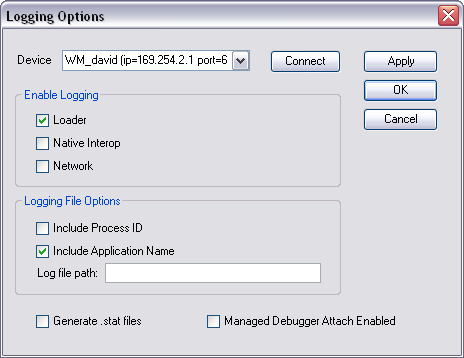
The first step that is required is to connect to your device. The steps to connect here are the same as those Steven describes to connect to the performance statistics. Once connected, you can configure your desired diagnostic settings.
Once connected, you can
- Enable the Loader, Native Interop and Network logs
- Configure log file naming options
- Enable performance statistics (.stat) file creation
- Enable attach to process support in the debugger
Enjoy!
-- DK
Disclaimer(s): This posting is provided "AS IS" with no warranties, and confers no rights.