Microsoft Dynamics GP Business Analyzer: Part 1
Did you know that you have access to a tool that will interactively display Microsoft SQL Server Reporting Services reports containing data from your Microsoft Dynamics GP 2010 reports? Did you know that you can use this tool right now without any additional registration?
If this sounds like something you can get on-board with you should consider using Business Analyzer for Microsoft Dynamics GP 2010. This tool is available in two flavors: one that is tied to the navigation lists inside Microsoft Dynamics GP 2010 and another that is an external client that does not rely on the Microsoft Dynamics GP application.
The internal version of this application is available as soon as you've installed Microsoft Dynamics GP 2010 (R2 or later) and deployed our Microsoft SQL Server Reporting Services reports. No extra installation is necessary. In order to see these reports in action you just need to go to an area page and run one of the select navigation lists we've added this functionality onto. For example, if you go to the Sales area page and click on the Customers navigation list on the left you will see the following:
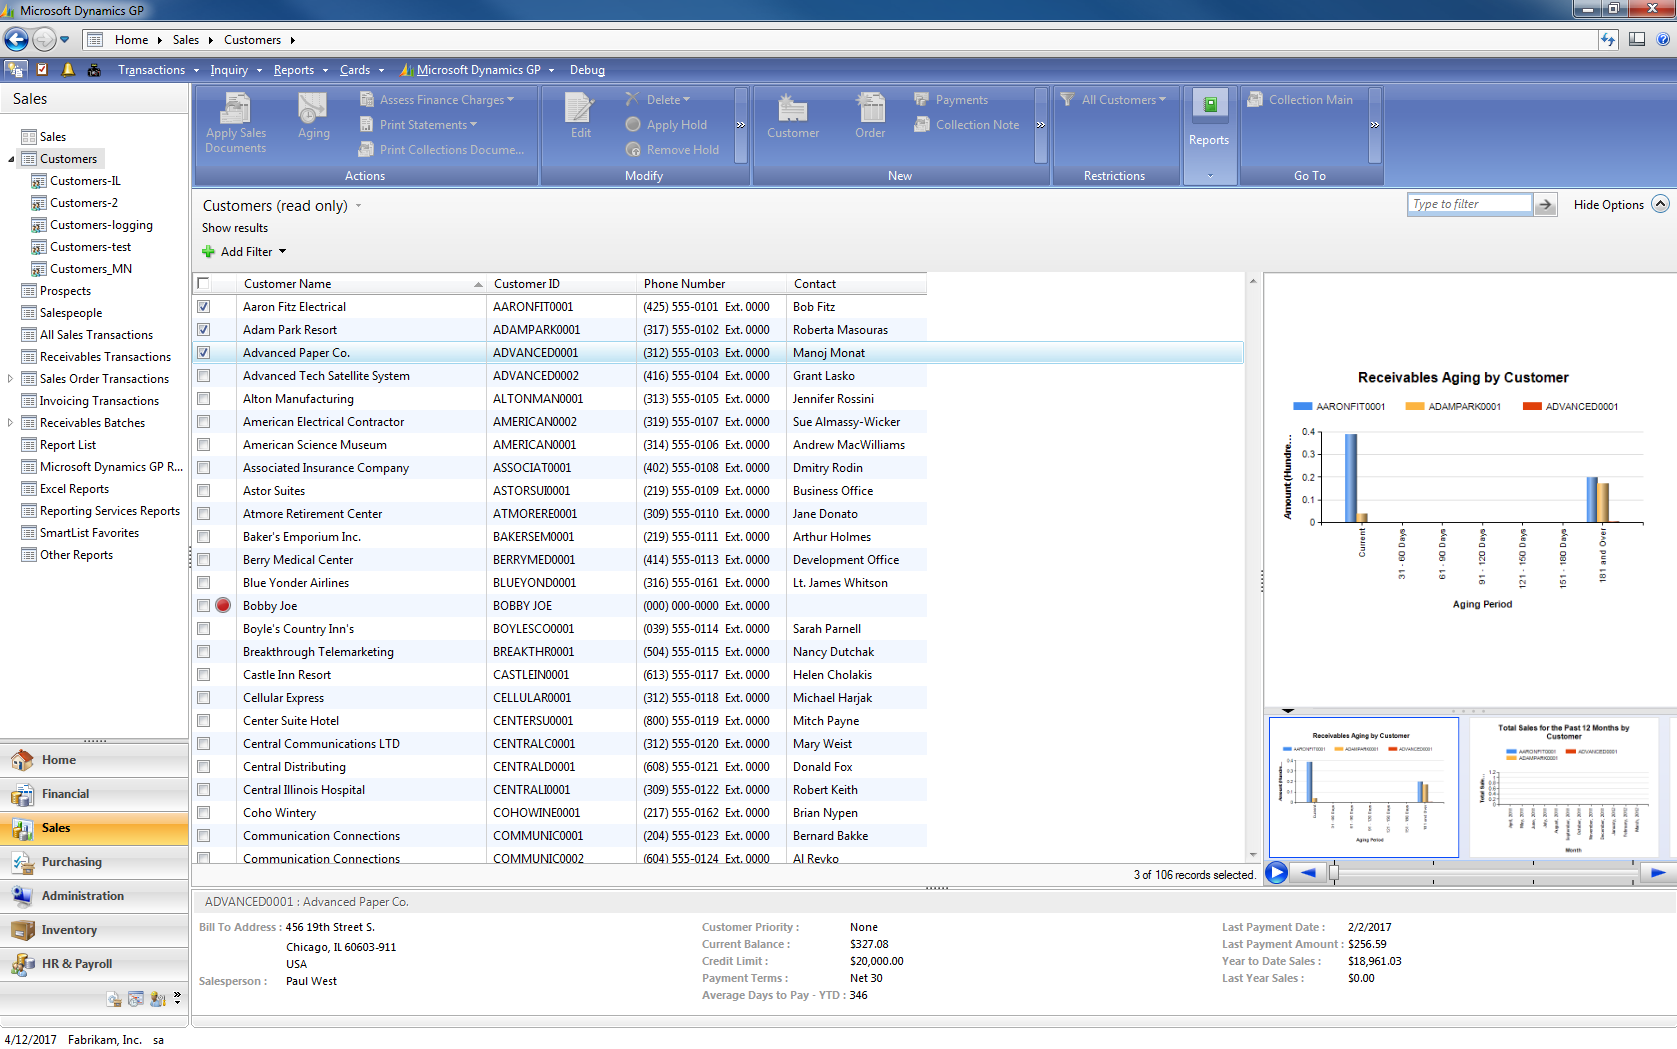
As you mark additional records in the navigation list you can refresh your reports in Business Analyzer to show data for those select customers.
To install the external version of the tool you only need to run Setup.exe on your Microsoft Dynamics GP 2010 media, then choose to install Microsoft Dynamics GP Business Analyzer. The installation will ask for the location of your Microsoft SQL Server Reporting Services reports:
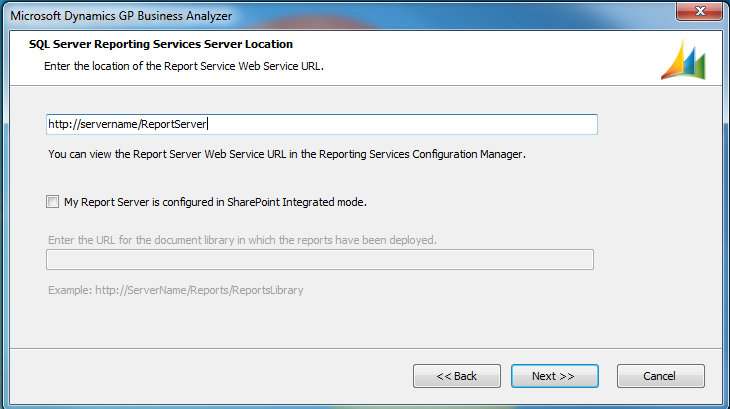
You can find the URLs for your environment by looking in either Reporting Services Configuration Manager or on your SharePoint site, depending on which deployment method you chose for he reports.
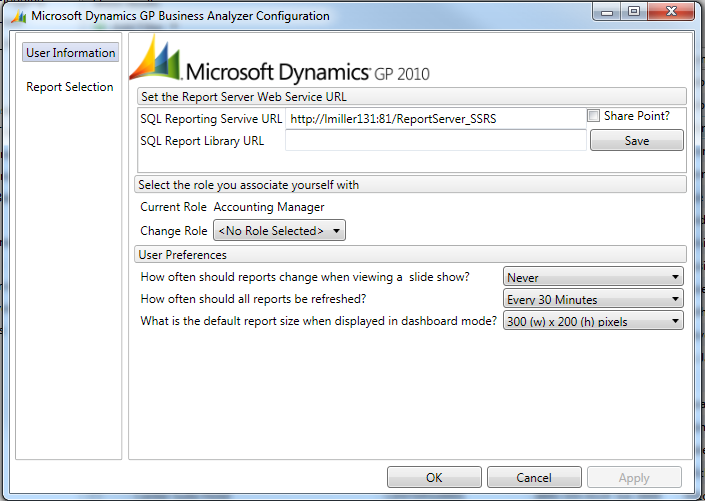
The first time you launch Business Analyzer after the install completes you'll be directed to the configuration window, where you can specify options ranging from what role you associate yourself with to how often the reports should transition through the slideshow to how large the report images display.
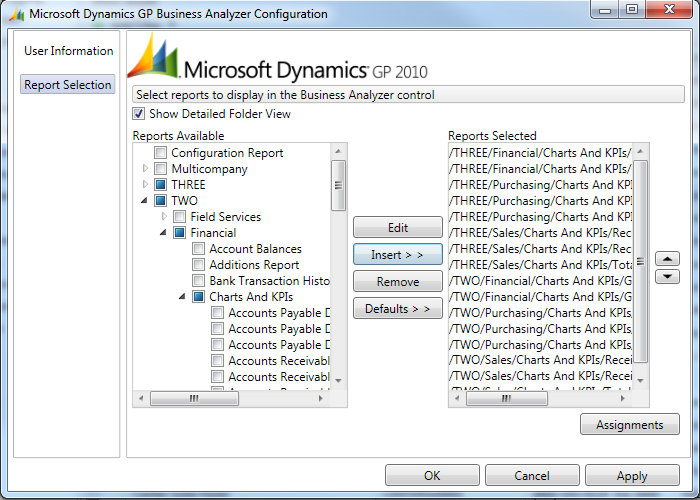
If you click on the Report Selection tab on the left you can choose the default reports that are assigned to the role you've assigned yourself or choose your own set of reports:
You can then click OK to see the reports you've selected in a slideshow format.
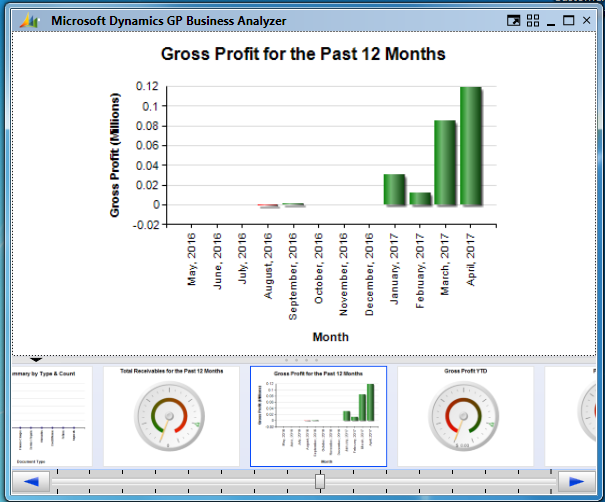
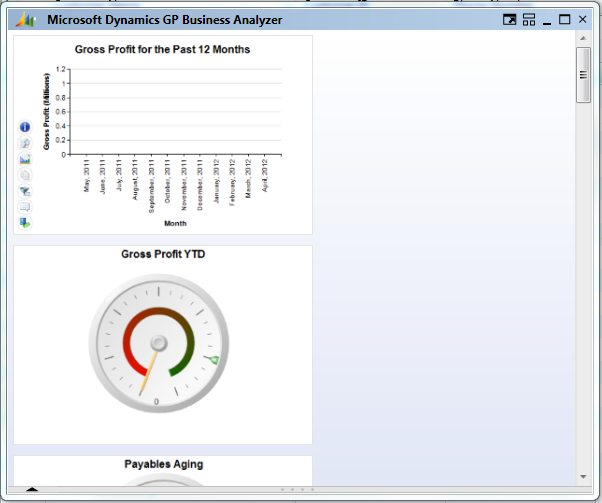
You can use the icons in the upper-right to switch the view: Full Screen Mode or Dashboard/Split Mode. Split mode is shown above while Dashboard mode is below:
As you hover your mouse over each report you'll see a set of seven options you can use to act upon these reports. In order there buttons are:
• Report Information: Provides information on the name of the report and when it was rendered
• View Report: Opens a browser window and opens the report
• Edit Report: Opens the report in Report Builder
• Copy Report Image: Copies an image of the report to the clipboard so you can paste it anywhere
• Change Date: Some reports return date-specific information. This allows you to change the date filter for the report
• Start Communication: If you're using Office Communicator 2007 or later you can associate one of your contacts with a report. You can start a conversation with one of those contacts using this button
• Select Company: Some reports include multi-company data. Use this button to specify which companies are displayed on the report
I hope this introduction to Business Analyzer gets you as excited about this feature as we are. We'll continue talking about Business Analyzer next week, so stay tuned!
Lucas