Tracking Windows Performance Counters by application
1 Introduction
This blog describe a basic console application written in C# to track Performance Counters in Windows.
Counters are used in windows OS to provide information as to how well the operating system or an application, service, or driver is performing. The counter data can help determine system bottlenecks. The operating system, network, and devices provide counter data that an application can consume to provide user with a graphical view of how well the system is performing.
The System.Diagnostics namespace provides classes that allow you to interact with performance counters. The PerformanceCounter Class has different constructors; in our code we use the constructor with the following format:
 public PerformanceCounter(
 string categoryName,
 string counterName,
 string instanceName
  )
where:
- categoryName: it is the name of the performance counter category (performance object) with which this performance counter is associated.
- counterName: The name of the performance counter.
- instanceName: The name of the performance counter category instance, or an empty string (""), if the category contains a single instance.
This constructor initializes the performance counter and associates the instance with an existing counter on the local computer. The values that you pass in for the CategoryName, CounterName, and InstanceName properties must point to an existing performance counter on the local computer.
Below some performance counters to track processor utilization, disk I/O, Memory, and networking
PerformanceCounter("Processor", "% Processor Time", "_Total");
PerformanceCounter("Processor", "% Privileged Time", "_Total");
PerformanceCounter("Processor", "% Interrupt Time", "_Total");
PerformanceCounter("Processor", "% DPC Time", "_Total");
PerformanceCounter("Memory", "Available MBytes", null);
PerformanceCounter("Memory", "Committed Bytes", null);
PerformanceCounter("Memory", "Commit Limit", null);
PerformanceCounter("Memory", "% Committed Bytes In Use", null);
PerformanceCounter("Memory", "Pool Paged Bytes", null);
PerformanceCounter("Memory", "Pool Nonpaged Bytes", null);
PerformanceCounter("Memory", "Cache Bytes", null);
PerformanceCounter("Paging File", "% Usage", "_Total");
PerformanceCounter("PhysicalDisk", "Avg. Disk Queue Length", "_Total");
PerformanceCounter("PhysicalDisk", "Disk Read Bytes/sec", "_Total");
PerformanceCounter("PhysicalDisk", "Disk Write Bytes/sec", "_Total");
PerformanceCounter("PhysicalDisk", "Avg. Disk sec/Read", "_Total");
PerformanceCounter("PhysicalDisk", "Avg. Disk sec/Write", "_Total");
PerformanceCounter("PhysicalDisk", "% Disk Time", "_Total");
PerformanceCounter("Process", "Handle Count", "_Total");
PerformanceCounter("Process", "Thread Count", "_Total");
PerformanceCounter("System", "Context Switches/sec", null);
PerformanceCounter("System", "System Calls/sec", null);
PerformanceCounter("System", "Processor Queue Length", null);
2 Performance counters CategoryName
Here a short description of some performance counters.
2.1 CategoryName: Processor
PerformanceCounter("Processor", "% Processor Time", "_Total");
The Processor\% Processor Time counter determines the percentage of time the processor is busy by measuring the percentage of time the thread of the Idle process is running and then subtracting that from 100 percent. This measurement is the amount of processor utilization
PerformanceCounter("Processor", "% Interrupt Time", "_Total");
The rate, in average number of interrupts in incidents per second, at which the processor received and serviced hardware interrupts. It does not include deferred procedure calls, which are counted separately.
PerformanceCounter("Processor", "% DPC Time", "_Total");
The percentage of time that the processor spent receiving and servicing deferred procedure calls during the sample interval. Deferred procedure calls are interrupts that run at a lower priority than standard interrupts.
PerformanceCounter("Processor", "% Privileged Time", "_Total");
The percentage of non-idle processor time spent in privileged mode. Privileged mode is a processing mode designed for operating system components and hardware-manipulating drivers. It allows direct access to hardware and all memory. The alternative, user mode, is a restricted processing mode designed for applications, environment subsystems, and integral subsystems. The operating system switches application threads to privileged mode to gain access to operating system services. This includes time spent servicing interrupts and deferred procedure calls (DPCs). A high rate of privileged time might be caused by a large number of interrupts generated by a failing device. This counter displays the average busy time as a percentage of the sample time.
2.2 CategoryName: Memory
PerformanceCounter("Memory", "Available MBytes", null);
This measures the amount of physical memory, in megabytes, available for running processes. If this value is less than 5 percent of the total physical RAM, that means there is insufficient memory, and that can increase paging activity.
PerformanceCounter("Memory", "Committed Bytes", null);
it shows the amount of virtual memory, in bytes, that can be committed without having to extend the paging file(s). Committed memory is physical memory which has space reserved on the disk paging files. There can be one or more paging files on each physical drive. If the paging file(s) are expanded, this limit increases accordingly.
PerformanceCounter("Memory", "Commit Limit", null);
it shows the amount of virtual memory, in bytes, that can be committed without having to extend the paging file(s). Committed memory is physical memory which has space reserved on the disk paging files. There can be one or more paging files on each physical drive. If the paging file(s) are expanded, this limit increases accordingly.
PerformanceCounter("Memory", "% Committed Bytes In Use", null);
it shows the ratio of Memory\ Committed Bytes to the Memory\ Commit Limit. Committed memory is physical memory in use for which space has been reserved in the paging file so that it can be written to disk. The commit limit is determined by the size of the paging file. If the paging file is enlarged, the commit limit increases, and the ratio is reduced.
PerformanceCounter("Memory", "Pool Paged Bytes", null);
it shows the size, in bytes, of the paged pool. Memory\ Pool Paged Bytes is calculated differently than Process\ Pool Paged Bytes, so it might not equal Process(_Total )\ Pool Paged Bytes.
PerformanceCounter("Memory", "Pool Nonpaged Bytes", null);
it shows the size, in bytes, of the nonpaged pool. Memory\ Pool Nonpaged Bytes is calculated differently than Process\ Pool Nonpaged Bytes, so it might not equal Process(_Total )\ Pool Nonpaged Bytes.
PerformanceCounter("Memory", "Cache Bytes", null);
it shows the sum of the values of System Cache Resident Bytes, System Driver Resident Bytes, System Code Resident Bytes, and Pool Paged Resident Bytes.
2.3 CateroryName: PhysicalDisk
PerformanceCounter("PhysicalDisk", "Disk Read Bytes/sec", "_Total");
PerformanceCounter("PhysicalDisk", "Disk Write Bytes/sec", "_Total");
it captures the total number of bytes sent to the disk (write) and retrieved from the disk (read) during write or read operations.
PerformanceCounter("PhysicalDisk", "Avg. Disk sec/Read", "_Total");
PerformanceCounter("PhysicalDisk", "Avg. Disk sec/Write", "_Total");
it captures the average time, in seconds, of a read/write of data from/to the disk.
PerformanceCounter("System", "Context Switches/sec", null);
A context switch occurs when the kernel switches the processor from one thread to another—for example, when a thread with a higher priority than the running thread becomes ready. Context switching activity is important for several reasons. A program that monopolizes the processor lowers the rate of context switches because it does not allow much processor time for the other processes' threads. A high rate of context switching means that the processor is being shared repeatedly—for example, by many threads of equal priority. A high context-switch rate often indicates that there are too many threads competing for the processors on the system. The System\Context Switches/sec counter reports systemwide context switches.
2.4 CategoryName: Process
Each process provides the resources needed to execute a program. A process has a virtual address space, executable code, open handles to system objects, a security context, a unique process identifier, environment variables, a priority class, minimum and maximum working set sizes, and at least one thread of execution. Each process is started with a single thread, often called the primary thread, but can create additional threads from any of its threads.
A thread is the entity within a process that can be scheduled for execution. All threads of a process share its virtual address space and system resources. In addition, each thread maintains exception handlers, a scheduling priority, thread local storage, a unique thread identifier, and a set of structures the system will use to save the thread context until it is scheduled. The thread context includes the thread's set of machine registers, the kernel stack, a thread environment block, and a user stack in the address space of the thread's process. Threads can also have their own security context, which can be used for impersonating clients. (for more information see "About Processes and Thread" https://msdn.microsoft.com/en-us/library/windows/desktop/ms681917%28v=vs.85%29.aspx)
PerformanceCounter("Process", "Thread Count", "_Total");
The number of threads created by the process. This counter does not indicate which threads are busy and which are idle. It displays the last observed value, not an average.
PerformanceCounter("Process", "Handle Count", "_Total");
the value reports the number of handles that processes opened for objects they create. Handles are used by programs to identify resources that they must access. The value of this counter tends to rise during a memory leak.
PerformanceCounter("Process", "Thread Count", "_Total");
the value reports over time how many threads the processes create.
2.5 CategoryName: System
PerformanceCounter("System", "Context Switches/sec", null);
A context switch occurs when the kernel switches the processor from one thread to another. A context switch might also occur when a thread with a higher priority than the running thread becomes ready or when a running thread must wait for some reason (such as an I/O operation). The Thread\Context Switches/sec counter value increases when the thread gets or loses the time of the processor.
PerformanceCounter("System", "System Calls/sec", null);
This is the number of system calls being serviced by the CPU per second. By comparing the Processor's Interrupts/sec with the System Calls/sec we can get a picture of how much effort the system requires to respond to attached hardware. On a healthy system, the Interrupts per second should be negligible in comparison to the number of System Calls per second. When the system has to repeatedly call interrupts for service, it's indicative of a hardware failure.
PerformanceCounter("System", "Processor Queue Length", null);
The System\Processor Queue Length counter is a rough indicator of the number of threads each processor is servicing.
3 Structure of the application to track Performance Counters
The basic structure of the application to track a set of PerfomanceCounter() is reported in figure:
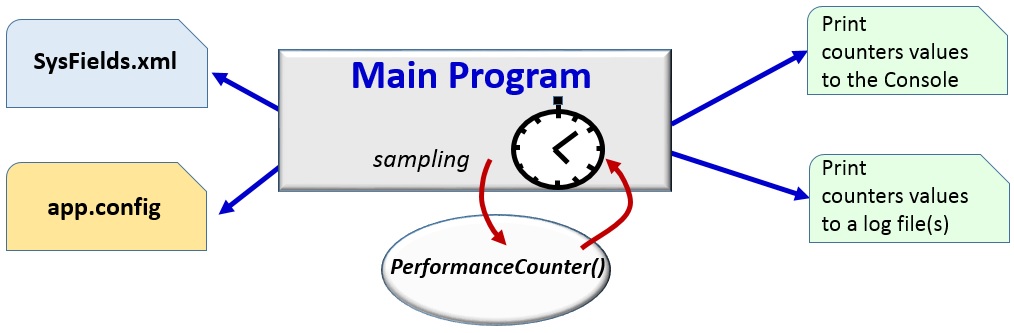
Figure 1: main structure of application
The main purpose of application is catch a specific sample interval a list of Performance Counters.
When the main program starts, the first action is to read two XML files: SysField.XML file and app.config file. Behavior of application depends on parameter values stored in these two files.
Structured of SysField.XML is shown below:
<?xml version="1.0" encoding="utf-8" ?>
<AppValues>
<FolderPath>C:\SysParamsLog2\</FolderPath>
<FileName>Log.txt</FileName>
<WriteToLogFile>true</WriteToLogFile>
<MaxNumberRecordsInLogFile>30</MaxNumberRecordsInLogFile>
<PollingSysParamsInterval>1</PollingSysParamsInterval>
</AppValues>
SysField.XML file specifies all the parameters required to store the PerformanceCounter() values in a log file and the sampling time of performance counters. In particular:
<FolderPath> : it is the folder where the application store the log file
<FileName> : it is the filename fo the log file
<WriteToLogFile> : it is a Boolean value that specify
<MaxNumberRecordsInLogFile> : it is the max number of records stored in a single log file
<PollingSysParamsInterval> : it is the sampling interval of PerformanceCounter()
To generate a log file per day, we need to set the MaxNumberRecordsInLogFile equal to:
MaxNumberRecordsInLogFile =(Second in a day)/ PollingSysParamsInterval
i.e.
if we sample every 1 second (PollingSysParamsInterval =1), MaxNumberRecordsInLogFile =86400secondi/ (1 second)=86400
Using the parameters stored in app.config is possible to define which counters parameters we want to be include in the sampling and the structure of the performance counters (order).
The full structure of app.config is reported below:
<?xml version="1.0"?>
<configuration>
<startup>
<supportedRuntime version="v4.0" sku=".NETFramework,Version=v4.5"/>
</startup>
<appSettings>
<add key="SamplingTime" value="true" />
<add key="NodeName" value="false" />
<add key="CPUProcessorTime" value="true" />
<add key="CPUPrivilegedTime" value="true" />
<add key="CPUInterruptTime" value="true" />
<add key="CPUDPCTime" value="true" />
<add key="MEMAvailable" value="true" />
<add key="MEMCommited" value="true" />
<add key="MEMCommitLimit" value="true" />
<add key="MEMCommitedPerc" value="true" />
<add key="MEMPoolPaged" value="true" />
<add key="MEMPoolNonPaged" value="true" />
<add key="MEMCached" value="true" />
<add key="PageFile" value="true" />
<add key="ProcessorQueueLengh" value="true" />
<add key="DISCQueueLengh" value="true" />
<add key="DISKRead" value="true" />
<add key="DISKWrite" value="true" />
<add key="DISKAverageTimeRead" value="true" />
<add key="DISKAverageTimeWrite" value="true" />
<add key="DISKTime" value="true" />
<add key="HANDLECountCounter" value="true" />
<add key="THREADCount" value="true" />
<add key="CONTENTSwitches" value="true" />
<add key="SYSTEMCalls" value="true" />
<add key="NumProcess" value="true" />
<add key="NetTrafficSend" value="true" />
<add key="NetTrafficReceive" value="true" />
</appSettings>
</configuration>
The meaning of key value is self-explanatory, and the value associated to every key is boolean:
- the value equal to “true” means that value of the performance counter is tracked
- the value equal to “false” means that value of the performance counter can be skipped
When you compile your application, Visual Studio will automatically create a file called <your application name>.exe.config in your bin\debug folder. The contents of the app.config will be automatically copied to this new config file when you compile the application. When you deliver the application to the end user, you have to deliver the exe and this new config file called <your application name>.exe.config and NOT the app.config. Users can modify the data in <your application name>.exe.config file and application will read the data from the config file, when restarted. Change the order of (key,value) in app.config determines a different order of performance counter print out to the console and in log file.
The project use a public class named SysParams to store all the Performance counters.
public class SysParams
{
public string NodeName { get; set; }
public float CPUProcessorTime { get; set; }
public float CPUPrivilegedTime { get; set; }
public float CPUInterruptTime { get; set; }
public float CPUDPCTime { get; set; }
public float MEMAvailable { get; set; }
public float MEMCommited { get; set; }
public float MEMCommitLimit { get; set; }
public float MEMCommitedPerc { get; set; }
public float MEMPoolPaged { get; set; }
publicfloat MEMPoolNonPaged { get; set; }
public float MEMCached { get; set; }
public float PageFile { get; set; }
public float ProcessorQueueLengh { get; set; }
public float DISCQueueLengh { get; set; }
public float DISKRead {get; set;}
public float DISKWrite { get; set; }
public float DISKAverageTimeRead { get; set; }
public float DISKAverageTimeWrite { get; set; }
public float DISKTime { get; set; }
public float HANDLECountCounter { get; set; }
public float THREADCount { get; set; }
public int CONTENTSwitches { get; set; }
public int SYSTEMCalls { get; set; }
public float NetTrafficSend { get; set; }
public float NetTrafficReceive { get; set; }
public DateTime SamplingTime { get; set; }
private PerformanceCounter cpuProcessorTime = new PerformanceCounter("Processor", "% Processor Time", "_Total");
private PerformanceCounter cpuPrivilegedTime = new PerformanceCounter("Processor", "% Privileged Time", "_Total");
private PerformanceCounter cpuInterruptTime = new PerformanceCounter("Processor", "% Interrupt Time", "_Total");
private PerformanceCounter cpuDPCTime = new PerformanceCounter("Processor", "% DPC Time", "_Total");
private PerformanceCounter memAvailable = new PerformanceCounter("Memory", "Available MBytes", null);
private PerformanceCounter memCommited = new PerformanceCounter("Memory", "Committed Bytes", null);
private PerformanceCounter memCommitLimit = new PerformanceCounter("Memory", "Commit Limit", null);
private PerformanceCounter memCommitedPerc = new PerformanceCounter("Memory", "% Committed Bytes In Use", null);
private PerformanceCounter memPollPaged = new PerformanceCounter("Memory", "Pool Paged Bytes", null);
private PerformanceCounter memPollNonPaged = new PerformanceCounter("Memory", "Pool Nonpaged Bytes", null);
private PerformanceCounter memCached = new PerformanceCounter("Memory", "Cache Bytes", null);
private PerformanceCounter pageFile = new PerformanceCounter("Paging File", "% Usage", "_Total");
private PerformanceCounter processorQueueLengh = new PerformanceCounter("System", "Processor Queue Length", null);
private PerformanceCounter diskQueueLengh = new PerformanceCounter("PhysicalDisk", "Avg. Disk Queue Length", "_Total");
private PerformanceCounter diskRead = new PerformanceCounter("PhysicalDisk", "Disk Read Bytes/sec", "_Total");
private PerformanceCounter diskWrite = new PerformanceCounter("PhysicalDisk", "Disk Write Bytes/sec", "_Total");
private PerformanceCounter diskAverageTimeRead = new PerformanceCounter("PhysicalDisk", "Avg. Disk sec/Read", "_Total");
private PerformanceCounter diskAverageTimeWrite = new PerformanceCounter("PhysicalDisk", "Avg. Disk sec/Write", "_Total");
private PerformanceCounter diskTime = new PerformanceCounter("PhysicalDisk", "% Disk Time", "_Total");
private PerformanceCounter handleCountCounter = new PerformanceCounter("Process", "Handle Count", "_Total");
private PerformanceCounter threadCount = new PerformanceCounter("Process", "Thread Count", "_Total");
private PerformanceCounter contentSwitches = new PerformanceCounter("System", "Context Switches/sec", null);
private PerformanceCounter systemCalls = new PerformanceCounter("System", "System Calls/sec", null);
private PerformanceCounterCategory performanceNetCounterCategory;
private PerformanceCounter[] trafficSentCounters;
private PerformanceCounter[] trafficReceivedCounters;
private string[] interfaces = null;
public void initNetCounters()
{
// PerformanceCounter(CategoryName,CounterName,InstanceName)
performanceNetCounterCategory = newPerformanceCounterCategory("Network Interface");
interfaces = performanceNetCounterCategory.GetInstanceNames();
int length = interfaces.Length;
if (length > 0)
{
trafficSentCounters = newPerformanceCounter[length];
trafficReceivedCounters = newPerformanceCounter[length];
}
for (int i = 0; i < length; i++)
{
// Initializes a new, read-only instance of the PerformanceCounter class.
// 1st paramenter: "categoryName"-The name of the performance counter category (performance object) with which this performance counter is associated.
// 2nd paramenter: "CounterName" -The name of the performance counter.
// 3rd paramenter: "instanceName" -The name of the performance counter category instance, or an empty string (""), if the category contains a single instance.
trafficReceivedCounters[i] = new PerformanceCounter("Network Interface", "Bytes Sent/sec", interfaces[i]);
trafficSentCounters[i] =new PerformanceCounter("Network Interface", "Bytes Sent/sec", interfaces[i]);
}
// List of all names of the network interfaces
for (int i = 0; i < length; i++)
{
Console.WriteLine("Name netInterface: {0}", performanceNetCounterCategory.GetInstanceNames()[i]);
}
}
public void getProcessorCpuTime()
{
float tmp = cpuProcessorTime.NextValue();
CPUProcessorTime = (float)(Math.Round((double)tmp, 1));
// Environment.ProcessorCount: return the total number of cores
}
public void getCpuPrivilegedTime()
{
float tmp = cpuPrivilegedTime.NextValue();
CPUPrivilegedTime = (float)(Math.Round((double)tmp, 1));
}
public void getCpuinterruptTime()
{
float tmp = cpuInterruptTime.NextValue();
CPUInterruptTime = (float)(Math.Round((double)tmp, 1));
}
public void getcpuDPCTime()
{
float tmp = cpuDPCTime.NextValue();
CPUDPCTime = (float)(Math.Round((double)tmp, 1));
}
public void getPageFile()
{
PageFile = pageFile.NextValue();
}
public void getProcessorQueueLengh()
{
ProcessorQueueLengh = processorQueueLengh.NextValue();
}
public void getMemAvailable()
{
MEMAvailable = memAvailable.NextValue();
}
public void getMemCommited()
{
MEMCommited = memCommited.NextValue() / (1024 * 1024);
}
public void getMemCommitLimit()
{
MEMCommitLimit = memCommitLimit.NextValue() / (1024 * 1024);
}
public void getMemCommitedPerc()
{
float tmp = memCommitedPerc.NextValue();
// return the value of Memory Commit Limit
MEMCommitedPerc = (float)(Math.Round((double)tmp, 1));
}
public void getMemPoolPaged()
{
float tmp = memPollPaged.NextValue() / (1024 * 1024);
MEMPoolPaged = (float)(Math.Round((double)tmp, 1));
}
public void getMemPoolNonPaged()
{
float tmp = memPollNonPaged.NextValue() / (1024 * 1024);
MEMPoolNonPaged = (float)(Math.Round((double)tmp, 1));
}
public void getMemCachedBytes()
{
// return the value of Memory Cached in MBytes
MEMCached = memCached.NextValue() / (1024 * 1024);
}
public void getDiskQueueLengh()
{
DISCQueueLengh = diskQueueLengh.NextValue();
}
public void getDiskRead()
{
float tmp=diskRead.NextValue()/1024;
DISKRead = (float)(Math.Round((double)tmp,1));
}
public void getDiskWrite()
{
float tmp=diskWrite.NextValue()/1024;
DISKWrite = (float)(Math.Round((double)tmp,1)); // round 1 digit decimal
}
public void getDiskAverageTimeRead()
{
float tmp = diskAverageTimeRead.NextValue() * 1000;
DISKAverageTimeRead = (float)(Math.Round((double)tmp, 1)); // round 1 digit decimal
}
public void getDiskAverageTimeWrite()
{
float tmp = diskAverageTimeWrite.NextValue()*1000;
DISKAverageTimeWrite = (float)(Math.Round((double)tmp, 1)); // round 1 digit decimal
}
public void getDiskTime()
{
float tmp = diskTime.NextValue();
DISKTime = (float)(Math.Round((double)tmp, 1));
}
public void getHandleCountCounter()
{
HANDLECountCounter = handleCountCounter.NextValue();
}
public void getThreadCount()
{
THREADCount = threadCount.NextValue();
}
public void getContentSwitches()
{
CONTENTSwitches = (int)Math.Ceiling(contentSwitches.NextValue());
}
public void getsystemCalls()
{
SYSTEMCalls = (int)Math.Ceiling(systemCalls.NextValue());
}
public void getCurretTrafficSent()
{
int length = interfaces.Length;
float sendSum = 0.0F;
for (int i = 0; i < length; i++)
{
sendSum += trafficSentCounters[i].NextValue();
}
float tmp = 8 * (sendSum / 1024);
NetTrafficSend = (float)(Math.Round((double)tmp, 1));
}
public void getCurretTrafficReceived()
{
int length = interfaces.Length;
float receiveSum = 0.0F;
for (int i = 0; i < length; i++)
{
receiveSum += trafficReceivedCounters[i].NextValue();
}
float tmp = 8 * (receiveSum / 1024);
NetTrafficReceive = (float)(Math.Round((double)tmp, 1));
}
public void getSampleTime()
{
SamplingTime =DateTime.Now;
}
}
A description of program workflow is reported in figure 2 and figure 3
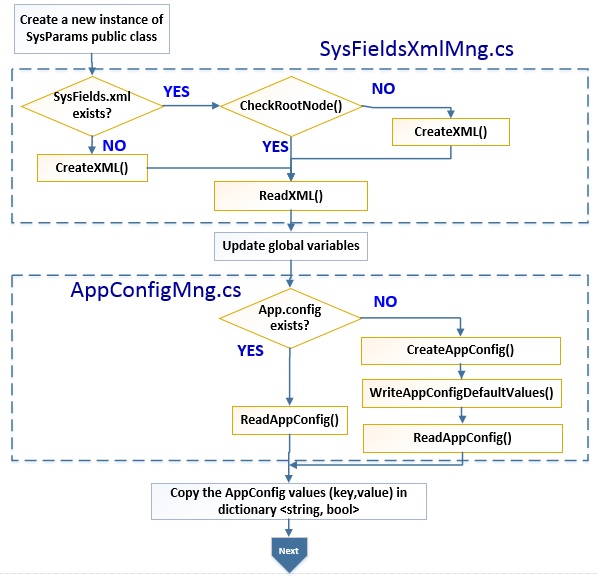
Figure 2: program workflow
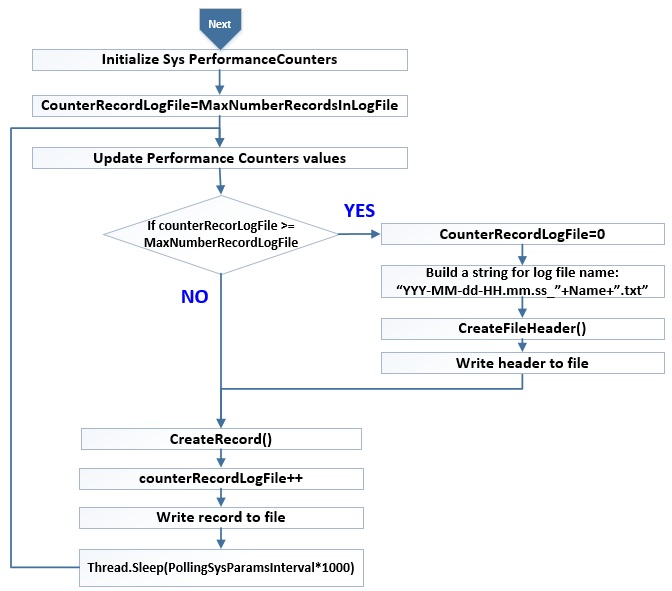
Figure 3: program workflow
You can run the program on your Window 8 laptop or Azure IaaS VM with Windows 2012 R2 (you do not need to install any further package, transfer the list of files under the binary folder and run it).
Here how look like a typical output:
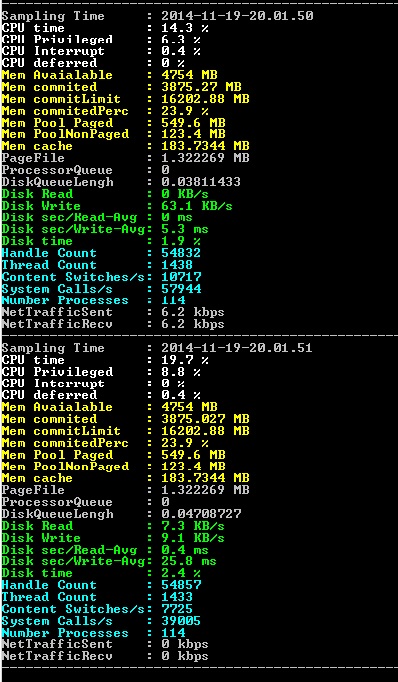
Figure 4: Performance counters parameters on the console
Program has small CPU impact; on Azure IaaS VM –A1 (basic tier) with Windows 2012 R2 the CPU consumption is between 1% and 5% as shown in figure 4 and figure 5.
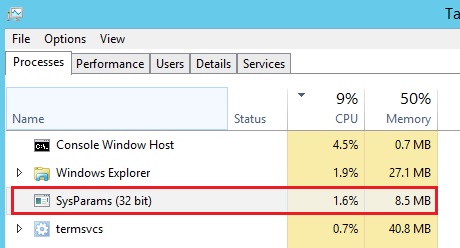
Figure 5: CPU consumption of program
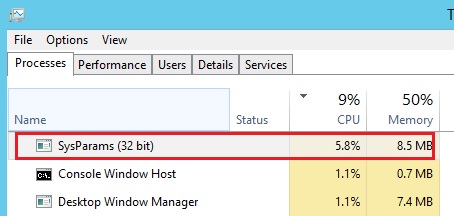
Figure 6: CPU consumption of program
To control the record format stored in log file we can change the content in app.config file
3.1 Tracking CPU and Network performance counters only
To monitor the CPU and network traffic counters is enough to change the app.config file structure:
<?xml version="1.0"?>
<configuration>
<startup>
<supportedRuntime version="v4.0" sku=".NETFramework,Version=v4.5"/>
</startup>
<appSettings>
<add key="SamplingTime" value="true" />
<add key="NodeName" value="false" />
<add key="CPUProcessorTime" value="true" />
<add key="CPUPrivilegedTime" value="true" />
<add key="CPUInterruptTime" value="true" />
<add key="CPUDPCTime" value="true" />
<add key="MEMAvailable" value="false" />
<add key="MEMCommited" value="false" />
<add key="MEMCommitLimit" value="false" />
<add key="MEMCommitedPerc" value="false" />
<add key="MEMPoolPaged" value="false" />
<add key="MEMPoolNonPaged" value="false" />
<add key="MEMCached" value="false" />
<add key="PageFile" value="false" />
<add key="ProcessorQueueLengh" value="false" />
<add key="DISCQueueLengh" value="false" />
<add key="DISKRead" value="false" />
<add key="DISKWrite" value="false" />
<add key="DISKAverageTimeRead" value="false" />
<add key="DISKAverageTimeWrite" value="false" />
<add key="DISKTime" value="false" />
<add key="HANDLECountCounter" value="false" />
<add key="THREADCount" value="false" />
<add key="CONTENTSwitches" value="false" />
<add key="SYSTEMCalls" value="false" />
<add key="NumProcess" value="false" />
<add key="NetTrafficSend" value="true" />
<add key="NetTrafficReceive" value="true" />
</appSettings>
</configuration>
or differently we can cut out all the pairs (key, value) that we do not want to track:
<?xml version="1.0"?>
<configuration>
<startup>
<supportedRuntime version="v4.0" sku=".NETFramework,Version=v4.5"/>
</startup>
<appSettings>
<add key="SamplingTime" value="true" />
<add key="NodeName" value="false" />
<add key="CPUProcessorTime" value="true" />
<add key="CPUPrivilegedTime" value="true" />
<add key="CPUInterruptTime" value="true" />
<add key="CPUDPCTime" value="true" />
<add key="NetTrafficSend" value="true" />
<add key="NetTrafficReceive" value="true" />
</appSettings>
</configuration>
we get a log file look like:
Sampling Time |
CPU time % |
CPU Privileged % |
CPU Interrupt % |
CPU deferred % |
NetTrafficSent (kbps) |
NetTrafficRecv (kbps) |
2014-11-20-18.35.28 |
0 |
0 |
0 |
0 |
0 |
0 |
2014-11-20-18.35.29 |
20 |
5 |
0 |
0 |
26.5 |
27.1 |
2014-11-20-18.35.30 |
10.4 |
1.5 |
0 |
0 |
41.7 |
69.5 |
2014-11-20-18.35.31 |
2.7 |
1.5 |
0 |
0 |
72.3 |
43.3 |
2014-11-20-18.35.32 |
4.5 |
3 |
0 |
0 |
34.6 |
34.7 |
2014-11-20-18.35.33 |
36 |
11.9 |
0 |
0 |
424.1 |
424.3 |
2014-11-20-18.35.34 |
1.7 |
3 |
0 |
0 |
219 |
218.2 |
2014-11-20-18.35.35 |
19.5 |
11.9 |
0 |
1.5 |
48.5 |
48.5 |
2014-11-20-18.35.36 |
21.8 |
15 |
0 |
1.5 |
43.2 |
43.4 |
2014-11-20-18.35.37 |
0.7 |
1.5 |
0 |
0 |
21.7 |
23.5 |
2014-11-20-18.35.38 |
11.8 |
7.3 |
0 |
0 |
31.1 |
29.5 |
2014-11-20-18.35.39 |
4.7 |
3 |
0 |
0 |
22.8 |
22.7 |
2014-11-20-18.35.40 |
1.6 |
1.5 |
0 |
0 |
15.3 |
15.3 |
2014-11-20-18.35.41 |
5.2 |
3 |
0 |
0 |
29 |
28.9 |
2014-11-20-18.35.42 |
2.2 |
1.5 |
0 |
0 |
28.4 |
28.5 |
2014-11-20-18.35.43 |
6.6 |
4.5 |
0 |
0 |
27.5 |
27.3 |
2014-11-20-18.35.44 |
6.3 |
3 |
0 |
0 |
23.9 |
24 |
2014-11-20-18.35.45 |
7.6 |
3 |
0 |
0 |
25.7 |
25.8 |
2014-11-20-18.35.46 |
1.1 |
0 |
0 |
0 |
22.4 |
22.3 |
2014-11-20-18.35.48 |
5.6 |
2.9 |
0 |
0 |
20.9 |
20.9 |
To change the sequence of performance counters in the log file is enough to change the order in app.config
<?xml version="1.0"?>
<configuration>
<startup>
<supportedRuntime version="v4.0" sku=".NETFramework,Version=v4.5"/>
</startup>
<appSettings>
<add key="SamplingTime" value="true" />
<add key="NodeName" value="false" />
<add key="NetTrafficSend" value="true" />
<add key="NetTrafficReceive" value="true" />
<add key="CPUProcessorTime" value="true" />
<add key="CPUPrivilegedTime" value="true" />
<add key="CPUInterruptTime" value="true" />
<add key="CPUDPCTime" value="true" />
</appSettings>
</configuration>
To reset the default parameters of app.config you can delete the file or set the content to:
<?xml version="1.0"?>
<configuration>
<startup>
<supportedRuntime version="v4.0" sku=".NETFramework,Version=v4.5"/>
</startup>
<appSettings>
</appSettings>
</configuration>
4 Azure Files to store performance counter log of multiple Azure Windows VM
If we want to Tracking Performance Counters on single Azure Windows VM, it is enough to copy the binary in the Azure windows VM and run it.
Azure Files is a great feature that exposes file shares using the standard SMB 2.1 protocol. As pointed out from the Azure storage product team an Azure File share can also be used to save diagnostic files like logs, metrics, and crash dumps. Multiple Azure VMs can mount the same file share an write the log file in different folders.
The diagram in Figure 7 shows how to use Azure File as repository of Performance counters log files generated from different Azure VMs.
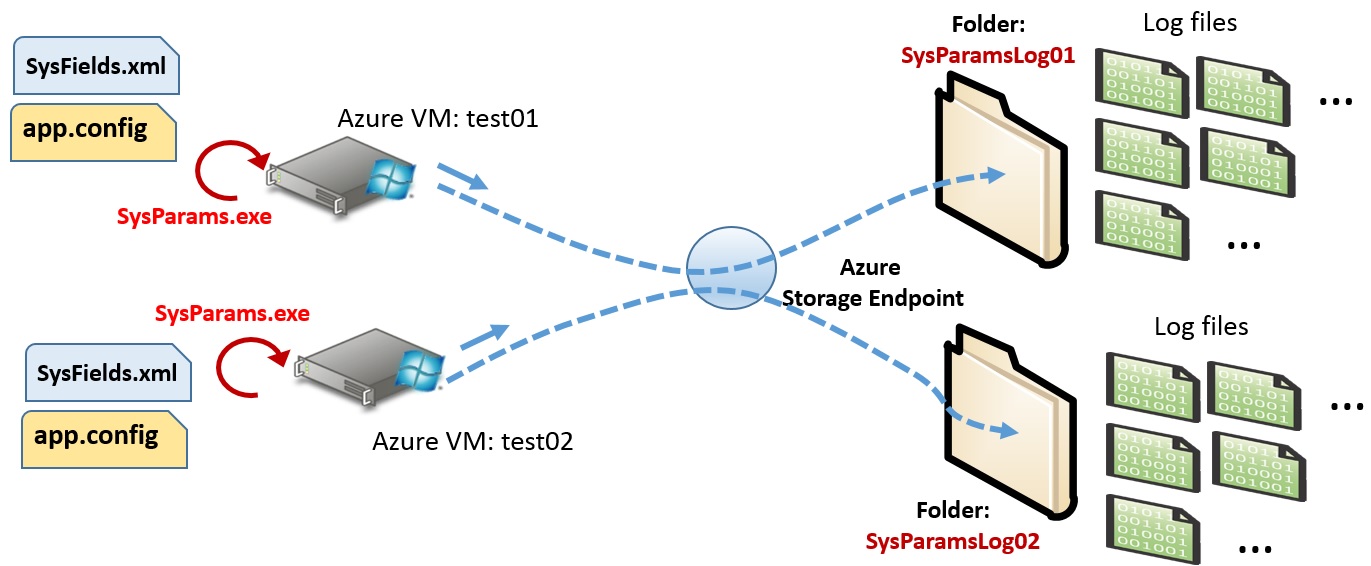
Figure 7: store Performance Counters log files in Azure File
Azure Files can be defined through Azure powershell with simple basic command:
Import-Module Azure
Select-AzureSubscription –SubscriptionName [[SubscriptionName]]
Get-AzureSubscription –current
New-AzureStorageAccount -StorageAccountName [[AzureStorageAccountName]] -Label [[AzureStorageAccountName]] -Location "North Europe"
# To find out the version of the module you're using
(get-module azure).version
$ctx=New-AzureStorageContext [[AzureStorageAccountName]] [[AzureStorageAccountKey]]
$ctx = New-AzureStorageContext -StorageAccountName [[AzureStorageAccountName]] -StorageAccountKey [[AzureStorageAccountKey]]
# create a new share
$s = New-AzureStorageShare [[shareName]] -Context $ctx
In our case we define a share name equal to “logshare1”:
$s = New-AzureStorageShare logshare1 -Context $ctx
To mount the shared folder in the Azure Windows VM we can use the command in both azure Windows VMs:
net use z: \\ [[AzureStorageAccountName]]. file.core.windows.net\logshare1 /u: [[AzureStorageAccountName]] [[AzureStorageAccountKey]]
This command mount the shared folder “logshare1” of Azure Storage account as driver Z:
To store the log files in different folder we can change the value <FolderPath> in SysField.XML file
Content of SysField.XML file in test01 Azure VM:
<?xml version="1.0" encoding="utf-8" ?>
<AppValues>
<FolderPath>Z:\SysParamsLog1\</FolderPath>
<FileName>fftest01.txt</FileName>
<WriteToLogFile>true</WriteToLogFile>
<MaxNumberRecordsInLogFile>20</MaxNumberRecordsInLogFile>
<PollingSysParamsInterval>1</PollingSysParamsInterval>
</AppValues>
Content of SysField.XML file in test02 Azure VM:
<?xml version="1.0" encoding="utf-8" ?>
<AppValues>
<FolderPath>Z:\SysParamsLog2\</FolderPath>
<FileName>fftest02.txt</FileName>
<WriteToLogFile>true</WriteToLogFile>
<MaxNumberRecordsInLogFile>20</MaxNumberRecordsInLogFile>
<PollingSysParamsInterval>1</PollingSysParamsInterval>
</AppValues>
You can download the SysParams project here:
 SysParams.zip
5 Reference
PhysicalDisk Object: https://msdn.microsoft.com/en-us/library/ms804035.aspx
Monitoring Threads: https://technet.microsoft.com/en-us/library/cc776966(v=ws.10).aspx
Memory Object: https://msdn.microsoft.com/en-us/library/ms804008.aspx