Using Power BI to Visualize Sensor Data from Windows 10 IoT Core
Gathering data from devices is an important part of any IoT solution. Visualizing that data allows us to gain insights into the health of the devices and how they interact with the environment.
In this post, we will look at using Power BI REST APIs to securely stream data from a headless Windows 10 IoT Core device, using the new Azure Active Directory authentication protocol for headless devices. To demonstrate the capabilities of Power BI and Azure Active Directory, we're going to build a weather station application.
Introduction
Building a weather station is the rite of passage for beginning IoT enthusiasts. It's easy to put together from inexpensive components and provides immediate gratification. For example, you can blow air on your sensor and watch the temperature graph spike up or down. You can leave the weather station in your home and monitor humidity and temperature remotely. The list goes on.
At the same time, the project presents some unique challenges. How do you send the data from your device to the cloud? How do you visualize it in interesting ways? Finally -- how do you make sure you're looking at your data? In other words, how do you reliably authenticate your device?
Authenticating a Headless Device
In a typical OAuth 2.0 authorization flow, the user is presented with a browser window where they can enter their credentials. The application then obtains an access token that is used to communicate with the desired cloud service. Alas, this approach is not suitable for headless IoT devices without the mouse and keyboard attached, or devices that only offer console I/O.
This problem is solved with the latest version of the Active Directory Authentication Library (still in preview) that introduces a new authentication flow tailored for headless devices. The approach goes like this: when a user authentication is required, instead of bringing up a browser window, the app asks the user to use another device to navigate to https://aka.ms/devicelogin and enter a specific code. Once the code is provided, the web page will lead the user through a normal authentication experience, including consent prompts and multi factor authentication if necessary. Upon successful authentication, the app will receive the required access tokens through a back channel and use it to access the desired cloud service.
Hardware Setup
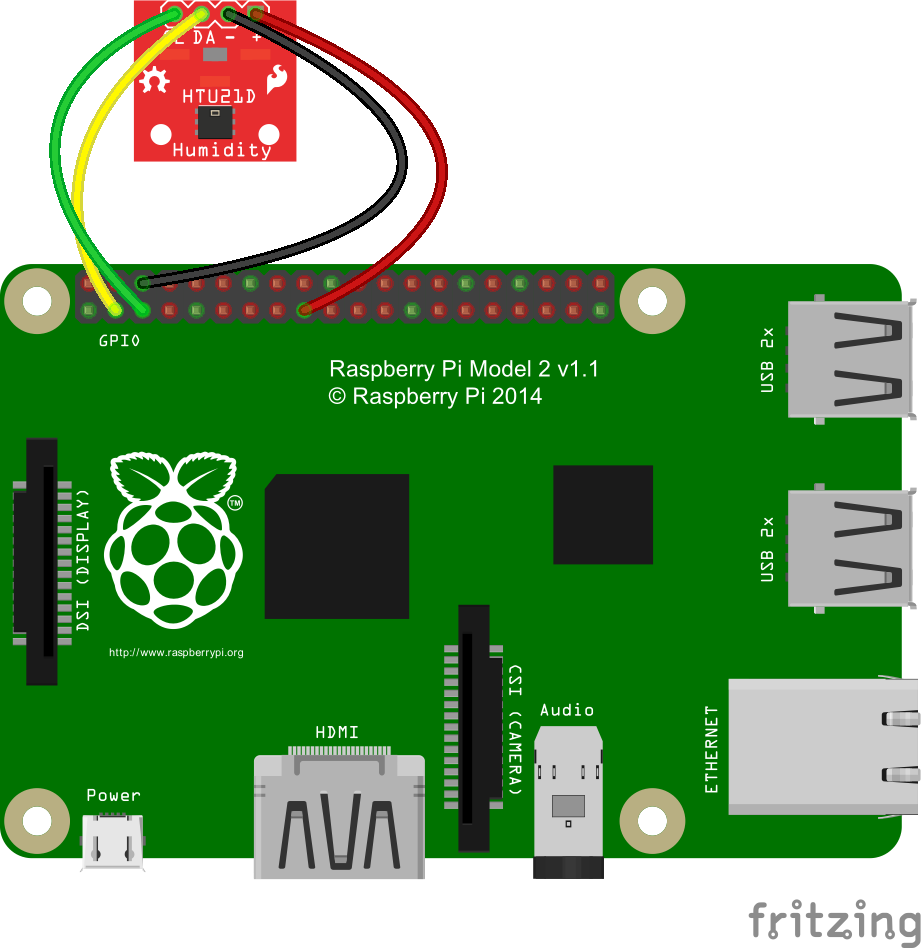
For this example, we will use a humidity and temperature sensor, such as the HTU21D, which is available from a number of vendors (e.g., Sparkfun, Amazon).
The sensor connects to your device via I²C bus, as shown on the following wiring diagram (the location of the pins might be slightly different if you're using a device other than Raspberry Pi 2):
Software Setup
The software setup will require several steps. First, we'll need to register an application in the Azure Active Directory. Then, we'll copy the client ID from the application and use it in our UWP app running on the device. Finally, we'll create a dashboard in Power BI to visualize data coming from our device.
Registering an Application in Azure
This step assumes that your organization already has an Azure Active Directory set up. If not, you can get started here.
You can register your application from the Azure Portal, however it's easier to do it from the dedicated Power BI application registration page: https://dev.powerbi.com/apps.
Navigate to the above page, log in with your Power BI credentials and fill out the information about your app:
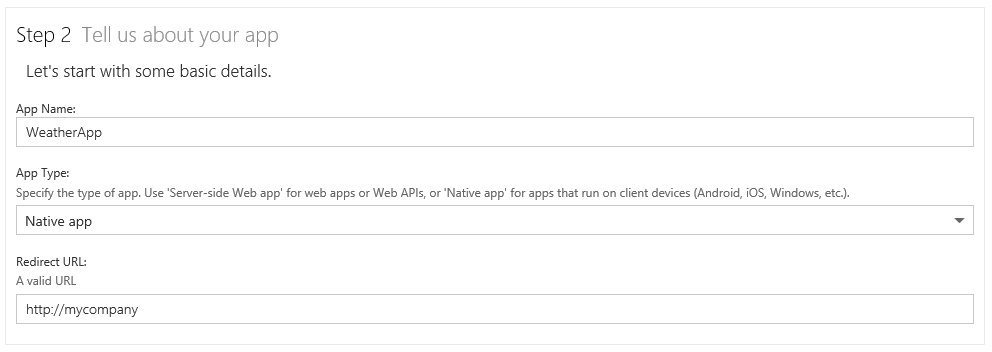
Note that I used a dummy URL for the redirect -- our app will not need this information but we cannot leave this field empty.
In the next step, enable the "Read All Datasets" and "Read and Write All Datasets" APIs and click "Register App".
Once this is done, click "Register App". The web page will generate the Client ID, which looks like this:
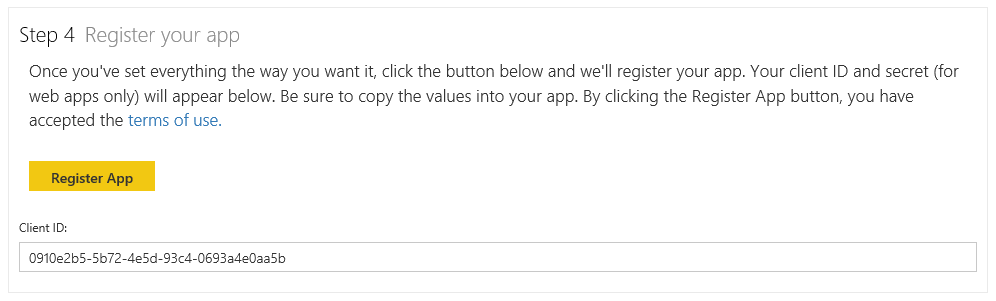
Leave the browser page open -- we will need to copy the Client ID and paste it into our C# app.
Build the App
The C# app UWP that we're going to use combines the Power BI REST APIs (more on this here) with the use of headless device flow from the Azure Active Directory Library described here.
The full source of the app is available on our GitHub repository here.
To run your application on your device, you need to get the source code and find the clientID constant in PBIClient.cs:
  // WeatherPBIApp: replace with the actual Client ID from the Azure Application:
 private const string clientID = "<replace>";
Replace the value with the string obtained from the registered Azure Application at the previous step and compile the app for ARM architecture. For this app, you will need to connect your Raspberry Pi to a monitor (keyboard and mouse are not required) to display the user code from the device. While this means that the device is no longer completely headless, you might imagine a slightly more advanced version of the app where the user code is communicated via an SMS message, an HTTP POST request, or is displayed on an LED matrix.
Deploy the app to your Raspberry Pi. If all goes well, you should see the following:
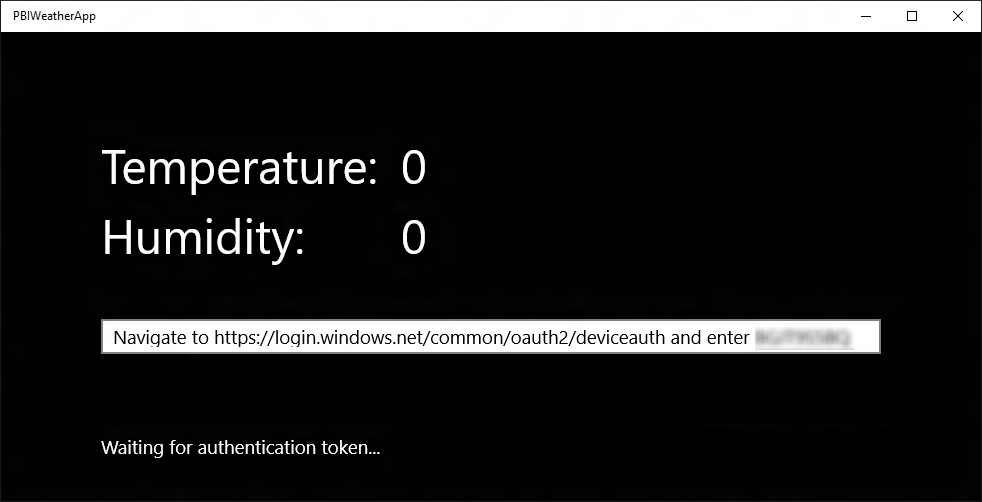
Now switch to another device -- either a desktop PC or a phone and navigate to the specified URL. Type in the specified user code and press Continue:
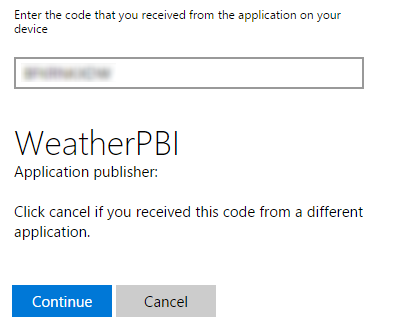
Once the user code is accepted, the application will receive the access code and start sending data to Power BI.
Configure Power BI Dashboard
Log in to your Power BI account and look for the "WeatherReport" dataset in the navigation bar on the left. In the Visualization pane create a "Temperature by Time" line chart:
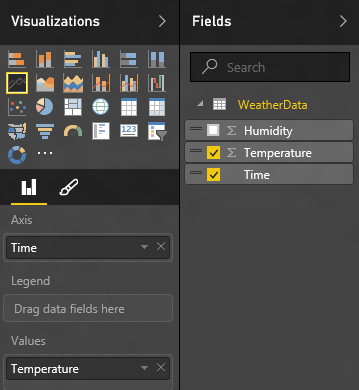
You can then create a "Humidity by Time" chart in a similar way. Alternatively, you can plot both temperature and humidity on the same axis.
Now save your report and pin it to the dashboard. You should see something that looks like this:
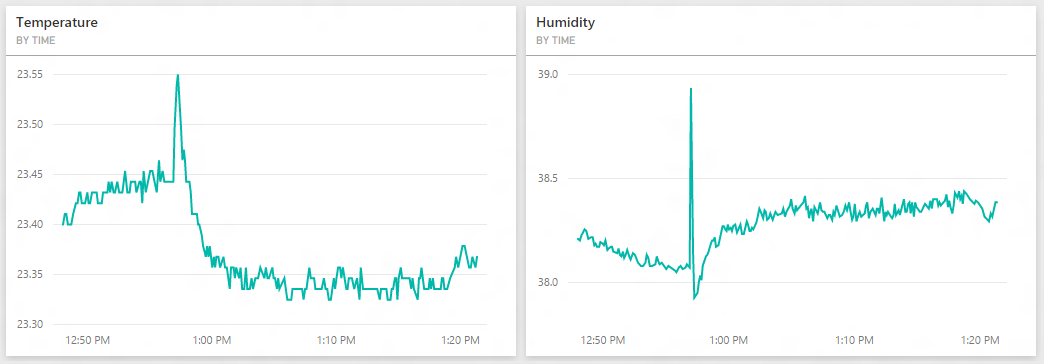
That's it! Enjoy your weather station!
Summary
In this post we explored how to use PowerBI REST APIs on Windows 10 IoT Core together with the new Azure Authentication Library headless authentication flow. Unlike some previous attempts at this, this approach allows you to send data to Power BI directly from your headless device, without using additional Azure services such as Azure Event Hub or Stream Analytics. The authentication is performed using an accompanying device, obviating the need for a desktop gateway device.