Fsharp & Excel: Creating Excel charts from F# FSI
Following up with the recent announcement on F# EasyChart, I like to point out a few .net charting libraries that can potentially be applied to the interactive development environment like the F# FSI window.
- VSLAB – lots feature in 3D plot, can be run as VS2010 add-in
- XtraCharts – Industry strength, good for drag and drop designer type of development, but not great for FSI
- Microsoft Chat Controls – it is the base for EasyChart, it is good for apps
- DotnetCharting – has a several unique charts, it is good for domain specific applications.
In this blog, I also like to demonstrate how to call Excel chart libraries from the FSI window. There are several benefits for using the excel charts from FSI
- Popularities: most people has experience with excel charting. It is easy to prettify, add a title, copy and paste the chart into your presentation.
- Community: there are plenty C# to Excel code example. To find out how to do a 3D plot, you can simply Bing it.
Step0: Software Setup
- VS2010 + Office 2010
Step1: Past in following code in FSI
#r "Microsoft.Office.Interop.Excel"
#r "office"
open Microsoft.Office.Interop
let dataX = [|0.0 .. 0.1 .. 10.|]
let dataY = [| [|for f in dataX -> cos f|];
[|for f in dataX -> sin f|] |]
// Update the excel charting object
let xlApp = new Excel.ApplicationClass()
let xlWorkBook = xlApp.Workbooks.Add()
let xlWorkSheet = xlWorkBook.Worksheets.[1] :?> Excel.Worksheet
let xlCharts = xlWorkSheet.ChartObjects() :?> Excel.ChartObjects
let xlChart = xlCharts.Add(1., 1., 460., 380.)
let myChart = xlChart.Chart
// Fill in a excel worksheet with data from dataY[][]
for i in 1 .. dataY.Length do
for j in 1 .. dataY.[i-1].Length do
xlWorkSheet.Cells.[j, i] <- dataY.[i-1].[j-1]
let xlRange = xlWorkSheet.Cells.CurrentRegion
myChart.SetSourceData(xlRange)
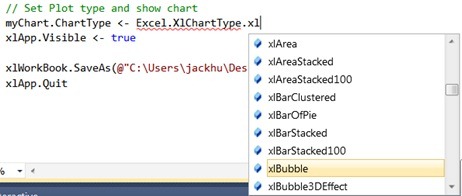
// Set Plot type and show chart
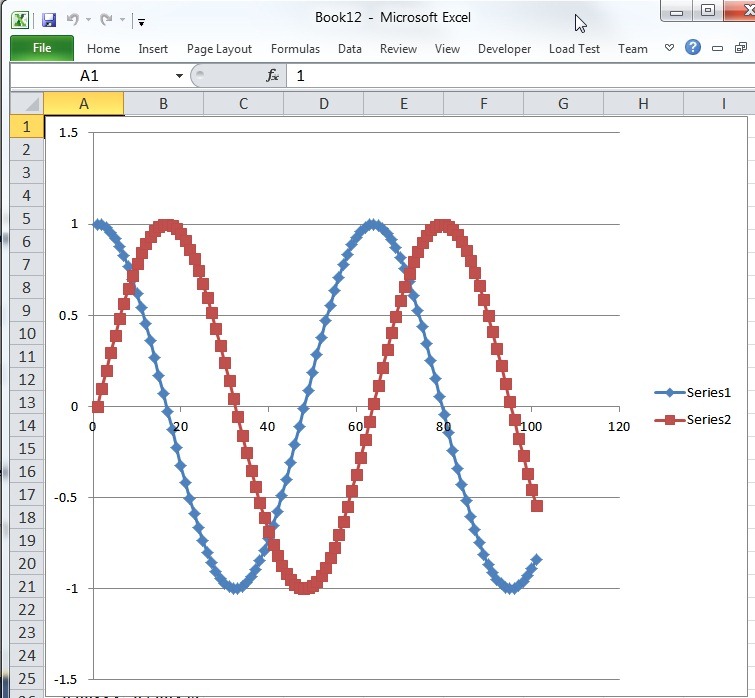
myChart.ChartType <- Excel.XlChartType.xlXYScatterLines
xlApp.Visible <- true
It result in:

FSharp language services Intellisense fairly useful to select a right chart.

Happy coding