Troubleshoot Exchange 2013/2016 Managed Availability
Exchange 2013/2016 has a Monitoring system called Managed Availability which detects and recovers automatically from problems as they occur and as they are discovered.
The large majority of bluescreen and process recycle you can encounter on Exchange server are triggered by this module in order to restore the service as quick as possible by forcing a restart.
I am sharing here a script that can help troubleshoot issues related to this module.
Download the script from codeplex
This tool helps troubleshoot these scenarios :
-----------------------------------------------------------
- Bluescreen / Force reboot
Here is the information you will see if you capture a memory.dmp during a crash triggered by Managed Availability:
The crash will be a stop F4 or EF on wininit.
kd> !analyze –v
…
MODULE_NAME: wininit
PROCESS_NAME: msexchangerepl
BUGCHECK_STR: 0xEF_msexchangerepl
DEFAULT_BUCKET_ID: WIN8_DRIVER_FAULT
- Service & application pool restart , components disabled , and all possible recovery actions triggered by Managed Availability
- SCOM alerts reporting Managed Availability failures
- Unhealthy monitor
ManagedAvailabilityTroubleshooter script allows to :
------------------------------------------------------------------
- Automatically identify related responder , monitor & probe for these different scenarios and dump their properties
- Easily visualize the related events with detailed fields
- Provide the PowerShell command to disable the recovery action as a workaround if needed while troubleshooting
- Provide automatic resolution recommendation if you are looking at a probe which has known issue
- provided PowerShell command used with verbose switch. Most properties can't be seen by opening related eventlog and require to run PowerShell commands to see related attributes.
How to run the tool :
---------------------------
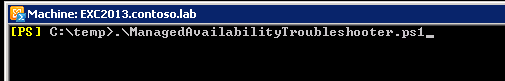
Execute the script directly on the Exchange 2013 server you need to investigate using Exchange PowerShell.
Copy the script to c:\temp
Or Collect the logs & analyze on a different machine :
Copy the script to c:\temp
Run this command from Exchange PowerShell :
.\ManagedAvailabilityTroubleshooter.ps1 –Collect
This will generate a zip file with logs useful to investigate Managed Availability issues
To Analyze the logs on a different machine :
Extract the zip generated on the machine
Copy the ManagedAvailabilityTroubleshooter script in the path of these collected logs.
Run it using Windows PowerShell 
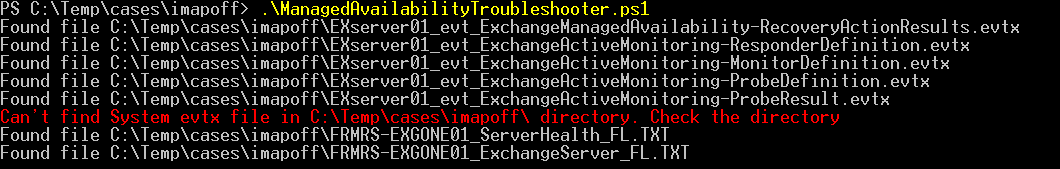
The script will use the files in local path. In case some files are missing or duplicate in your directory, you will get a warning.
As an example here , I deleted the system log.
Select the scenario you like to troubleshoot:
--------------------------------------------------------
The ManagedAvailabilityTroubleshooter script will ask you to select the option that best describe the your issue
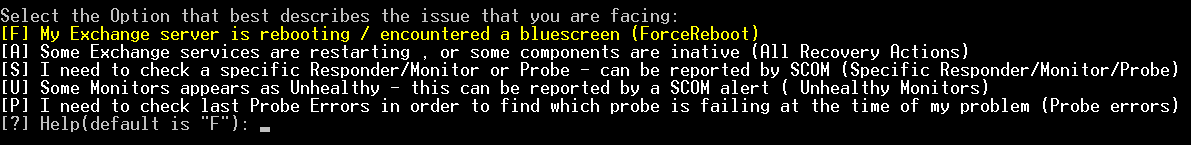
Default is F to investigate force reboot.
In this example , the problem is pop3 component marked as inactive.
In that case , I type A and then enter to use the “All Recovery Actions” option.
Most scenario will start by displaying the different failures /recovery actions you had on the machine and ask you to select the one you like investigate. 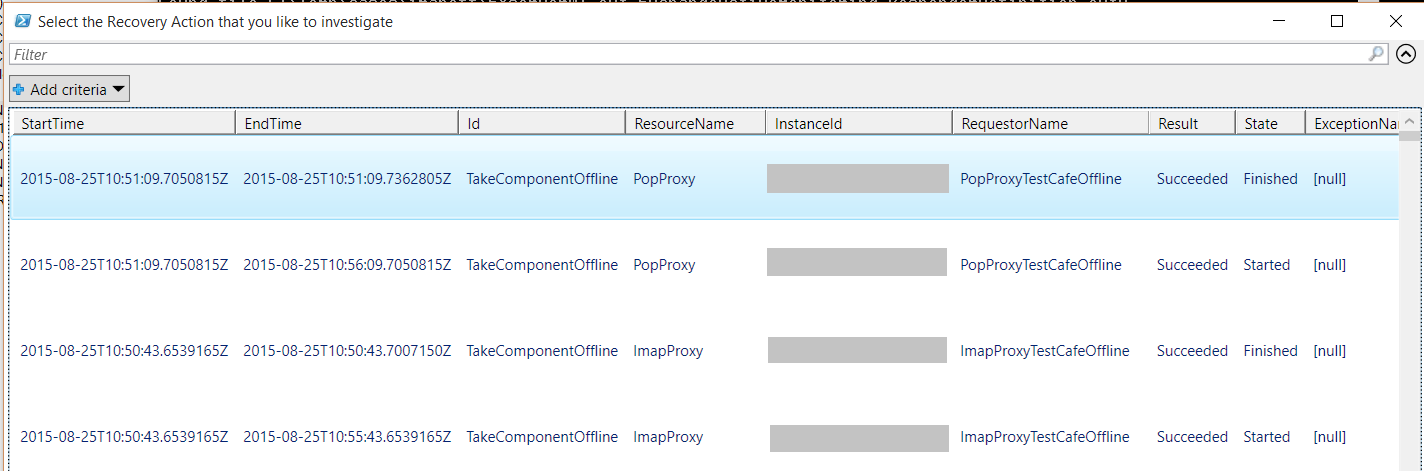
Disabling the recovery action while troubleshooting in case this recovery action create more problem than solution :
------------------------------------------------------------------------------------------
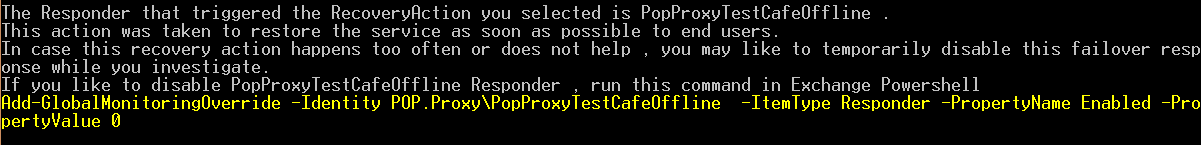
Recovery actions as forcereboot via bluescreen are used to restore the service as quick as possible for end-users.
In case this action does not help and appears too often , you may want to temporarily disable the responder while you investigate.
The script will provide you the PowerShell command to run for that purpose.
If you run the script directly on the server, you can set this override directly using the script and check if the change is applied.
Troubleshooting the root cause :
------------------------------------------
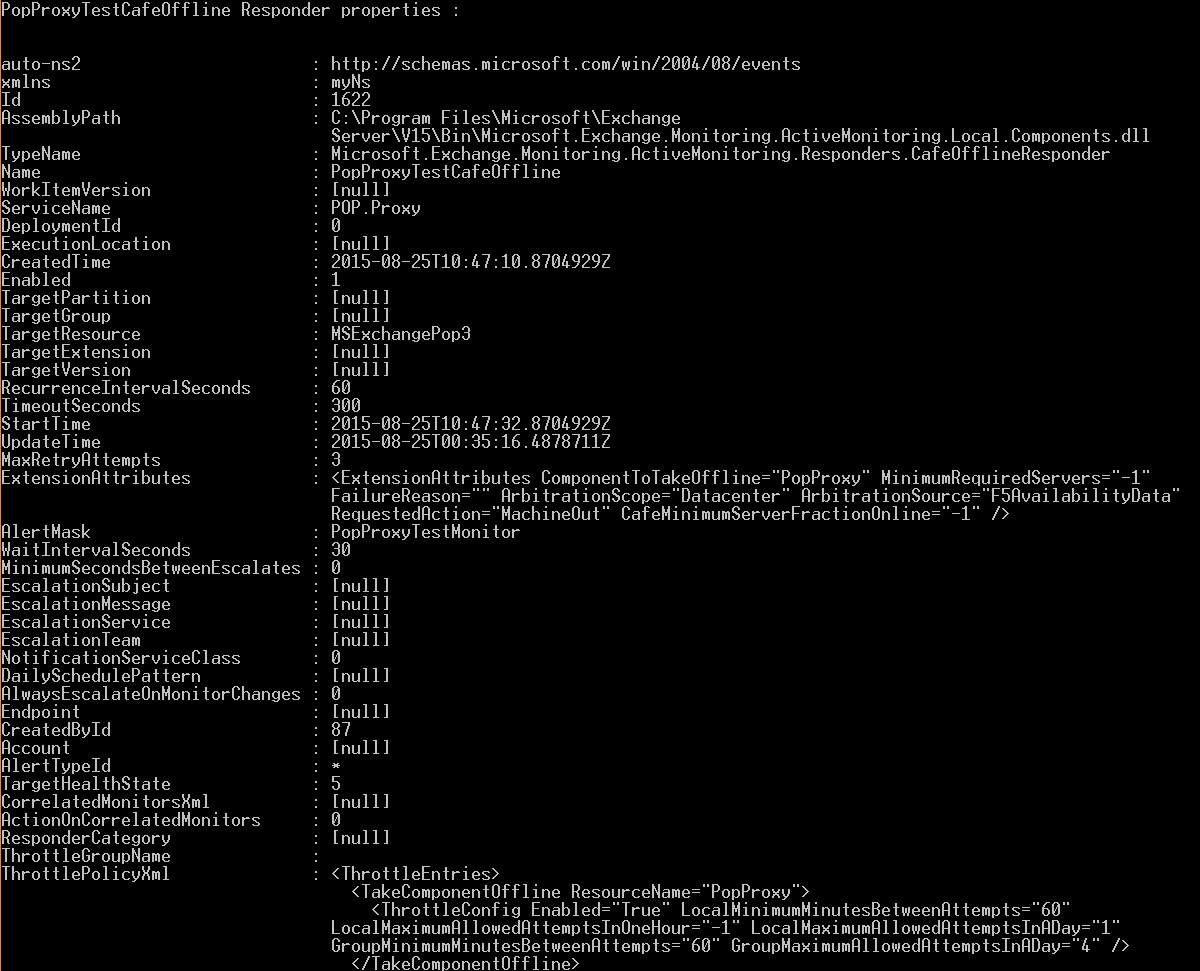
The ManagedAvailabilityTroubleshooter script automatically identify related modules : Responder , Monitor and Probe.
It will display their properties and relationship.
![popmonitor[1]](https://msdntnarchive.blob.core.windows.net/media/2015/10/popmonitor1.png)
![popprobe[1]](https://msdntnarchive.blob.core.windows.net/media/2015/10/popprobe1.png)
The script automatically display last 200 probe events of the Probe which should be the root cause events.
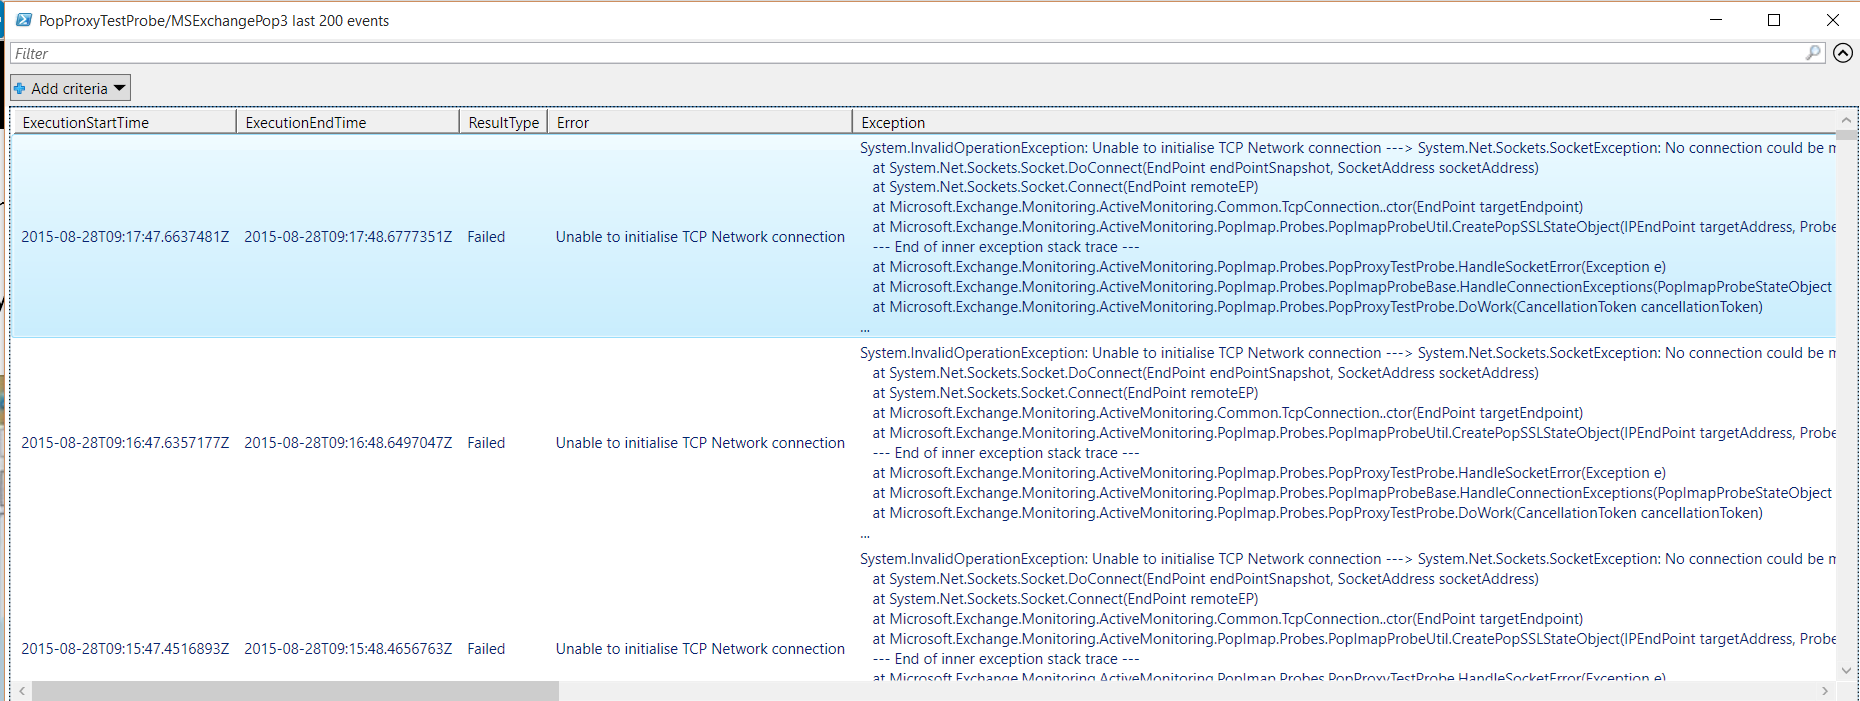
By default it is parsing only last 200 probe events for quicker response time.
If your logs were not collected quickly after the issue , you have the option afterwards to parse all events but this is of course slower.
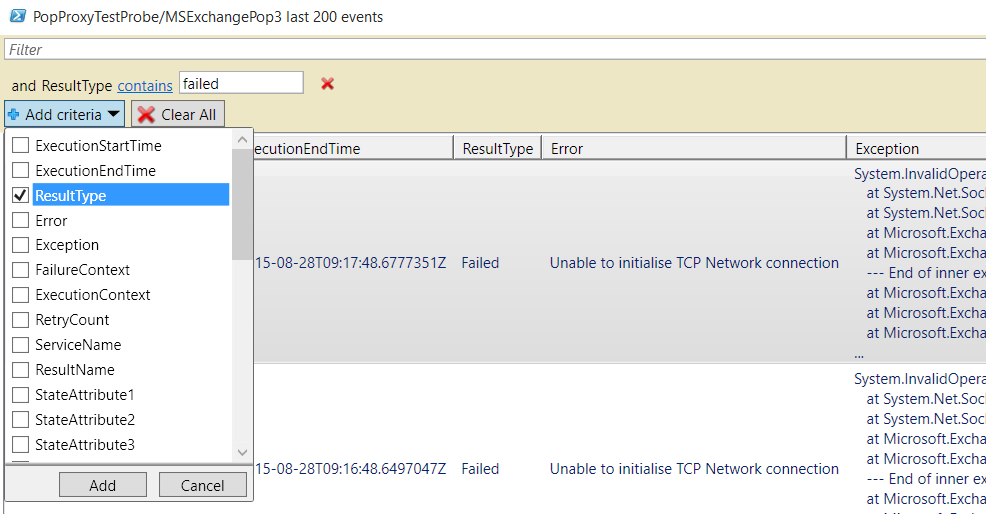
You can use "Add criteria" button to filter results and for example look only at failures :
The time of the events is displayed in GMT timezone.
Automatic resolution recommendation:
--------------------------------------------------
The script can provide automatic resolution recommendation if you are looking at a probe which has known issue/recommendation.
This is the case here : it was due to non-default pop3 settings blocking 127.0.0.1 binding .As result pop3 availability test performed on this IP is failing.

Checking a specific probe/Monitor/Responder:
-----------------------------------------------------------
You may want to check events for a specific probe.
In this example you may have fixed the pop3 setting and not encountering the issue anymore but like to check the current pop3 probe events to be sure they are fine.
In that case when you run the ManagedAvailabilityTroubleshooter script , type S +Enter for checking a specific probe/monitor and then enter the name of the probe as in the printscreen below
( probe name is POPProxyTestProbe in this example as you can see in Troubleshooting section ) 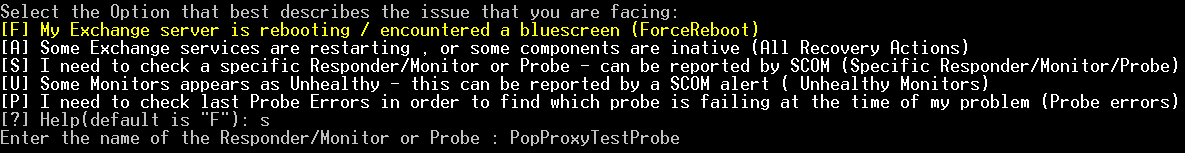
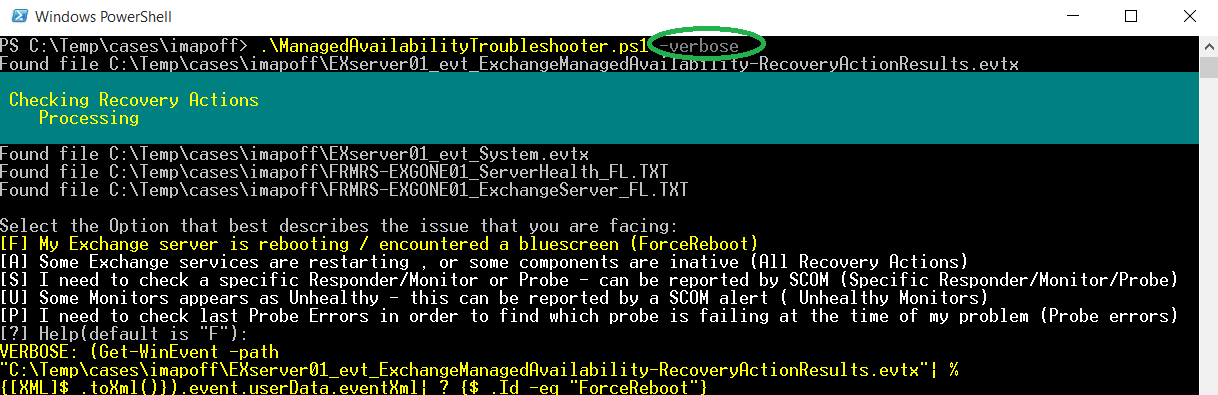
Verbose parameter allows to see PowerShell commands used :
--------------------------------------------------------------------------------
You might want to run some PowerShell command manually to see similar information and eventually modify it.
You can find the PowerShell command used by the tool using the -Verbose switch :