Analyzing W3C IIS Log with PowerBI
IIS and HTTP.sys logs contain incredible source of information to help in identifying potential issues.
When I first started troubleshooting IIS/Websites issues, LogParser (and LogParser Studio) was my go to tool - writing queries to find information, or generate charts to impress people.
I have been using PowerBI for quite sometime and it never occurred to me to use it as a tool for log analysis. In this post, I will explain on how to transform raw W3C Extended Log File Format into CSV, and then import it to PowerBI.
Tools needed:
- Log Parser (free!)
- PowerBI Desktop (free!)
Transforming W3C IIS Logs to CSV
You most likely have over hundreds of log to be analyzed, I wrote a script to help in converting them into CSV. In my most recent customer, they have 500 logs, over period of just one year.
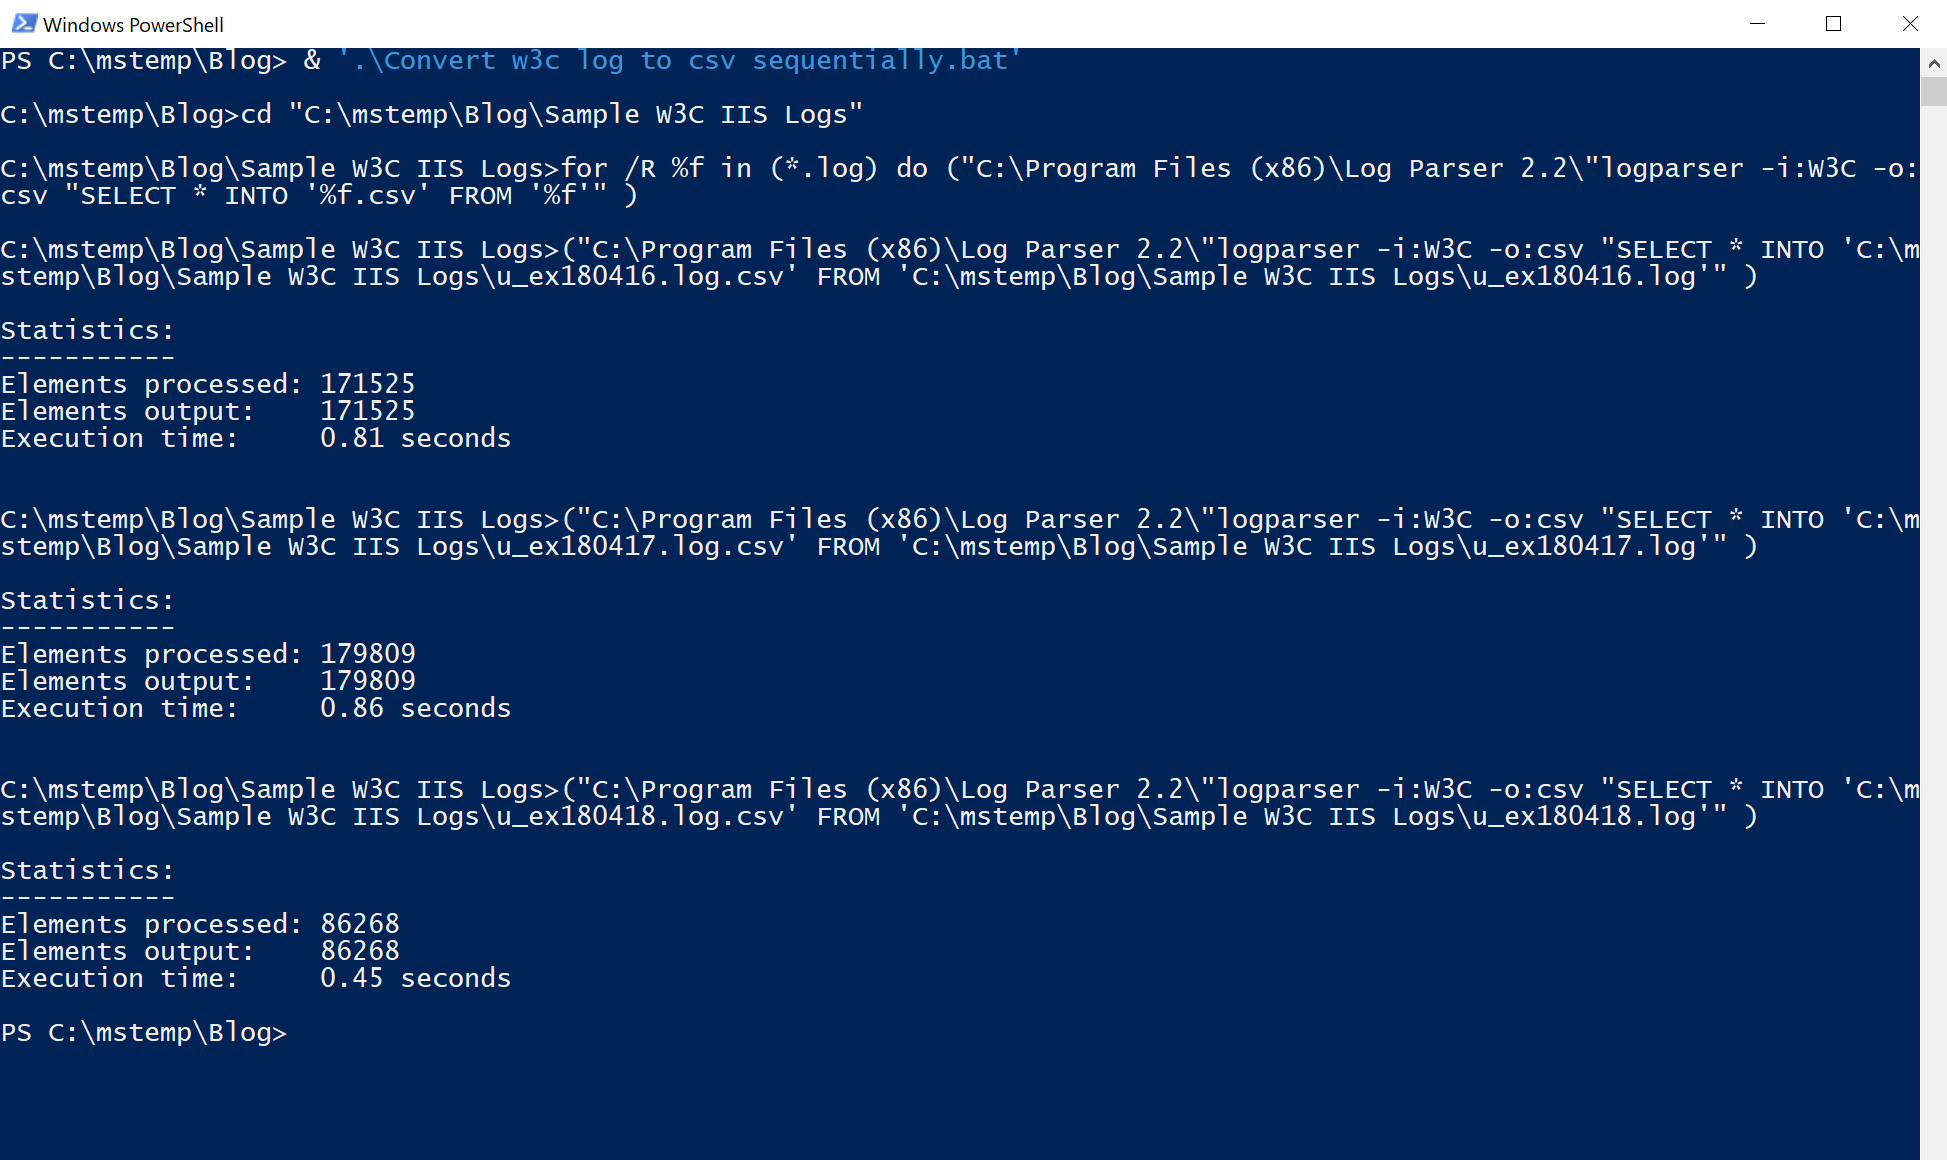
Make sure you have logparser installed, and note down the install location. I wrote a small batch file to convert W3C IIS logs to CSV using logparser. You can get the .bat here, make sure to modify the script to include your logs location, and logparser.exe location.
Run the script, and the converted .CSV will be placed in the same folder as your logs.
[caption id="attachment_435" align="alignleft" width="1024"]
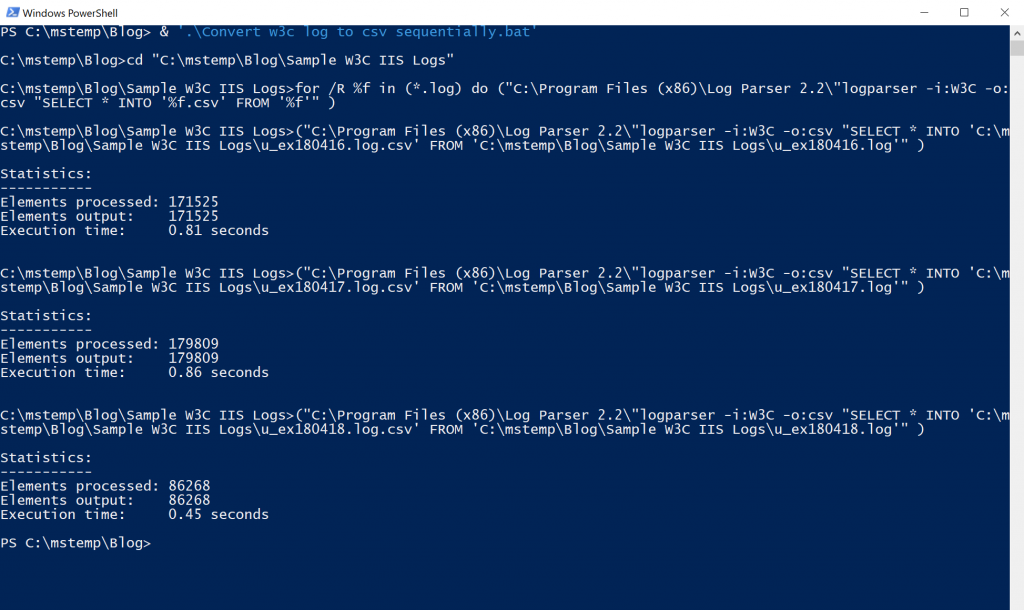 Converting W3C IIS Logs into CSVs[/caption]
Import Converted .CSVs into PowerBI
- Open Power BI
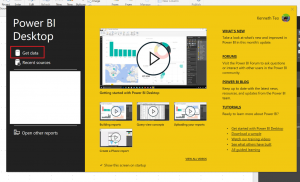
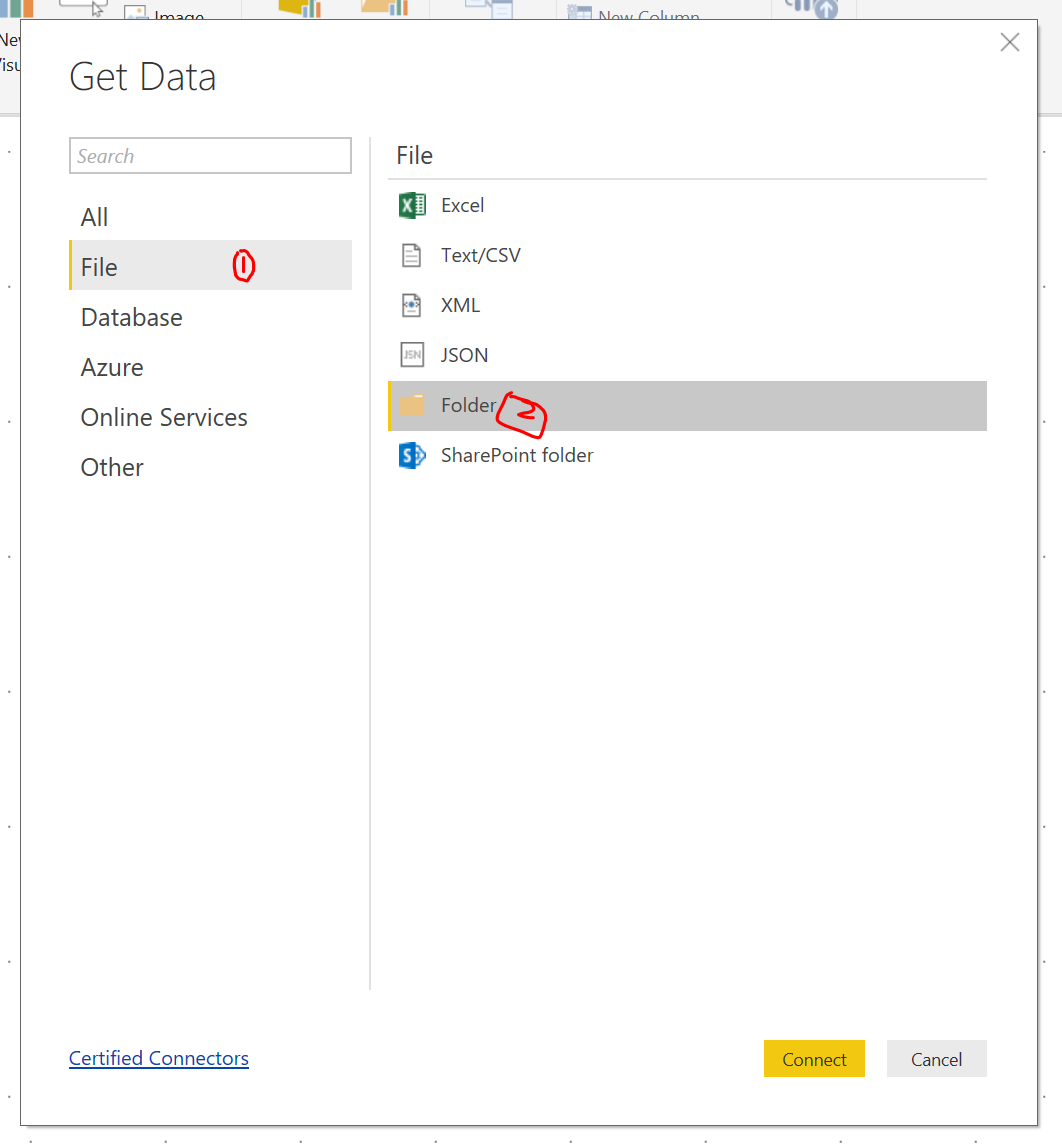
- Choose Get File and select the folder where your converted CSV Logs reside, click OK

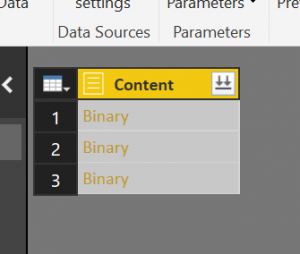
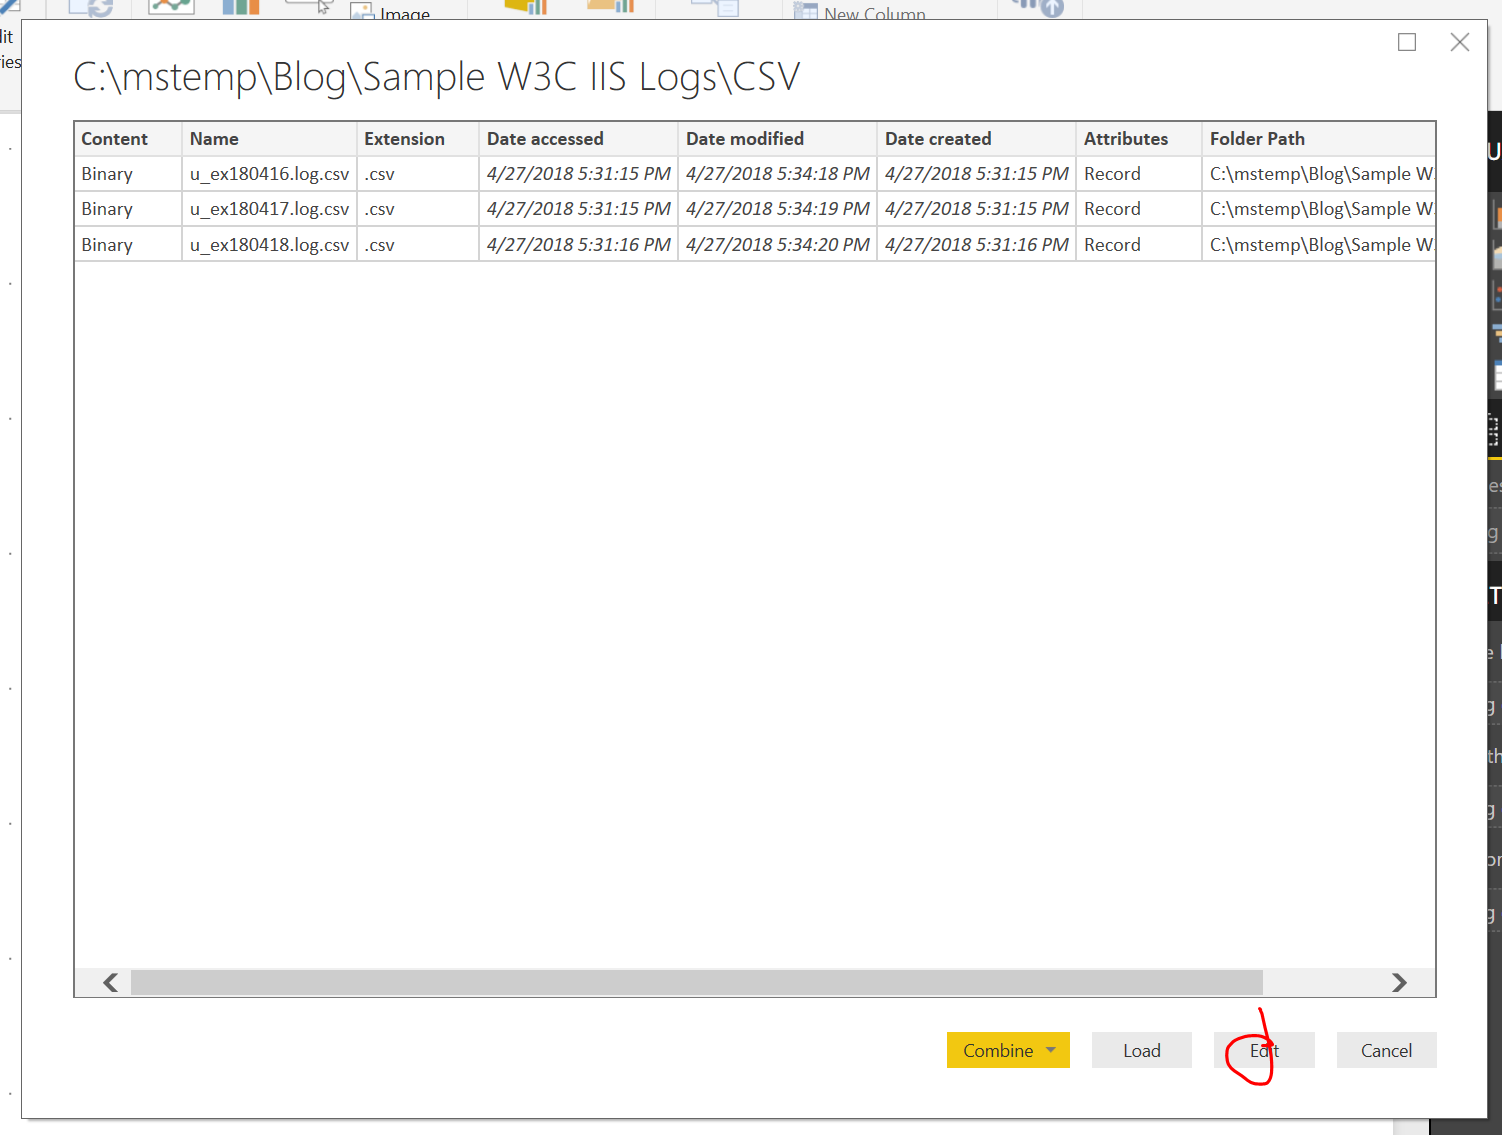
- You will notice that it is importing the file's binary (column 1) and its metadata (rest of columns). We don't want the metadata, we want the binary within these files. Click Edit.
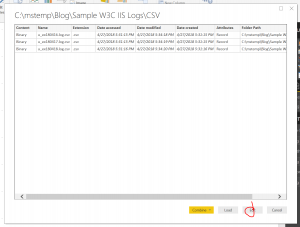
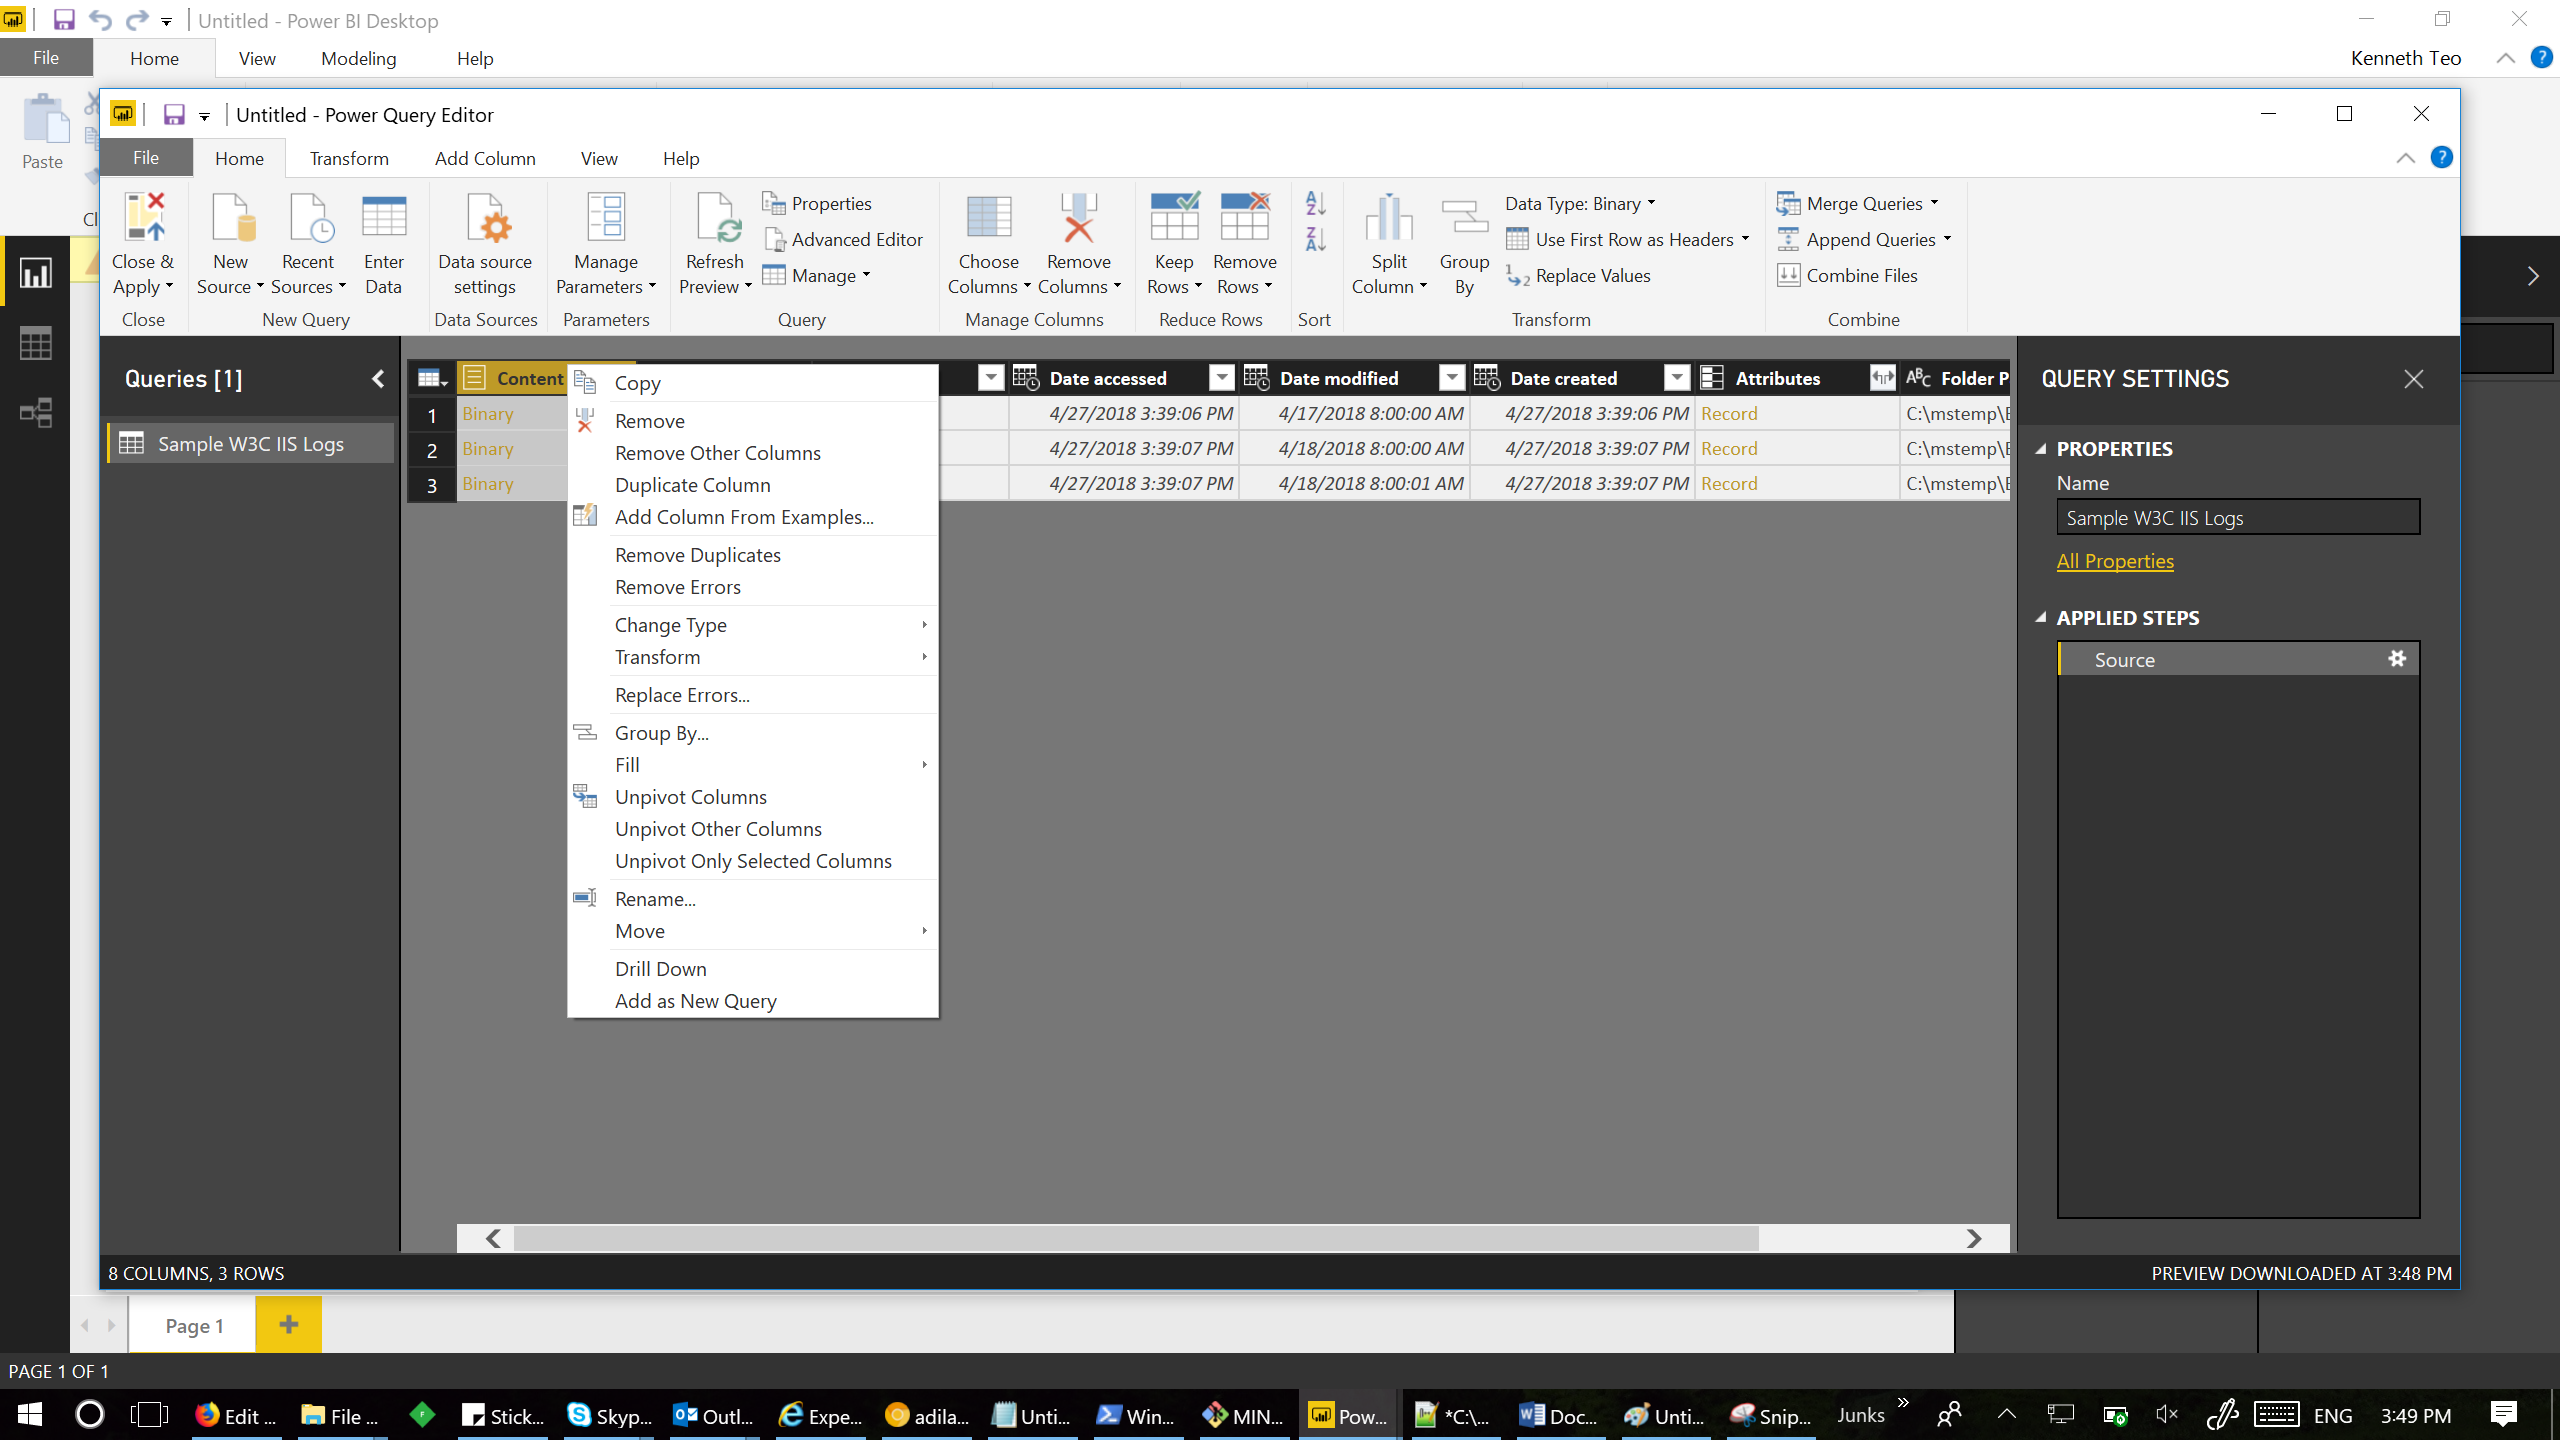
- In the Query Editor, remove all the other columns except the one contains the binary data.

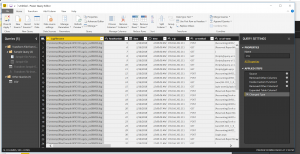
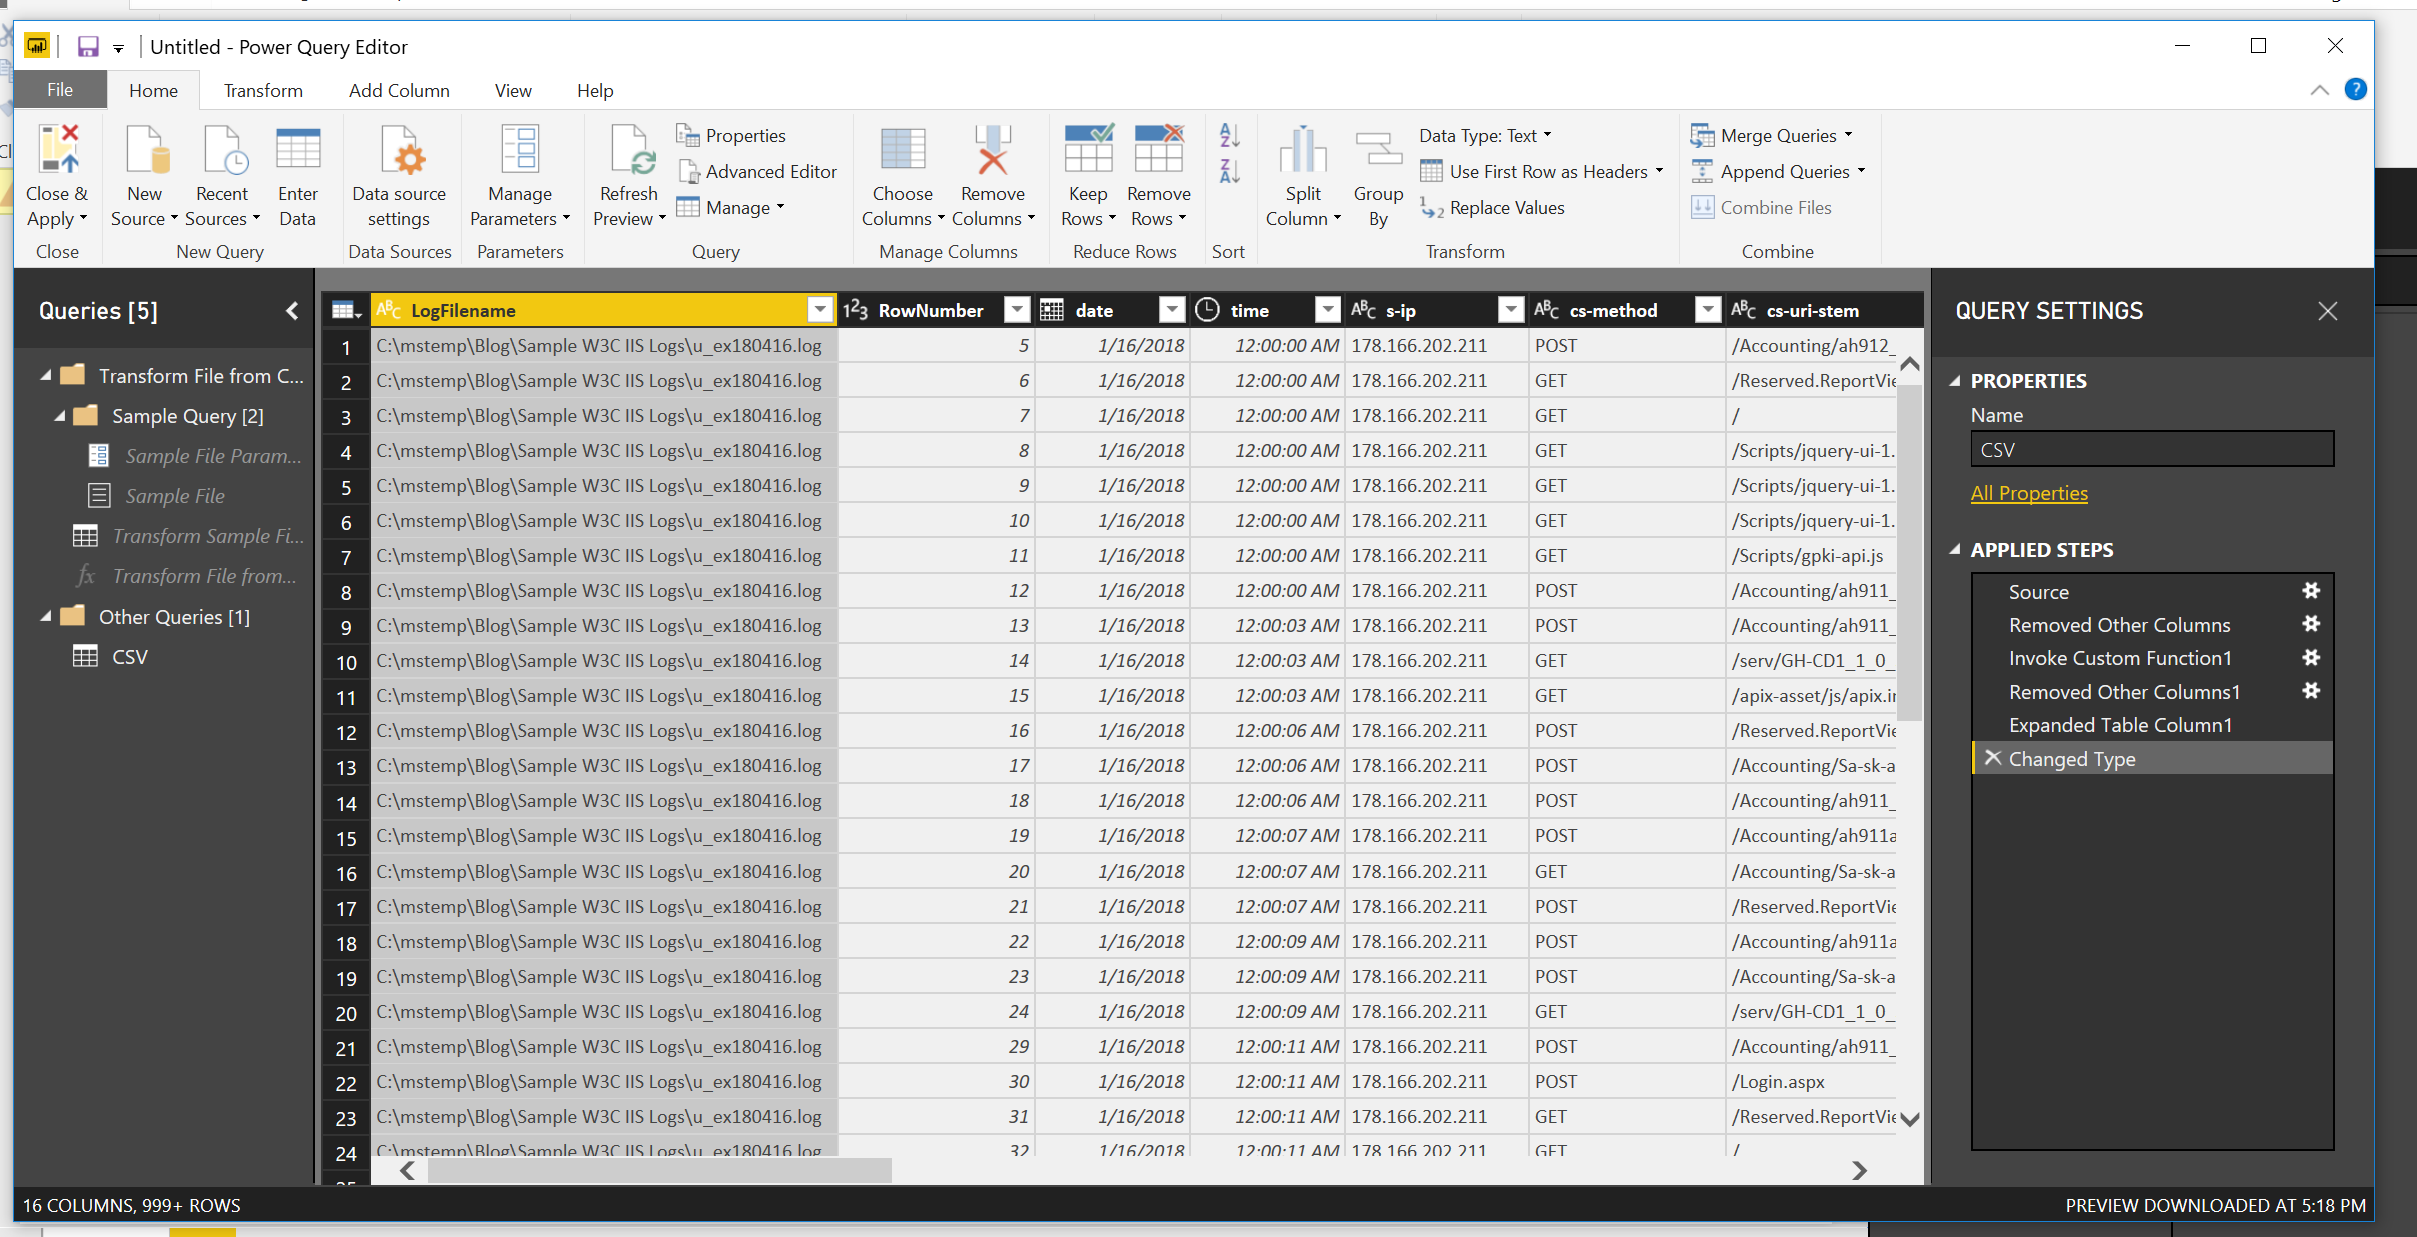
- Once you remove the rest of the columns, click on the button (next to Content, with two downward arrows) as shown below to expand the binary data
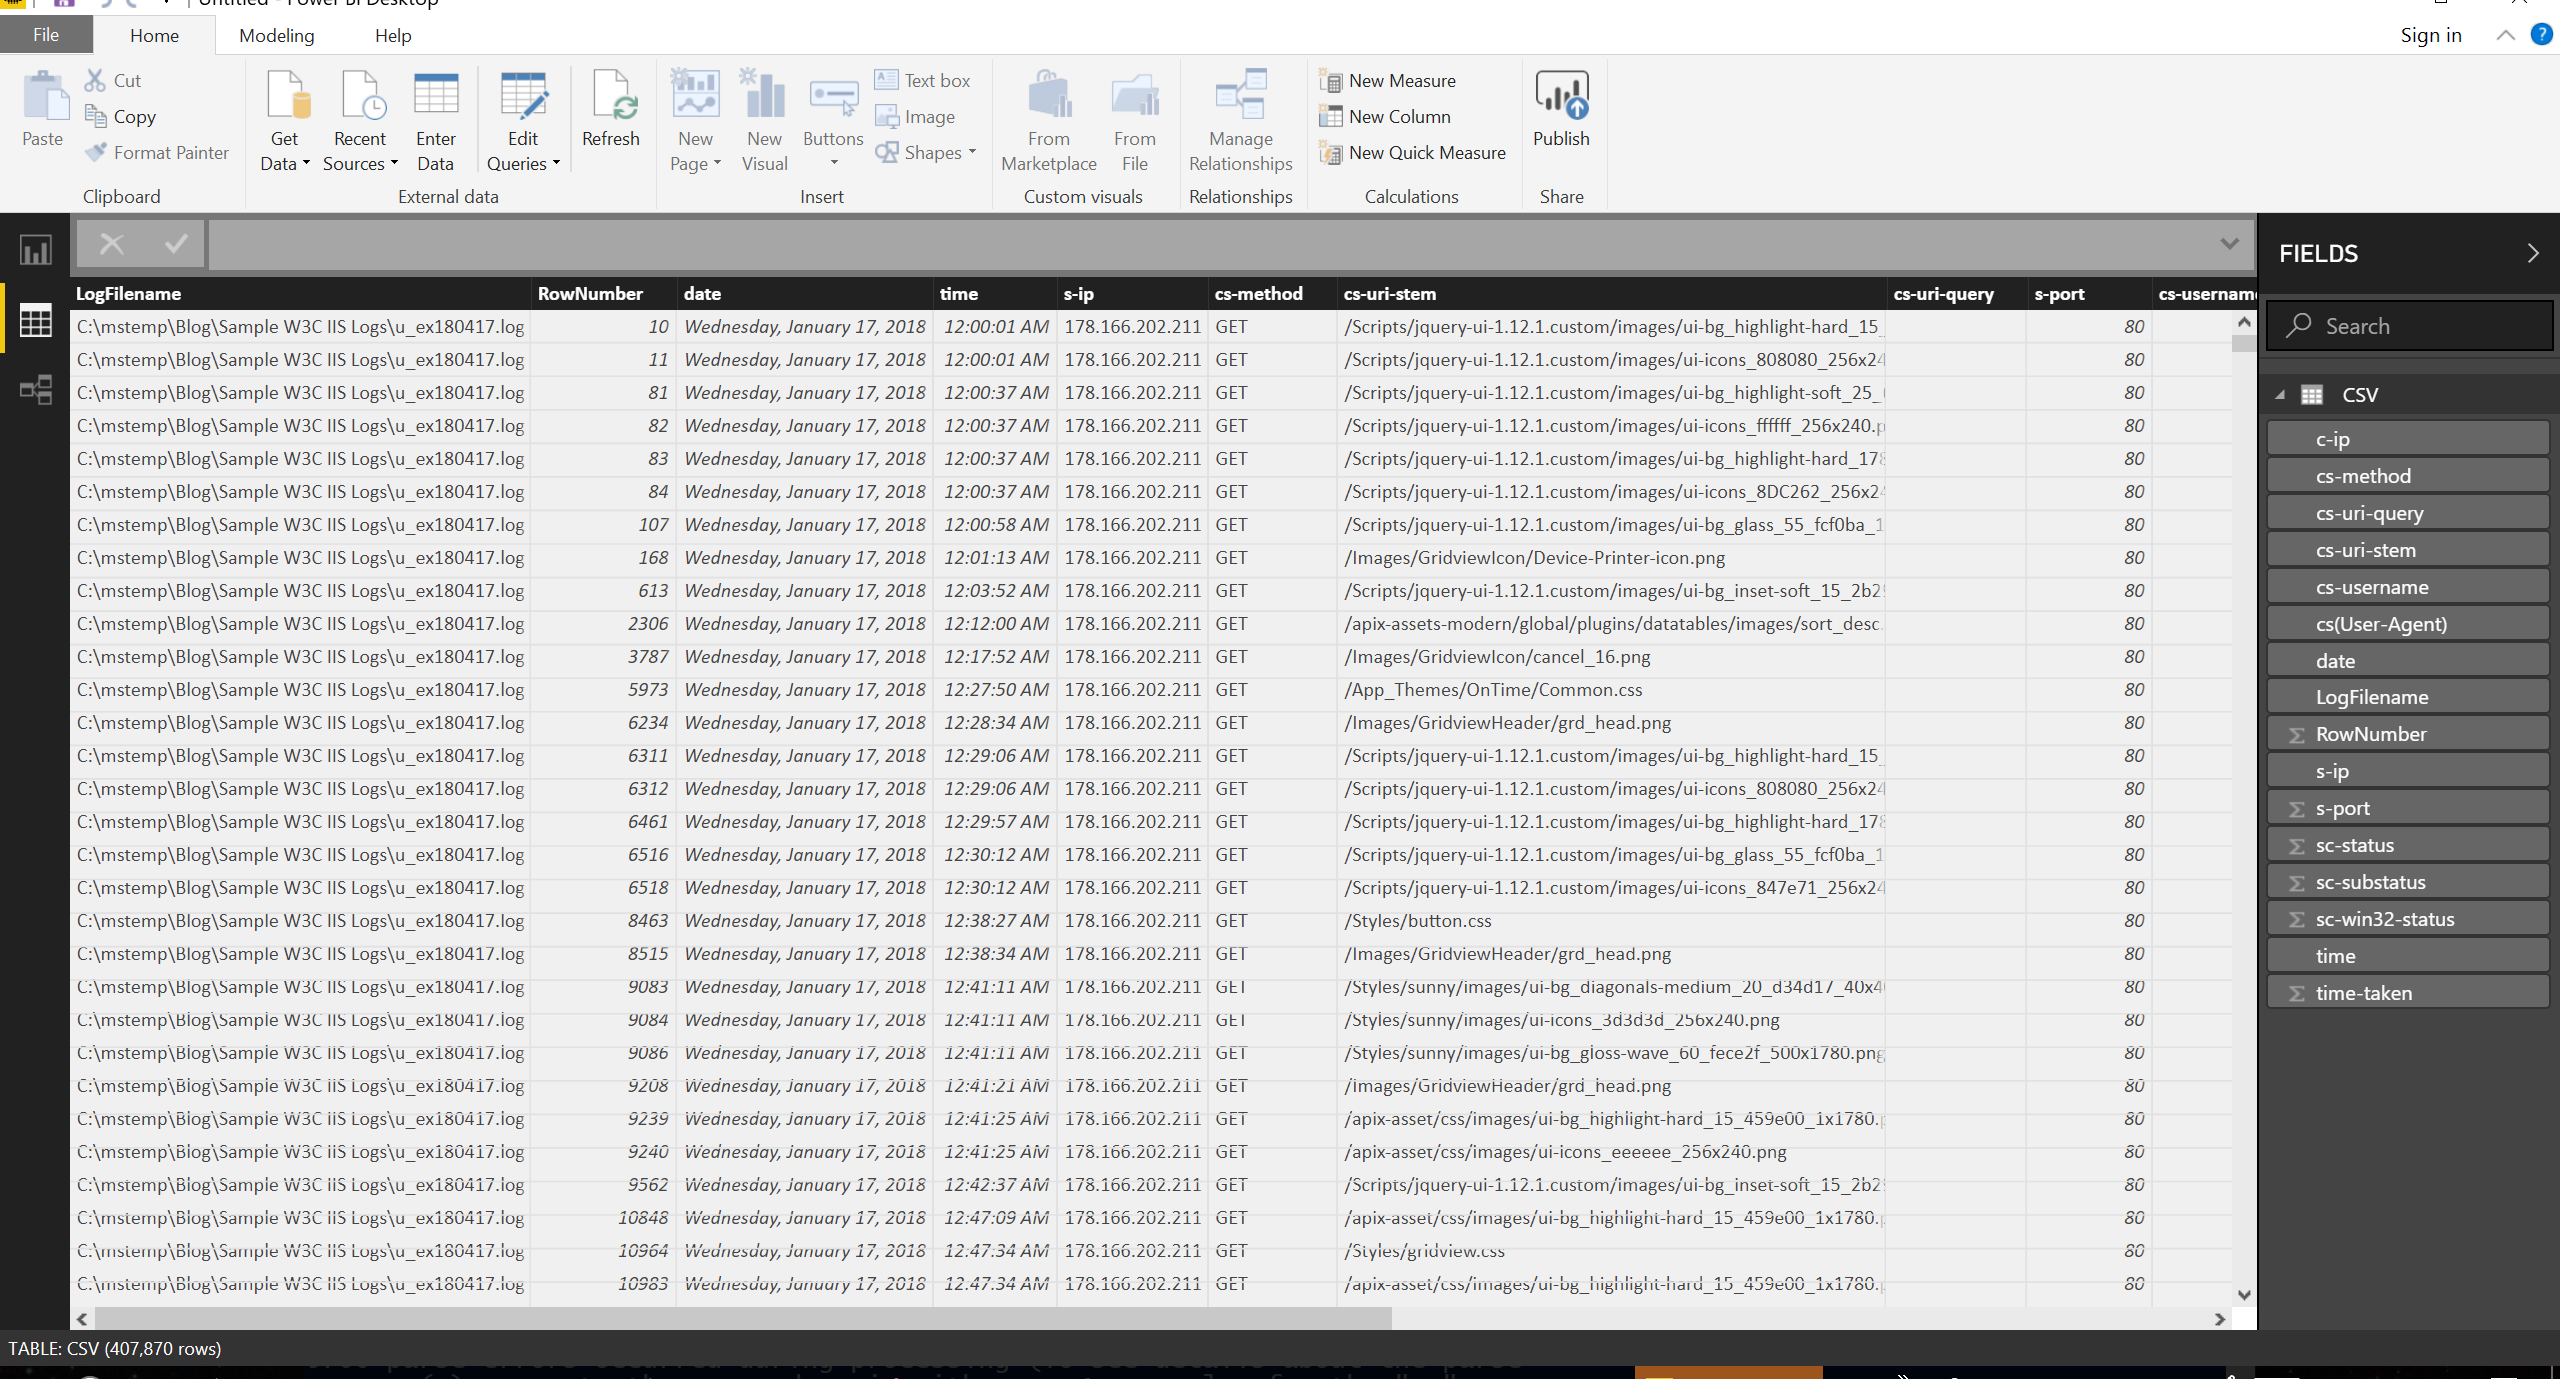
- Once expanded, in the Query Editor, click "Close and Apply"
- Wait for a few minutes, and you should see the "report" windows.
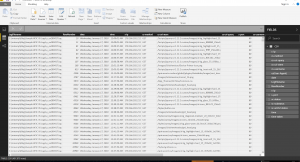
- You can then build any report or charts you like based on the CSV you have imported. The example I have shows table with highest average return time, sc-status, etc.
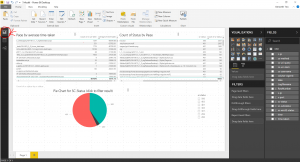


A sample of the PowerBI Model (.pbix) used in this blog can be downloaded from my GitHub repository
Happy charting.