Where did the good stuff go?
Is this a typical SharePoint Project/scenario in a nutshell?
1. Analysis phase: "SharePoint will fit our requirements! Lots of functionality we can use! Finally a product addressing a lot of problems we have. Workflows, forms, dashboards... Let's get this up and running as fast as we can!"
2. POC phase:
Small POC's (Proof Of Concepts) are made - what can we accomplish with ease?3. Dev. phase: First priority is on branding the sites to the company’s logo and color.
Migrate and/or upgrade existing systems to MOSS.
Optionally develop some custom functionality to cover business needs.4. Test
5. Deploy to production
I might be generalizing a bit harsh here, but I’m trying to make a point: Somewhere between phase 1 and 4 a lot of good thinking and functionality disappears. Where did all the good thoughts and ideas about gathering data with BDC from the whole company to dashboards end up? How were we going to save a lot of time and money on using Excel services and reports? Why were we not able to go the whole way?
There is of course not one single reason for this. Obviously lack of time and resources are the most common, but do the projects really have to have this structure? I would like to see a bit more continuity; the project timeline outlined above is only the start. And in most cases I think a good start. But to be able to implement and use all of SharePoint features it will require time, both for the employees and the company to learn and evolve.
Make sure you don’t stop your SharePoint project after the initial release. Make plans for how you gradually can start using more and more functionality.
If you need a little inspiration to get back on track, take a look at this demo:
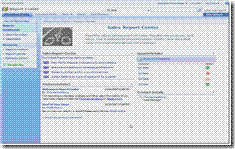
Business intelligence (BI) is the process of aggregating, storing, analyzing, and reporting on business data in order to support informed business decisions. Microsoft Office SharePoint Server 2007 provides a number of tools that can help you extract data from a variety of sources and present that data in ways that facilitate analysis and decision making. In this demo, you'll see how employees at a fictitious company called Adventure Works use a Report Center site to create and manage reports, dashboards, and key performance indicators (KPIs).
How to do it (text version):
Introduction to business intelligence in SharePoint Server 2007
Share Excel 2007 workbooks as interactive reports
Working with a Report Center site
Share and manage connections to external data
Create and publish Key Performance Indicators (KPIs)
Go back to your notes from the analysis and POC phase, pick up those great ideas you had again. Since you now already have SharePoint in place, it will not require much to go from a good to great implementation!
Good luck! :)
