Classify Yelp restaurant reviews' food origin with MicrosoftML
Yelp restaurant reviews are one of the most useful resources people use to pick restaurants. Reviews themselves not only carry sentiment towards the dining experience but also contain "meta-information" about the restaurant. For example, looking at a review that says
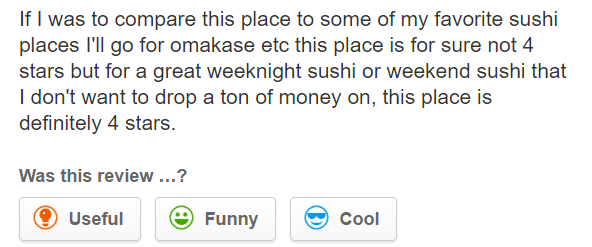
We can tell that this is a Japanese restaurant since it mentions omakase and sushi.
Natural language processing and machine learning can be applied to extract such meta-information from the reviews text data. We will walk through a simple example of using Yelp restaurant reviews text data to classify food origin of restaurants as a use case of multi-class classification machine learning algorithms. The MicrosoftML package is used which also comes with text feature transformations.
The yelp review dataset we used is hosted on https://www.ics.uci.edu/~vpsaini/ (There is a google drive link in the comment session https://drive.google.com/file/d/0B_likZ5R0qJMZlU5X0JEajZmVmM/view).
Extract the files into a folder named yelp_dataset which contains the partitioned train/test csv files shown below.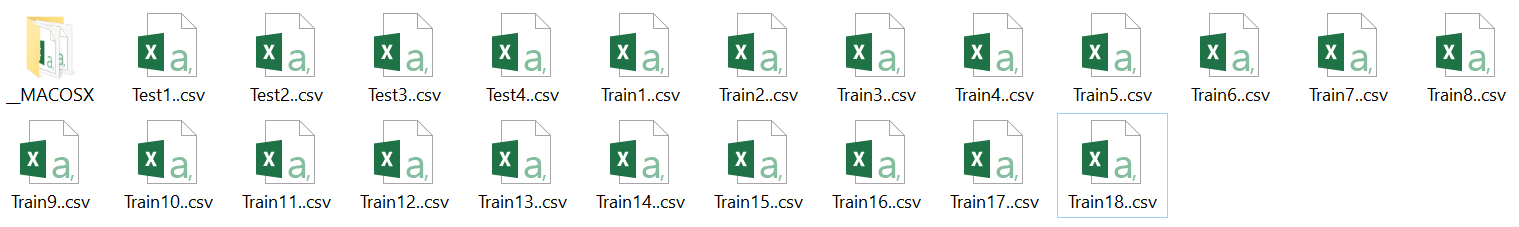
The data contains six columns, "mongo_business_id", "business_id", "mongo_review_id", "review_id", "review_text" and "categories". We will only be using two columns, "review_text", which is the actual text of the reviews, and "categories" composed of applicable Yelp restaurant labels. These two columns look like this: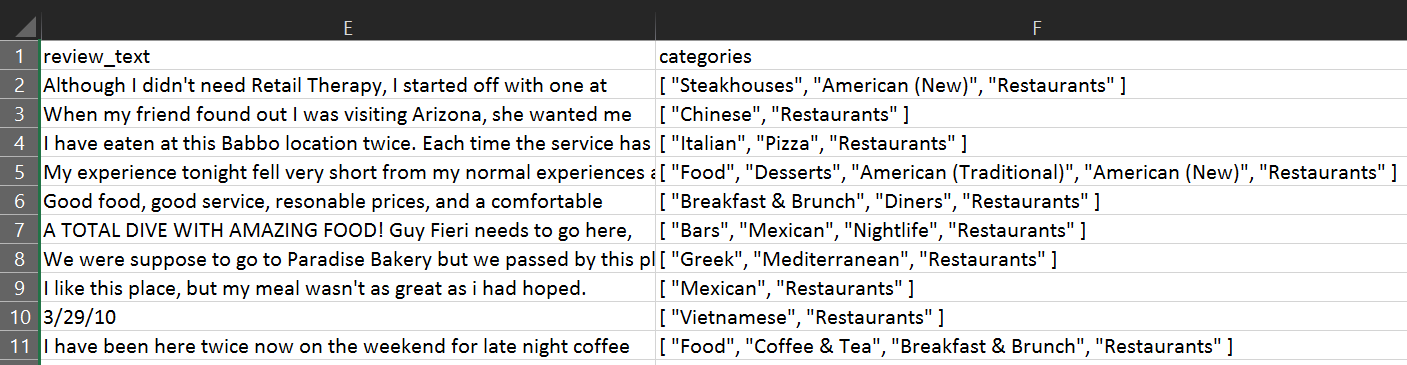
We will run R code in a Jupyter Notebook. (If R is not enabled in your Jupyter Notebook, install the IRKernal to enable it. )
The R code follows these steps:
1. Load the MicrosoftML package
Set the working directory to the yelp_dataset folder.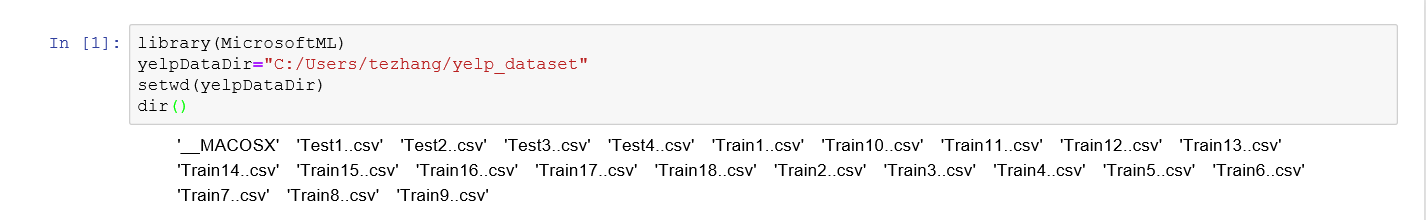
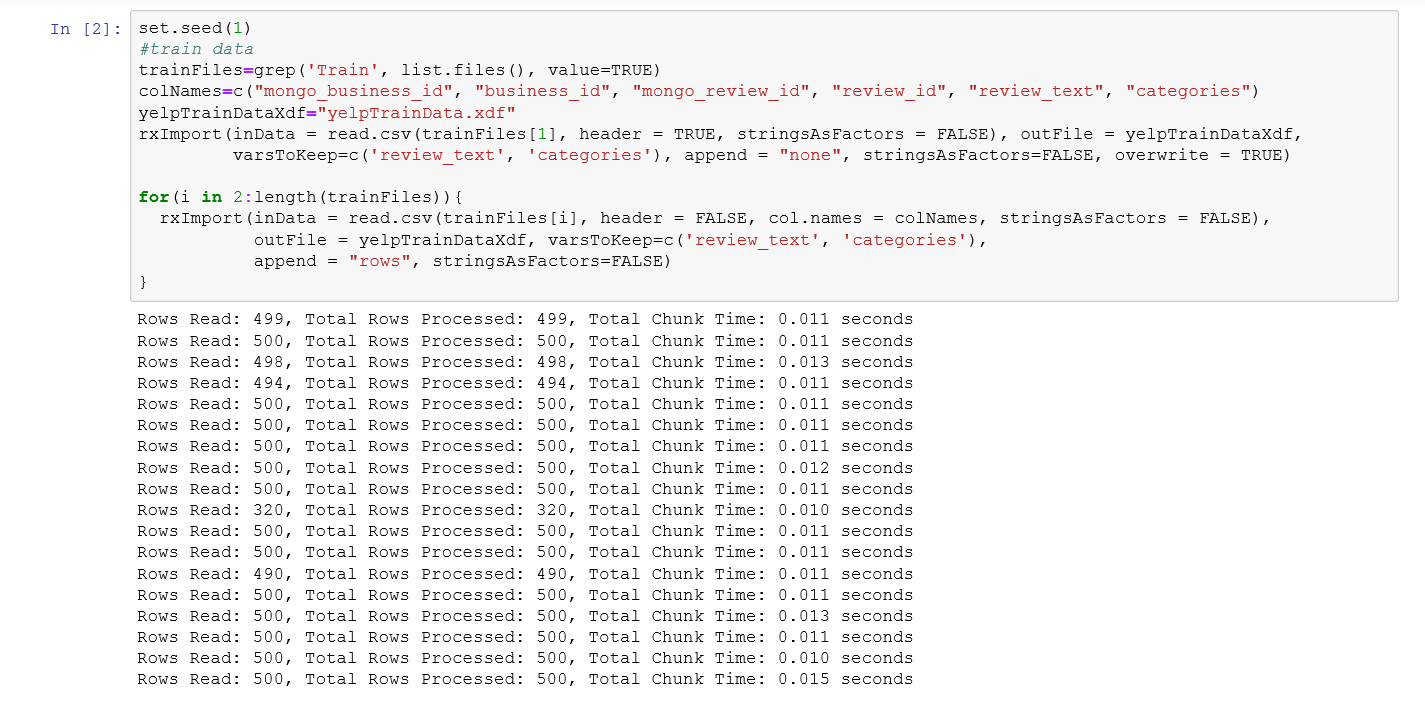
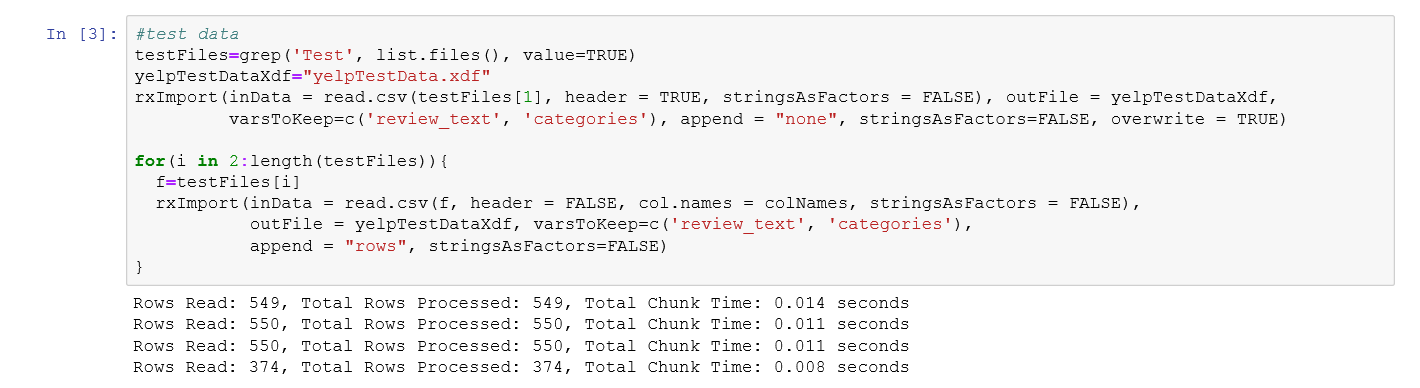
2. Read data
Read the files and make .xdf files as our data source for train and test data. Although the total size of the data is only 21.7MB and can fit into memory, we use .xdf files to demonstrate the use of data transform functionality of the MicrosoftML package.
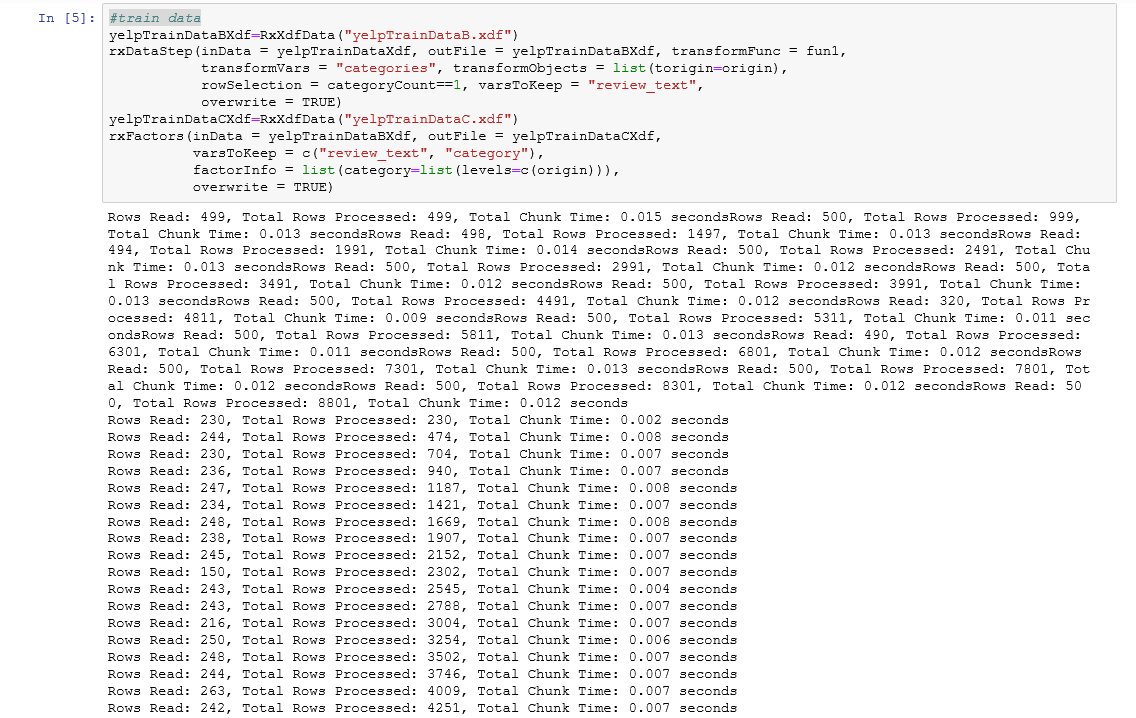
3. Prepare data
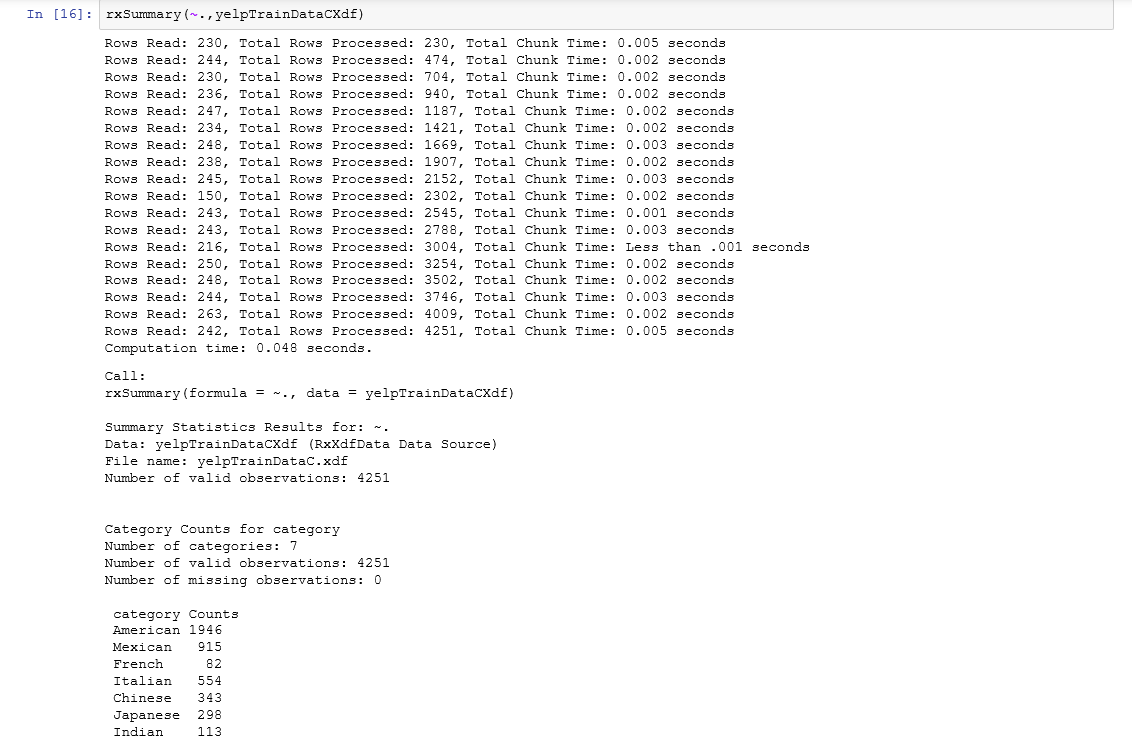
Use the "categories" column to produce food origin category labels. We removed smaller categories in the data set and are left with six categories "American", "Mexican", "French", "Italian", "Chinese", "Japanese" and "Indian" as well as reviews that fall into multiple categories. This is achieved by specifying rowSelection=categoryCount==1 in rxDataStep.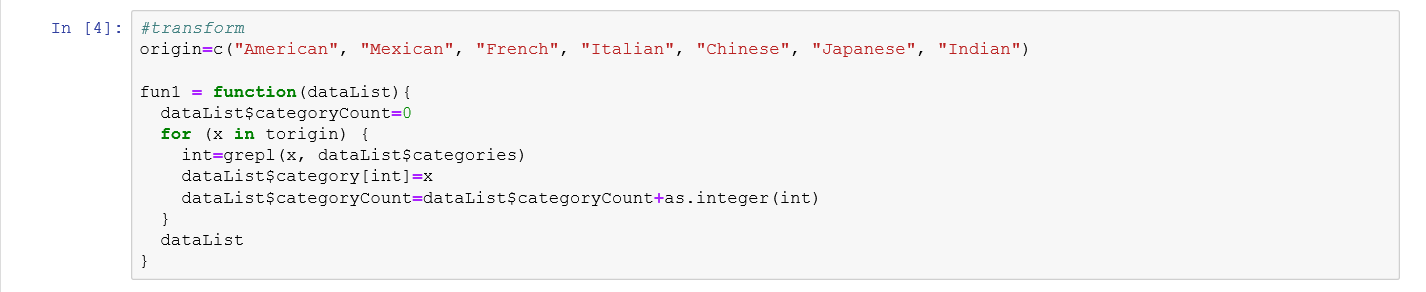
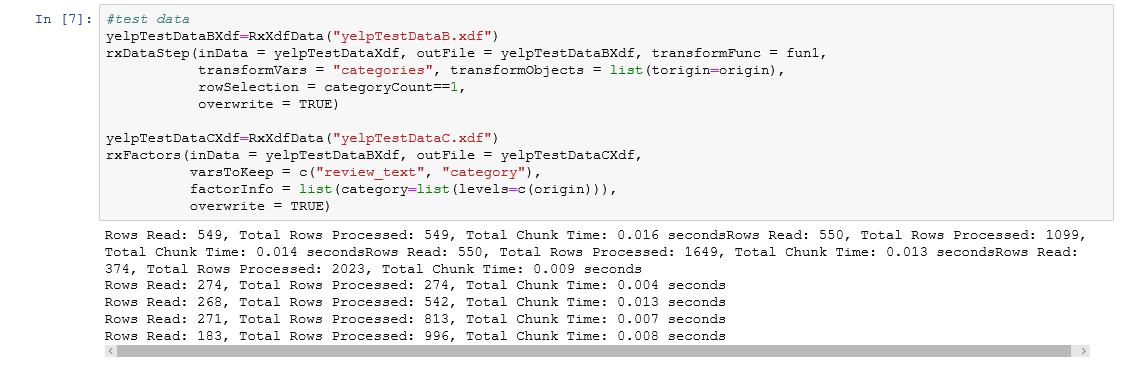
The resulting data looks like this. 
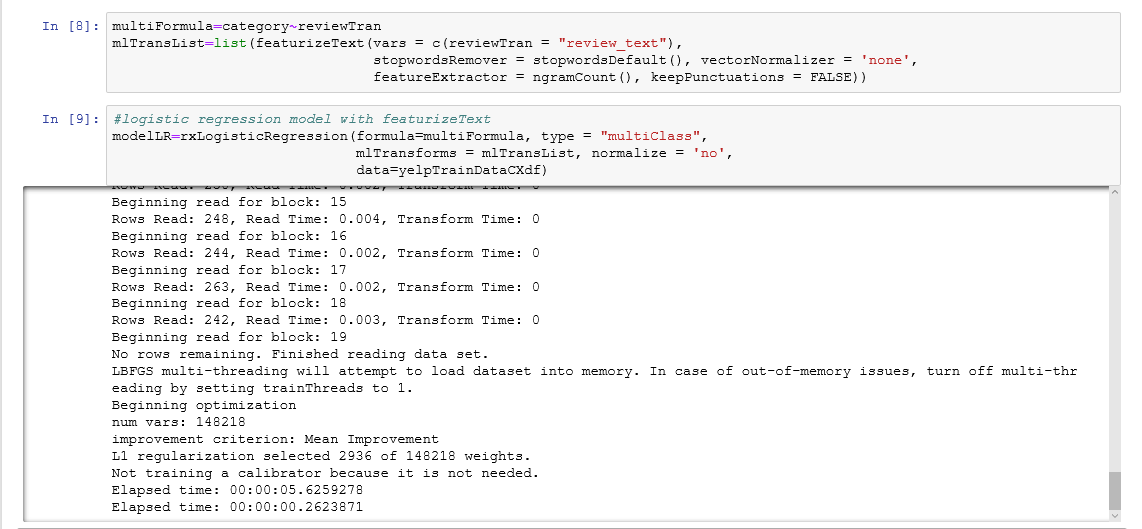
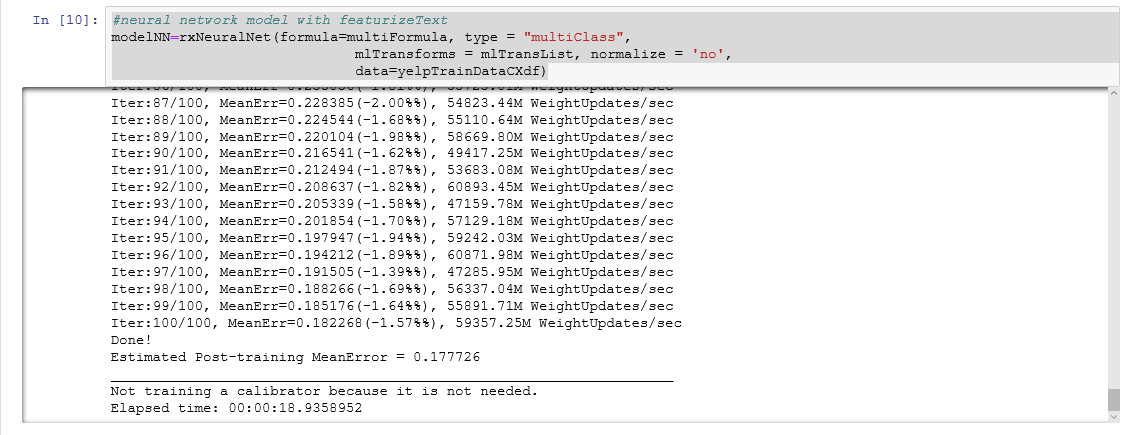
 4. Train models
Two models in the MicrosoftML package support multi-class classification: rxLogisticRegression and rxNeuralNet. We use the featurizeText tranform to automatically build n-gram features while building the model. All this is achieved in just one line of code. When deciding the "right" model to use for a particular machine learning problem, the MicrosoftML algorithm cheat sheet comes in handy.
The logistic regression model also allows us to peek into the features selected.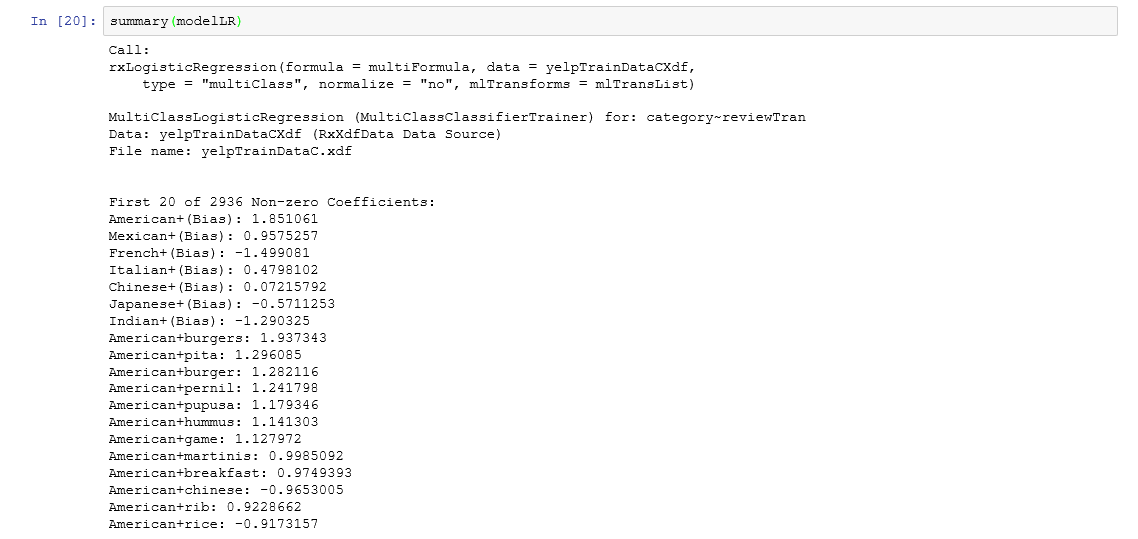
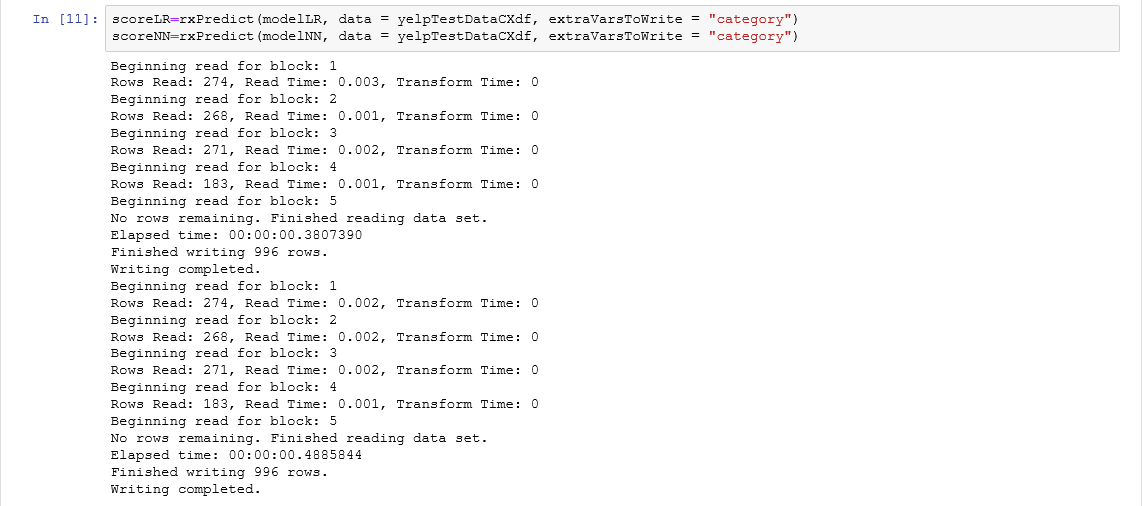
5. Make predictions
6. Draw confusion matrices
In both cross tabulation results produced below, the columns are predicted categories and the rows are actual categories. For example, the second row in the first confusion matrix, produced by the logistic regression model, says that out of all 218 actual Mexican restaurant reviews in the test set, 166 are classified as Mexican, 49 as American and 3 as Italian. Whereas for the neural network model, these numbers are 165, 50 and 3. Ideally we would want the numbers to be as concentrated on the diagonal as possible.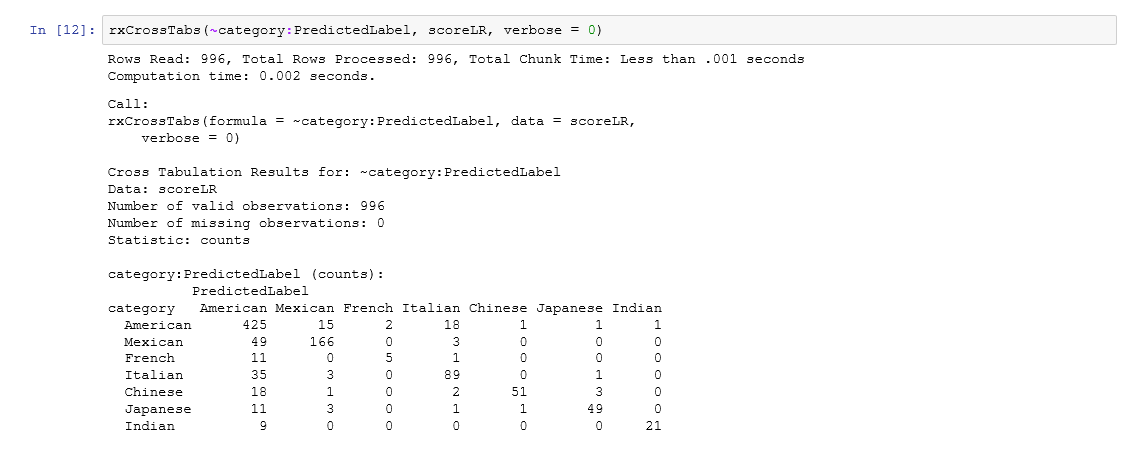
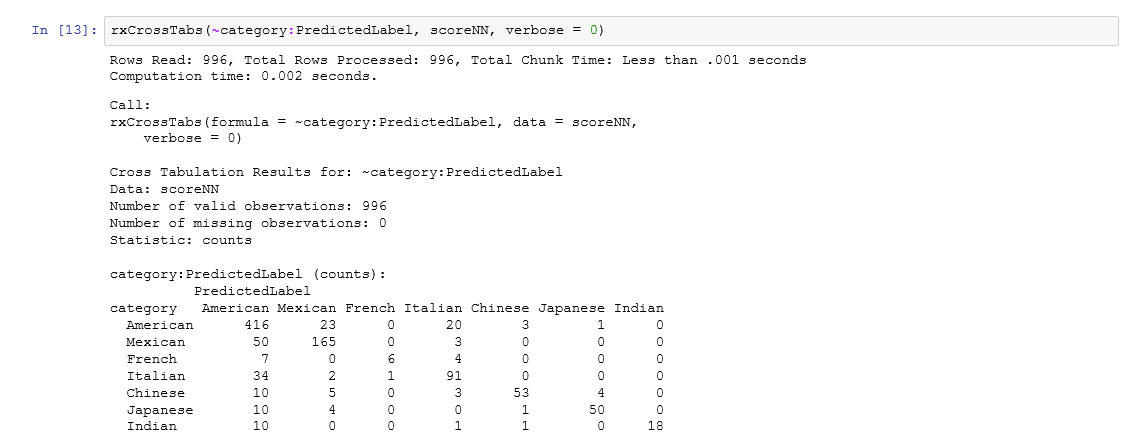
Both models performed similarly and tend to classify non-American food as American, a reason being that American is the dominant class. Also because the data set is small and we have many categories resulting in some categories having a small share of samples. But as simple off-the-shelf models, they showed promising performance.