Using Remote Profiling with Git deployments in Azure Web Apps
Editor’s note: The following post was written by Windows and Devices for Microsoft Azure MVP Aidan Casey as part of our Technical Tuesday series with support from his technical editor, Microsoft Azure MVP Mahesh Krishnan.
Remote profiling is a cool feature available for Azure Web Apps, WebJobs and API Apps. Let’s say you have deployed a .NET application to Microsoft Azure and it is misbehaving by spending longer than expected on a CPU bound operation, you can run a remote profiling session directly on your application in Azure to collect diagnostic information to help troubleshoot the problem. Remote profiling is supported directly from Visual Studio 2015 (all editions) and from the kudu ‘scm’ service site.
If you have configured Git deployments for your Web App, you’ll need to make a configuration change to build and deploy a debug version of your code before you can run a remote profiling session. By default all source code from Git deployments is compiled in Azure in release mode. Remote profiling works with the generated symbol files (pdb's) and requires your code to be built in debug mode.
I’ll take you through the steps required to configure a Git deployment for a new ASP.NET MVC application and to run a remote profiling session in Azure directly from Visual Studio.
Step 1 Install the Azure Command Line Interface and log in to you subscription
Right, let’s get started! I’m going to use the Azure Command-Line Interface (Azure CLI) to create a new Azure Web App, then I’ll deploy my code to the Web App through a git push command. You can install the Azure CLI from here. Once installed, open your favourite command-line prompt and type the following command to test it out
| azure help |
If it’s installed correctly you should see some fancy ASCII art similar to the following screenshot:
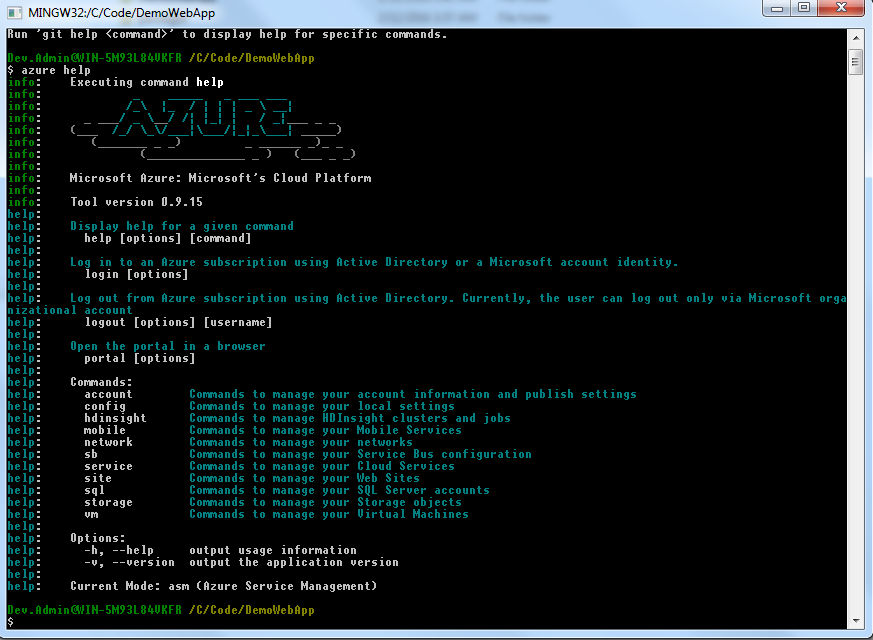
Next you need to sign in to your azure subscription from the CLI. Run the following command and follow the steps to complete the sign in process using your browser
| azure login |
Step 2 Create a new Web App for Git deployments
Next you need to create a new Azure Web App to host your code. You’ll need to have git installed locally to complete this step, if you haven’t already installed git go ahead and download git from here. Navigate to the local folder containing your .NET source code and run the following command to create a new Web App and associate it with a local git repository.
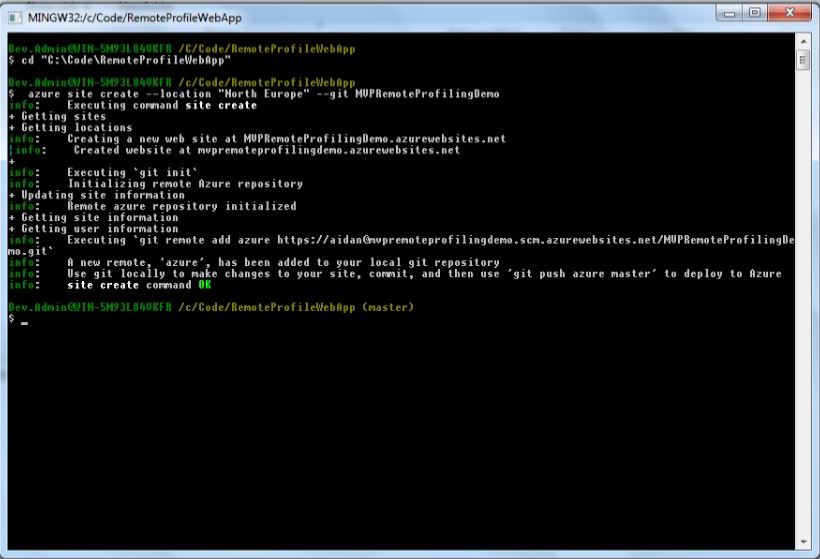
In this case my source code is in the folder "C:\Code\RemoteProfileWebApp" and the name of the Web App I want to create in Azure is called “MVPRemoteProfilingDemo”. The Web App name you pick for this step must be a unique name.
| cd "C:\Code\RemoteProfileWebApp"azure site create --location "North Europe" --git MVPRemoteProfilingDemo" |
The output from the console will look like this:
Upgrade the Web App to a Standard Service Plan
Remote profiling is not supported on free or shared sites so you need to upgrade your Web App to a standard plan. Run the following command.
| azure site scale mode standard |
Step 3 Configure a Debug Deployment of your code
One final step, before you deploy your code you need to configure a debug compile on Azure. This is done by creating a special key/value AppSetting which tells kudu (the deployment engine) to deploy a debug version of your code. Run the following command to set the debug compilation setting
| azure site appsetting add "SCM_BUILD_ARGS"="-p:Configuration=Debug" |
Step 4 Specify symbol locations and loading behaviour in Visual Studio
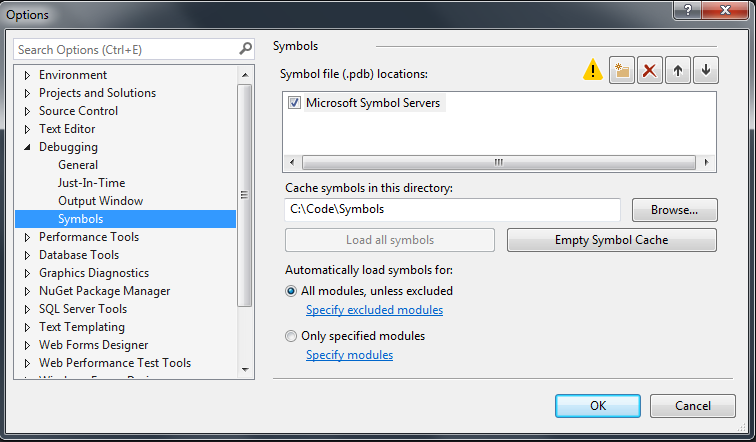
Visual Studio will only load a .pdb file for remote profiling analysis if it exactly matches the .pdb file that was created when the code was built. You need to ensure that your local copy of visual studio is configured to use the correct the.pdb files and symbols file for the code you deployed to azure.
To use the Microsoft symbol servers, choose Options and Settings on the Debug menu and then choose Symbols. Select Microsoft Symbol Servers.
Build the project locally in debug mode, then you are ready to deploy to Azure!
Step 5 Deploy your Code
When you ran the create command in step 1 a local git repository was created and with a Git remote pointing to your Azure Web App. To deploy your code to azure you now need to commit your code then push it to the Git remote.
| git add .git commit -m “Adding latest code changes” git push azure master |
You’ll be prompted to enter your deployment password. Once this command completes you should see a message in the console informing you that the deployment was successful.
Step 6 - Run a remote profiling session from Visual Studio
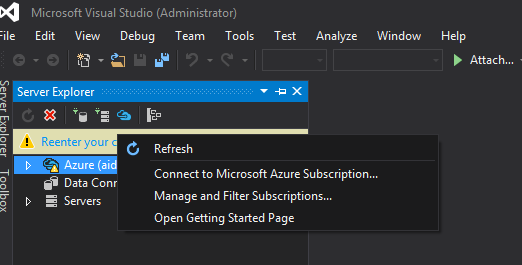
From Visual Studio open the Server Explorer Window (View -> Server Explorer), right click the Azure icon and choose “Connect to Microsoft Azure Subscription. ”
CPU sampling is a method of profiling that is not very intrusive - the profiler takes a snapshot of the call stack once per second. In most scenarios, it is fine to run a remote profiling session on your production Web App.
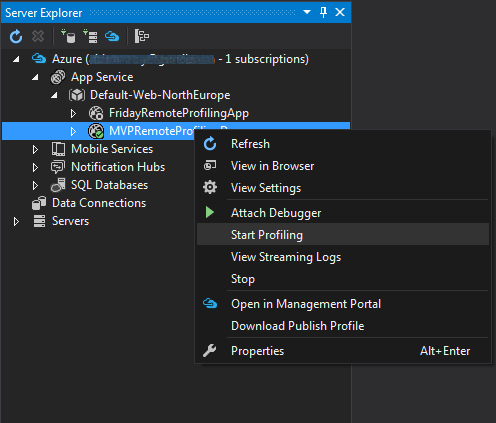
Expand the App Services Menu and find your Web App. To start a remote profiling session right click your Web App and click “Start Profiling”.
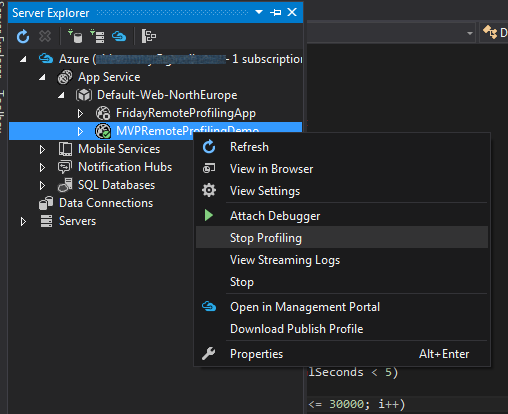
Open a browser, navigate to your site recreate the scenario that causes your Web App to run slowly. To stop the remote profiling right click your Web App in the Server Explorer Window and click “Stop Profiling”.
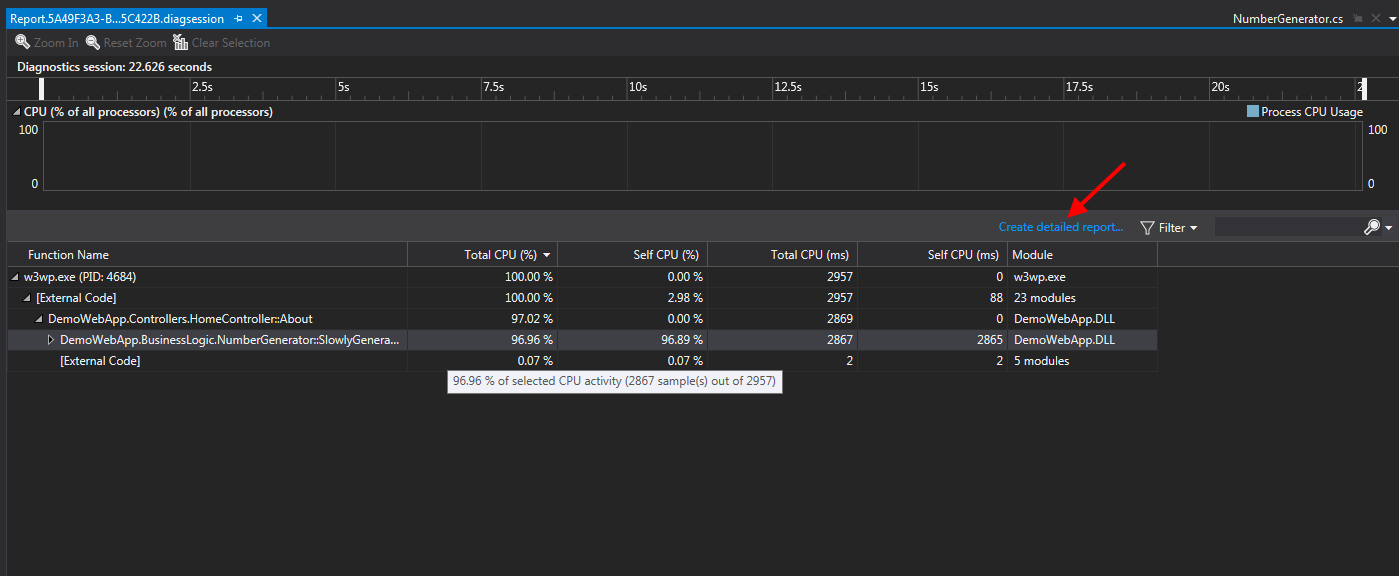
The generated profile file (.diagsession file) will open automatically in Visual Studio. In the profile report you can view the Total CPU cost for each function call, but it gets even better. Click the “Create detailed report” link for more detailed information.
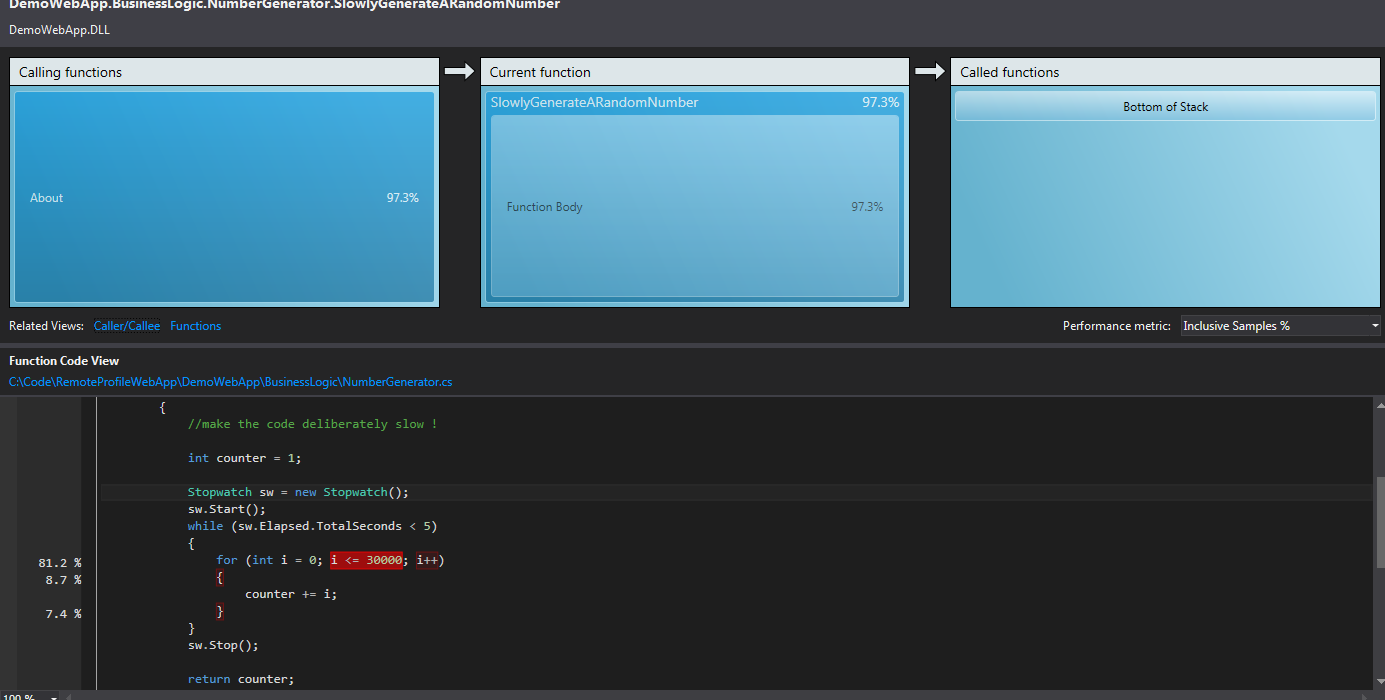
The detailed report shows you the hot paths, or most expensive calls during the profiling samples. Expanding a hot path will drill down to offending line of code and pin point the bottle necks in your code – how cool is that?

Finally a word about profiling using the Kudu REST API
It’s also possible to start and stop a remote profiling session through the Kudu API.
Through your sites “scm” endpoint (<yoursite>.scm.azurewebsites.net) you can:
- Start Profiling - POST ~/api/processes/{process id}/profile/start
- Stop Profiling – GET ~/api/processes/{process id}/profile/stop
This opens the door to some really interesting automation ideas. You could add a step to your build pipeline to run some automated UI tests and collect profiling data as part of a deployment. If the automated UI tests slow down over time you can grab the latest profile file and have a look. I bet that’s got you thinking!
Conclusion
Remote profiling is useful tool for trouble shooting CPU intensive operations in your code.
Azure Web Apps, Web Jobs and API Apps support remote profiling
Remote profiling is available from Visual Studio and through the kudu REST API
Remote Profiling is not available on free or basic plans
CPU sampling has a very low footprint and in most scenarios can be turned on in production
When deploying from Git you need to configure a debug build of your code by adding the SCM_BUILD_ARGS AppSetting to your Web App

About the Author
Aidan lives in Ireland and is a software architect who specializes in designing and building distributed cloud solutions using Microsoft and open source technologies. He can be found on Twitter @AIDANJCASEY and blogging at https://acaseyblog.wordpress.com/.