Managed Availability RCA
With the new concept “Managed Availability” in Exchange 2013 which runs on all Exchange servers for monitoring servers health, this process analyze hundreds of health metrics when something wrong happened an action will be invoked to correct this problem .
In some cases when Managed Availability perform an action to recover from an error you may need to know which health metrics “Probe” Managed Availability used to decide that Exchange component or server needs a fix.
Why you need to know that? Because you may need to stop a behavior like “system reboot” when an error occurred, you may find in some situations that it’s better to know the root cause and fix this problem by yourself instead of automatically let Managed Availability fix it.
Managed Availability
First lets overview what are the main components of Managed Availably:
- Probe engine: The Probe Engine takes measurements on the server.
- Monitoring probe engine: The Monitoring Probe Engine stores the business logic about what constitutes a healthy state. It functions like a pattern recognition engine, looking for patterns and measurements that differ from a healthy state, and then evaluating whether a component or feature is unhealthy.
- Responder engine: When the Responder Engine is alerted about an unhealthy component, its first action is to try to recover that component. Managed availability enables multi-stage recovery actions. The first attempt may be to restart the application pool, the second attempt may be to restart the corresponding service, and the third attempt may be to restart the server. And, the final attempt may be to put the server offline, so that it no longer accepts traffic. If all of these actions fail, an alert is sent to the help desk.
All above are controlled by the Exchange Health Manager Service (MSExchangeHMHost.exe) and the Exchange Health Manager Worker process (MSExchangeHMWorker.exe)
The relationship between these components is like
Probes (monitor and when fails occur) --> Monitor status change --> Responder takes action
So to find the root cause and why a responder invoked a specific actions we will go in the reverse way
Responder takes action --> which monitor? --> Find the failing probe.
For Example: Use the following command to get all windows events for responder that forced your server to reboot.
The output will be like this:
(Get-WinEvent -LogName Microsoft-Exchange-ManagedAvailability/* | % {[XML]$_.toXml()}).event.userData.eventXml| ?{$_.ActionID -like " *ForceReboot* "} | ft id,RequestorName,Endtime,result -AutoSize |

In this case, the bug check was initiated by the ActiveDirectoryConnectivityConfigDCServerReboot
Now let’s get more details about this Responder
(Get-WinEvent -LogName Microsoft-Exchange-ActiveMonitoring/responderdefinition | % {[XML]$_.toXml()}).event.userData.eventXml | ?{$_.Name -like "ActiveDirectoryConnectivityConfigDCServerReboot"} | ft ServiceName,Name,Alertmask |
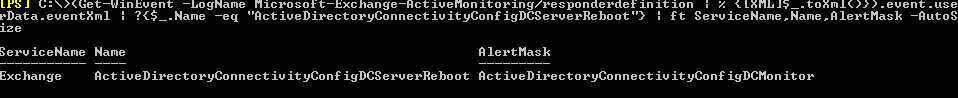
The AlertMask show which Probe used by the ActiveDirectoryConnectivityConfigDCServerReboot Responder.
A repetitive failed probe causes a Monitor change and a recovery action is invoked. The details of the failing Probe is going to provide information about the exact failure.
Now we need to dig inside the Windows Events to get a Failed probe and check the error message associated with.
[PS] C:\>(Get-WinEvent -LogName Microsoft-Exchange-ActiveMonitoring/ProbeResult | % {[XML]$_.toXml()}).event.userData.eventXml | ?{($_.ResultType -eq 4) -and ($_.ResultName -like "* ActiveDirectoryConnectivityConfigDCProbe*")} |
The Result may show you an error like
<Error>Received a referral to contoso.com when requesting DC=contoso,DC=com from dc1.child.contoso.com. You have specified the wrong server for this operation. Filter = (&(objectClass=\2a)(!(msExchCU=*))).</Error>
Now what! Now You know why this Probe failed and made a corresponding responder to restart your server .what you can do now is to stop this responder till you fix this issue if it going to take much time .
This Responder is temporary disabled by adding a GlobalMonitoringOverride
Add-GlobalMonitoringOverride -Identity Exchange\ActiveDirectoryConnectivityConfigDCServerReboot -ItemType Responder -PropertyName Enabled -PropertyValue 0 -Duration 10.00:00:00 |
Important: The main focus should be to analyze and resolve the main issue that is causing the Probe failure. If you decide to disable the responder, be aware that you are preventing Exchange from taking automated recovery actions for any monitors that call this responder. The Responder should be disabled only if the Responder’s actions are causing serious outages and fixing the main issue is going to take a significant amount of time.
Later you can enable this Responder by removing the GlobalMonitoringOverride
Remove-GlobalMonitoringOverride -Identity Exchange\ActiveDirectoryConnectivityConfigDCServerReboot -ItemType Responder -PropertyName Enabled |
Mohamed Dawy from PFE Egypt team.