Troubleshooting in SQL Server Transactional Replication on *very* busy Subscribers + WindDbg + WPR & WPA
Hello again!
Moving forward to the subject, I worked in a specific situation where replication latency increased above acceptable values, scenario was the following bellow:
- Publisher to Distributor | Log Reader Delivery Latency = Ok
- Distributer to Subscriber | Distributor Delivery Latency = Nok
- MSdistribution_history was throwing state 2 messages (distrib agent reader thread waits on writer thread )
- REPL Stored Procedures *sp_MSins/upd/del_*** where executing fast (at the microsecond scale)
At this point I had all the evidences of the issue being indeed writing to the subscriber but the replication stored procedures were executing fast at the subscriber and the volume of data being replicated hadn't exponentially changed!
So... I was intrigued about this... Basically replication was telling me that sql server engine was too slow but sql server was telling me it was executing its stuff fast enough.
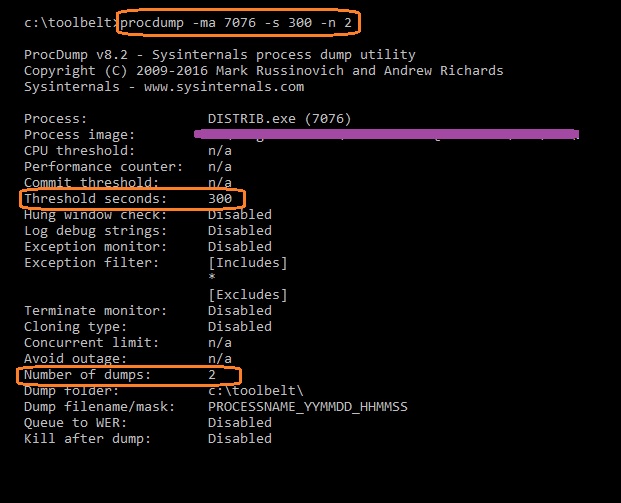
Well... Lets take full memory dump of DISTRIB.exe and check see if there is anything interesting to find, just took 2 dumps using procdump with 5 minutes delay between them:
Looking at the debugger, analyzing the dump, an exercise has to be be done to guess the functionality of the functions based on its name (ok... I have to admit, I miss this part of having source code access and private symbols back when I was at Microsoft to better troubleshoot, but... It can still be done using the public symbols to a certain degree of correctness)
One of the first things I do while analyzing dumps is to use "!runaway", "!runaway 2" and "!runaway 4", between the 2 dumps. The main idea is to analyze the delta of user time and kernel time for each thread and see if anything looks wrong.
Nothing looked wrong in this 5 minutes delta, i can see that thread 0, 5 and 6 had work to do, with more weight for thread 0 and 6, well, this a sign they are working.
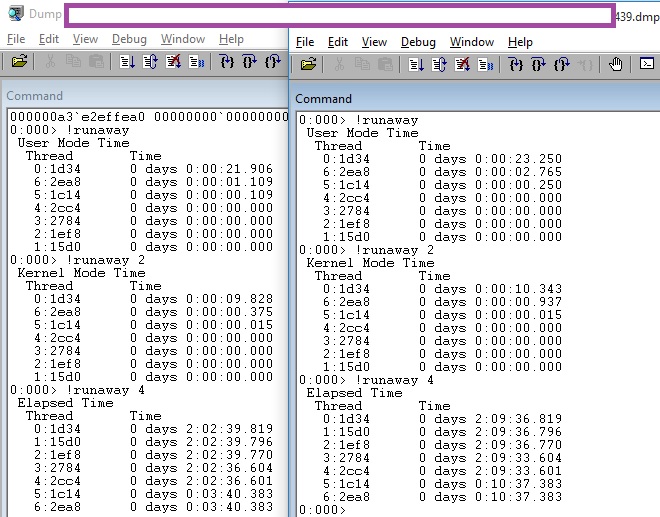
Lets check what is this thread 0 and 6, since this are the ones that had higher User Mode Time and Kernel Mode Time.
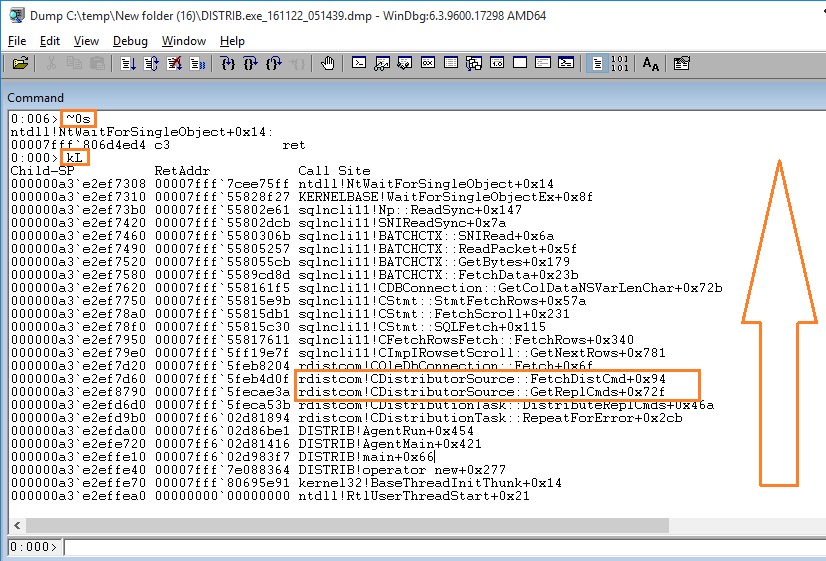
Thread 0, is likely related with the reader thread - sp_MSget_repl_commands that pulls data from the distribution database and stores them in an internal queue. The call stack looks good.
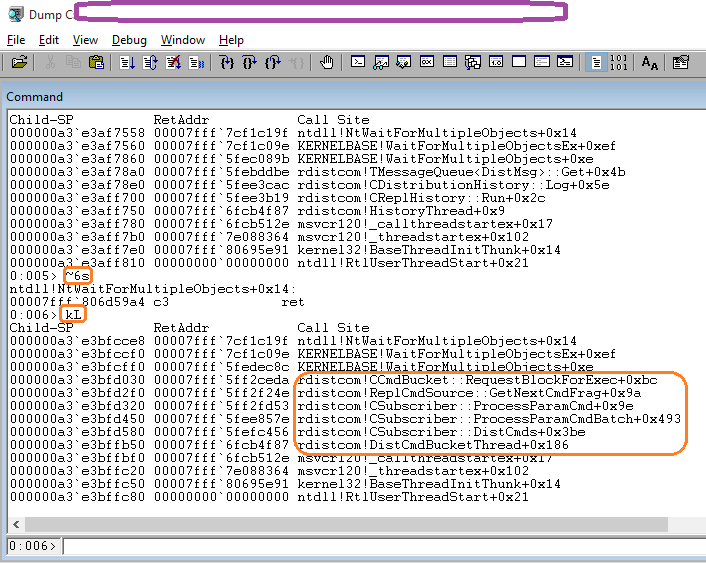
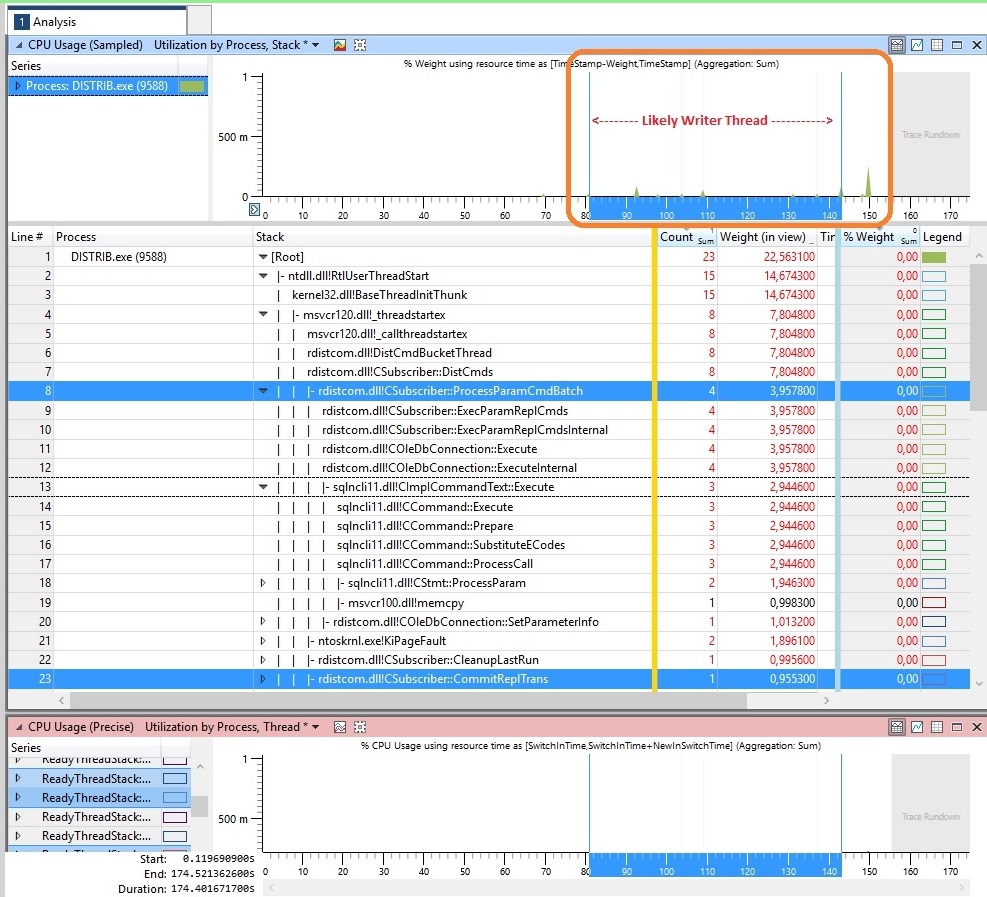
Going for Thread 6, this is likely related with the writer thread, basically running the sp_MSIns/Upd/Del in the subscriber database (writing queued commands). The call stack looks good.
So at this stage, I can't see any issue with the Distrib.exe (calls rdistcom.dll) process and can't also see any issue with the duration of the Replication stored procedures butwhile I was analyzing dm_exec_procedure_stats I noticed that the cached time vs last execution time was almost the same! This triggered the investigation to classic "plan cache internals" mode and it was quickly found memory pressure. In this case custom replication stored procedures are being used and although the logic is reduced to a minimum,it takes too much time to compile (sys.dm_exec_cached_plans is your friend here, use it and look for the compile time.
Compile time > 1.000.000 microseconds 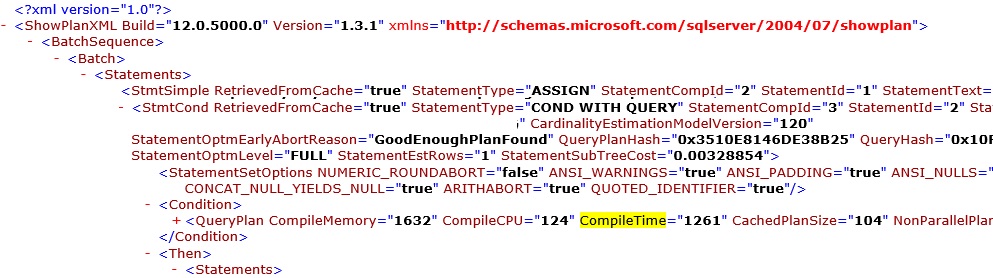
Execution time < 100 microseconds 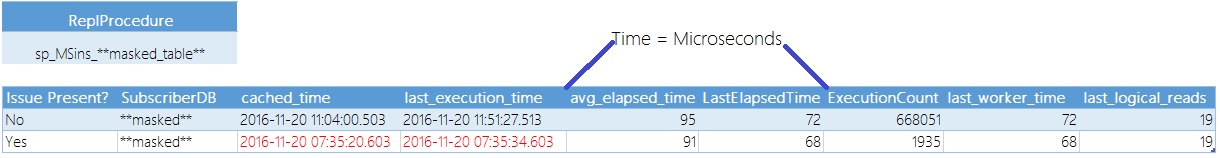
Well, there are already many blogs and official Microsoft documentation about plan cache internals and memory pressure and also replication troubleshooting.
Driven my curiosity, ran a WPR @ TEST ENV, just to see how would a writer thread latency look like under WPA, here it is bellow (basically modified repl procedures by adding a waitfor delay to simulate a slow procedure execution):
The resolution for this situation was around changing memory parameters to cover a very specific scenario.
Hope you find this reading interesting.
All the best!
Paulo Condeça.