System Center .NET Application Alerts vs Events
Formulating a process to solve production application issues quickly requires a well thought out process for alerting, triaging and diagnosis issues. Whether you currently use System Center Operations Manager now or not these are still the same three buckets used to help develop a process. The eventual goal in the process should be to automate as much of the resolution process as possible but that is beyond the scope of this article, here I simply want to discuss what an APM Alert is versus what an APM Event is. Each has a place in the problem resolution process and certainly they are related and interconnected in many ways. It’s easiest to understand alerts for those familiar with Operations Manager but of course not everyone is, and in most cases events are also not well understood.
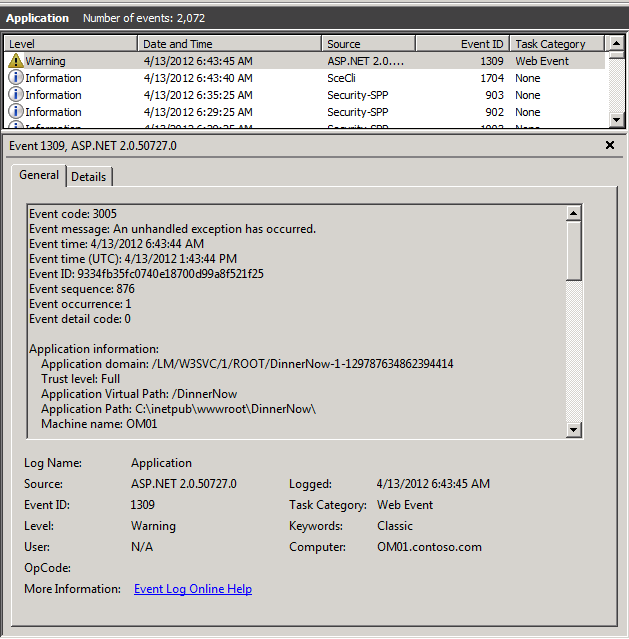
So to set up the conversation it’s probably worth a quick review of APM in general. I usually start explaining that APM is simply automating the process of instrumenting .NET code with performance timings and exception collections. Doing something that developers would, and in some case have done to applications if given enough time and budget to do so. A bigger challenge is that if this has been done what to do with the data and did they create a method to understand this data by all the team members that need to know. In many cases it has then been left up to the operations team to filter and collect in Operations Manager via custom built Management Packs the data that is important to them and create alerts accordingly. In addition it hasn’t always included enough root cause details to solve problems are even steer diagnostics better to speed resolution. How many of us have seen event logs get over populated with events we not only don’t understand fully but tend to ignore because of the flood of information is too much. APM is much more than this but for the Alerts versus Events conversations this is enough to get use started. Let’s look at events; these are simply the detailed collection of application specific performance problems and exception events in the code. You tell the monitoring template to collect an event when the performance exceeds X milliseconds and in doing so it will include details about the performance challenge inside the event. You can also tell the template to collect exception events or what we call application failures in the code based on whether they are considered critical or not. Again depending on configurations this will include some level of detail about the code exception including parameters if so desired. Like a developer logging their own performance problems and exception events into an event log or their own database APM logs these events in an easy to use web based console for further analysis and use. But a single slow page or code failure doesn’t always mean an availability problem is arising so these events might not always create alerts. To highlight the difference here is an event log entry created by the developer of a web based application when rendering a shopping cart failed. Below is the APM event collected for the exact same failure being rendered from the AppDiagnostics console. You can see a fairly different approach to rendering the data with some similarities. The detail collected in the APM can be controlled and is collected without rewriting code, and it doesn’t rely on the developer to create the event or do anything.
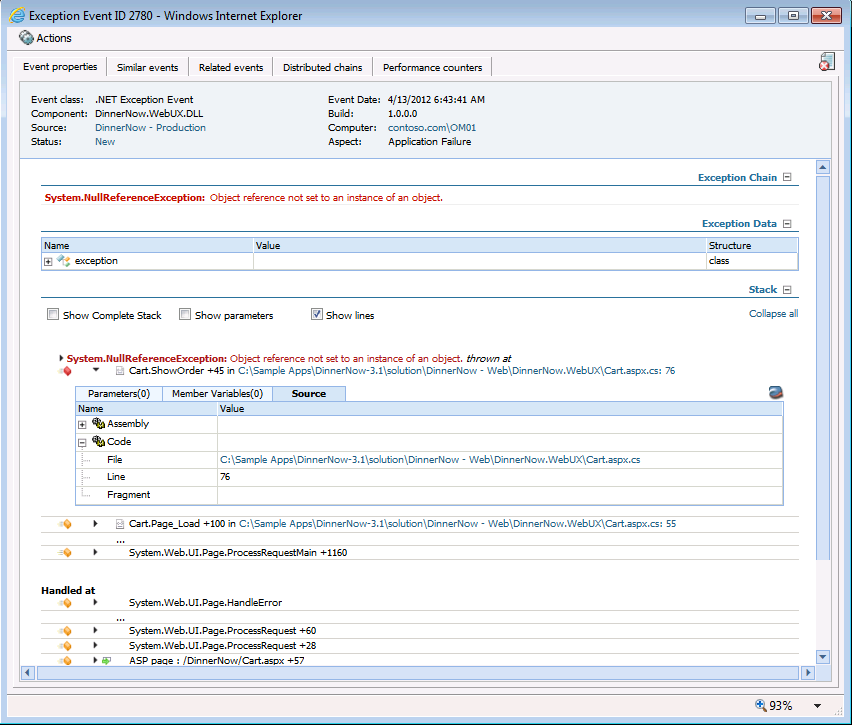
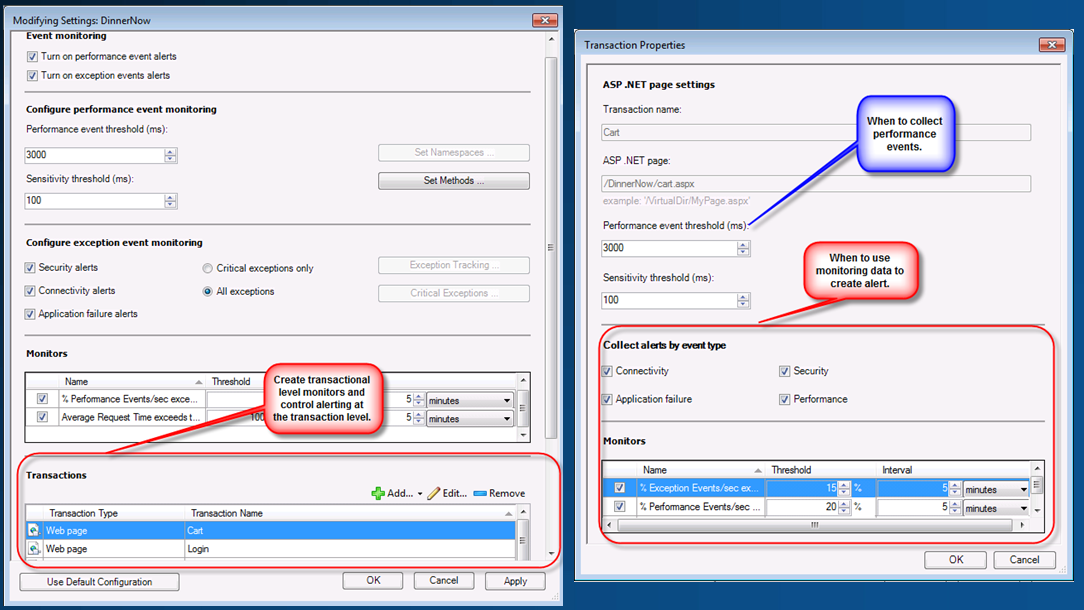
So this actually is a great example of a developer collecting and the automated collection from Operations Manager APM. But now how and why would we alert on this event. First a couple of things around application failures that is worth noting. First is that APM will distinguish between different types of exceptions in the code and categorize them with what is referred to as Aspects. This error for example is not Connection related or Security related which are 2 of the aspects we distinguish so the event gets the aspect of ‘Application Failure’. This is important since we can alert differently based on this aspect. As an example operations personnel should almost always be alerted when security in a database changes, this may cause the applications database commands to fail for security reasons like not able to insert permissions. When creating an APM monitoring template we can distinguish between creating individual event alerts or only based on aspect of failure or event quantities and increases in percentage of events.
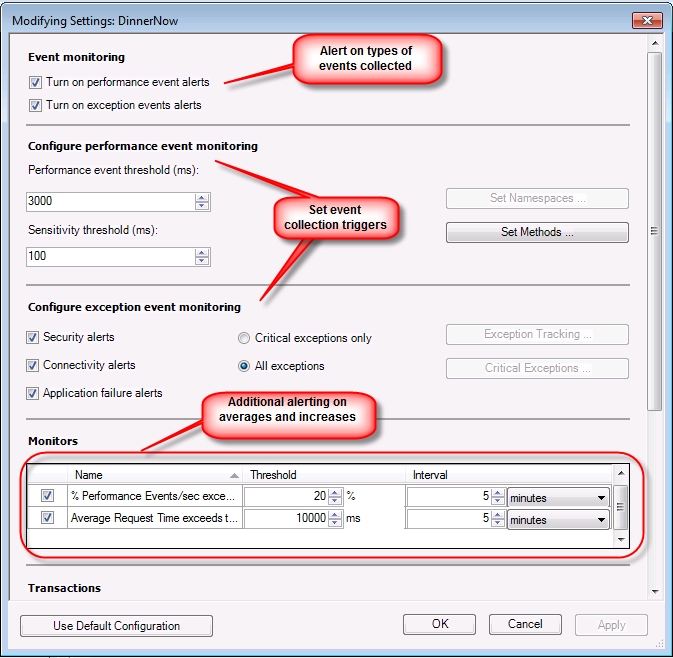
As you can see we have options as to what and to what depth to collect events but also how to use these events in alerting. We can even go to the level of transactions which simply base similar event collection and alerting on specific web pages or code functions. For example don’t trigger alerts on application failures at the site level but do trigger them for the cart page. At this point we can monitor for alerting the number of events and base an overall alert for the percent of increase since a large number of failures impacts performances. So why would you set this up this way? Imagine a public site that changes regularly which is cataloged by a search engine. The search engine would regularly refresh content by retrying the urls in its database, and the site may no longer have the url. This will actually cause a .NET exception at the site level for ‘File not found’ which is an aspect of application failure. We don’t need an alert for ‘File not found’ at the site level, which could be hundreds or thousands. At this point count and track them and alert if they drastically increase in a time interval. So disabling alerting on application failure at the site level prevents this potential flood of data but then what about the ‘applications failures we care about. We do this by adding transactions and configuring alerts for application failures at that level. So now cart.aspx is a transaction, it can’t get 404 file not found type failures because it is a page and now any aspect of application failure is important so create the alert.