Microsoft SQL Server 2008 R2 Utility Control Point – Multi Server Management
Microsoft SQL Server 2008 R2 Utility Control Point – Multi Server Management
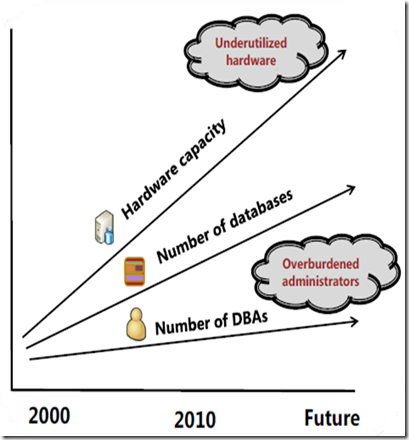
In today’s world most challenging question for SQL Server DBA is how to monitor our database environment
Ø Hundreds of databases
Ø Most databases have a single Database File and one Transaction Log file
Ø CPU and Storage is a major pain area in our landscape
Ø In some cases, the hardware is over utilized and in some cases it is under utilized
Ø Sudden changes are surprises and flooded with alerts
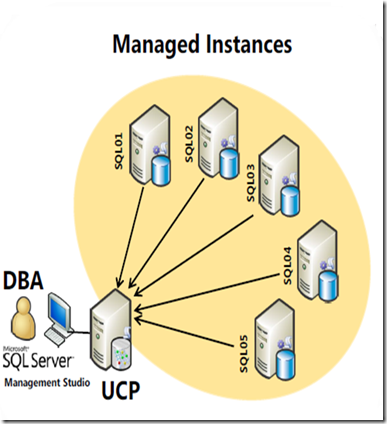
Utility Control point surfaces our need as database administrator which is a new feature in SQL Server 2008 R2. These are the actions that can be performed using UCP.
Ø Central Point of reasoning for Multi-Server Management – Daily Health Check
Ø Meaningful Dashboard to provide insight into utilization of CPU and Storage – Proactive Maintenance
Ø Drill-down reports to identify disk utilization up to file level
Ø Analysis of CPU utilization over a given period (Day, Week, Month and Year)
Ø Capacity Planning
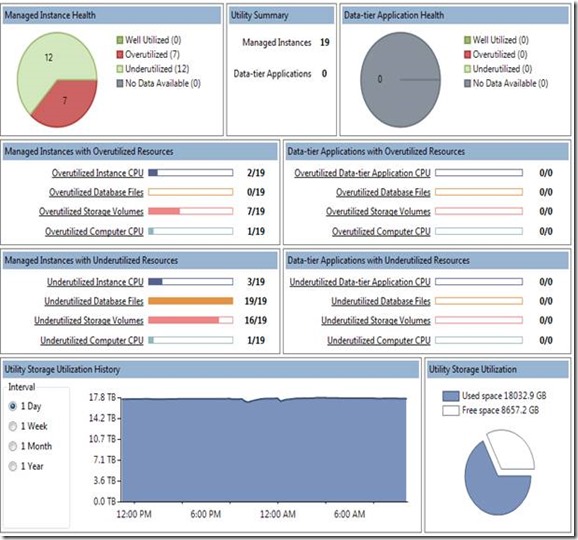
This is the overview of the UCP dashboard , which tells me in our environment 7 instances are over utilized out of 19 instances
Ø Managed Instances indicates the number of instances are getting managed through UCP maximum is 25
Ø It also describes well utilized,over utilized,under utilized and no data available.
Ø we can still drill down to the instance level.
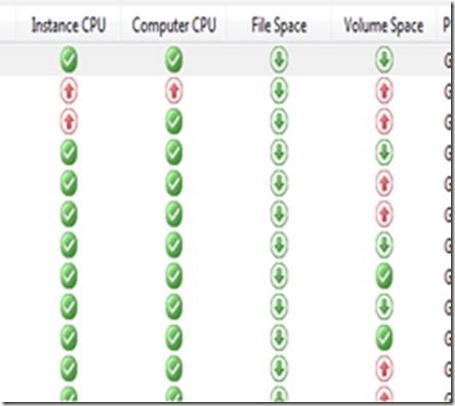
Managed Instances - CPU Utilization
For each Instance we can have the data for the below points
Ø Instance CPU
Ø Computer CPU
Ø File Space
Ø Volume Space
Ø Policy Type
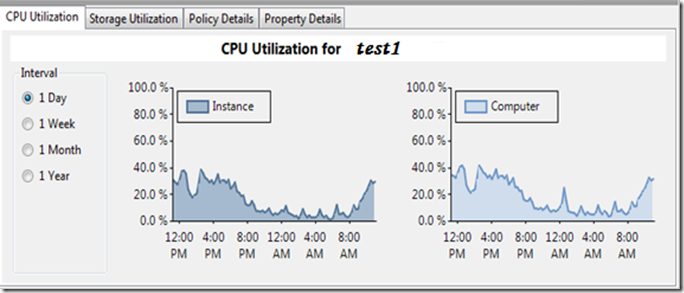
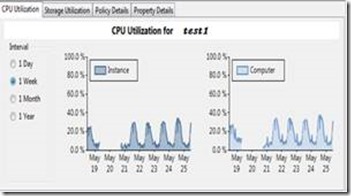
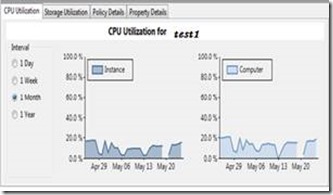
2. CPU utilization graph describes the utilization of CPU for Instance and Server. Also we can have daily, weekly, monthly and year wise data and identify the trends
Red Arrow indicates that the server is over utilized based on the policy defined.
Please see the below screen shots from which we can identify the trend for the SQL instance test1
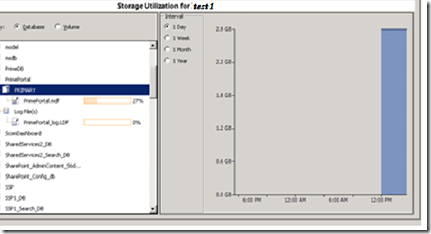
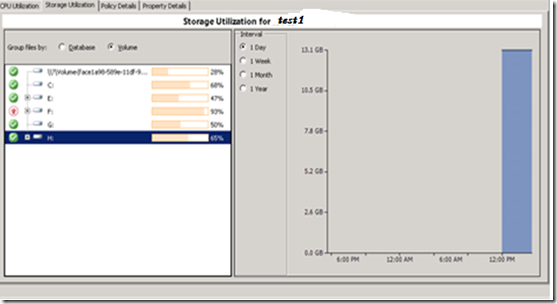
Managed Instances - Storage Utilization Per Database
1.For each Instance we can have the data for the below points
Ø Storage Utilization per Database
Ø Storage utilization per drive
2.Storage utilization graph describes the utilization of Space for Instance and Server.
3. this also includes if you have any mounted volumes on the server
The figure shows the utilization per database including the database file
Ø Storage utilization details for all the drives is listed in percentage.
Ø We can get the data per day, week, month and year.
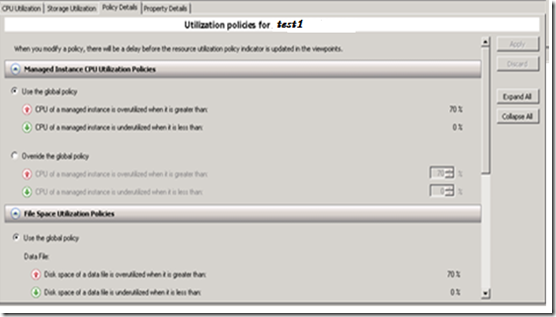
UCP-Utilization Policies
Ø Global policies are defined for disk and CPU utilization.
Ø As per global policy > 70% is over utilized.
Ø We can override the global policies by defining the utilization limits.
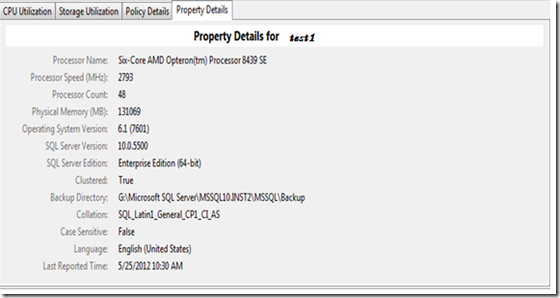
Property Details for Managed Instance
UCP also provide the property details of the managed instances.
Ø Processor Name
Ø No of Processors
Ø Is clustered
Ø OS Version
Ø SQL Version
Ø SQL server Edition
Ø Collation
Ø Case Sensitive
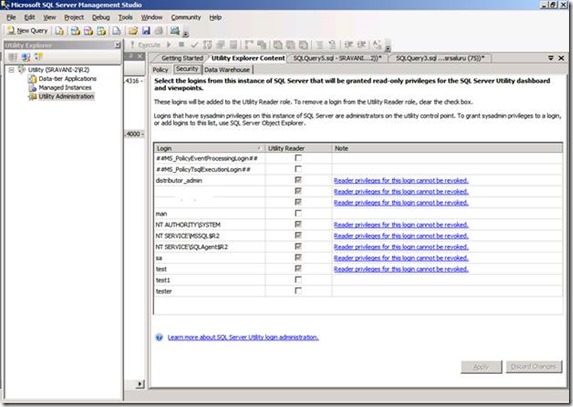
Ok now who are all can administer the UCP dashboard , well we do have permissions settings which DBA can control. All sysadmin accounts will act as administrators
in UCP and we can grant read permissions to specific logins who can look at the dash board and monitor the server
Well we are done , now we know that we can use UCP to monitor all the servers in our environment from one single dashboard. Also I can create multiple UCP instances and use it for Dev , test and production environments.
