Testing a Team Services extension and tracking code coverage
Jasmine is a framework that allows you to write tests in JavaScript for AngularJs or NodeJs applications. In our case, we will use Jasmine to write tests for VSTS extension.
Implementing Jasmine on an Extension Project
The Jasmine Framework is a Jasmine.js library. To retrieve it, we have two possibilities, either with a package Nuget or with an npm package.
In case the extension is developed with Visual Studio, we retrieve the Chutzpah package with Nuget that contains jasmine and its test adapter.

With Visual Studio Code (or with another IDE), we can retrieve this framework with npm with the command.
npm install --save-dev jasmine
If you are using Josh Garverick’s Visual Studio Project Templates, all components required to run Jasmine tests are already included in the npm packages configured in the "packages.json" file.

Write your unit tests for your extension
Writing a Jasmine unit test is fairly simple. The Project Template has an example in the test folder in the "testSpec.js" file.
Here is another example:

Run your tests in Visual Studio or Visual Studio Code
In Visual Studio
There are several ways to run Jasmine unit tests. With Visual Studio, you can use a test adapter like Chutzpah, which is one of the best known. It is installed with Nuget by retrieving the latest version of the Chutzpah package.
Next, to be able to visualize and execute the tests in the Visual Studio Test Explorer, install an extension to Visual Studio called Chutzpah Test Adapter for the Test Explorer. Additionally, install the Chutzpah Test Runner Context Menu Extension to be able to execute tests from the contextual menu.

Once installed, the tests appear in the explorer test, and they can be run as unit tests.

In Visual Studio Code
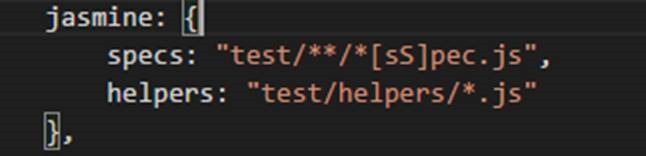
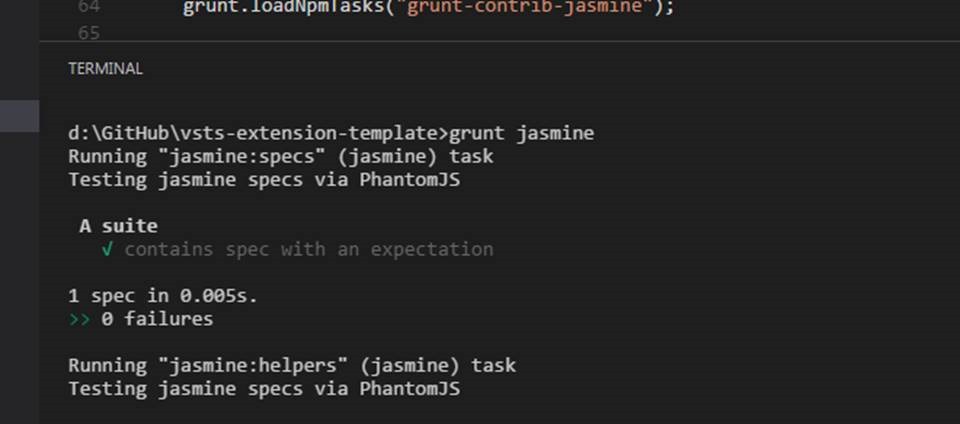
You can use the grunt-contrib-jasmine grunt already existing in the template, and in the "gruntfile.js" file have the jasmine task.

Run grunt jasmine

Chutzpah file configuration : Chutzpah.json
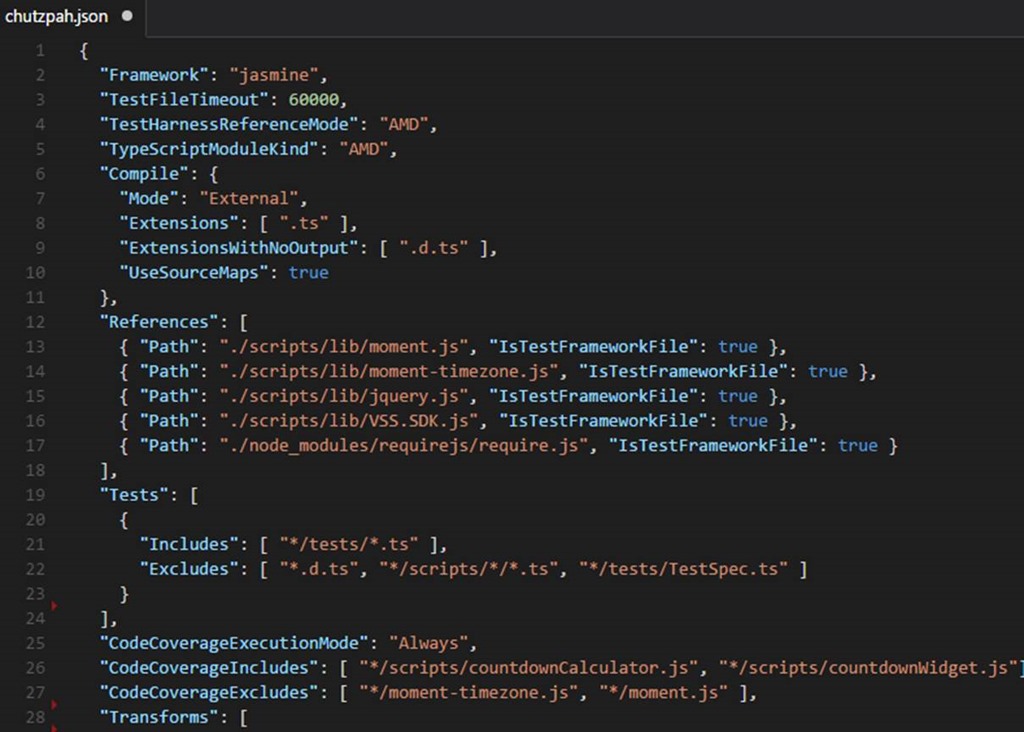
To be able to set Chutzpah parameters, we add a configuration file json (at the root of the project) named "Chutzpah.json". Inside, we specify the file of specs to be executed, the mode of compilation of the typescript files, and the parameters of execution of the code coverage.

For all details on this file, see https://github.com/mmanela/chutzpah/wiki/Chutzpah.json-Settings-File
Running tests as part of Continuous Integration (CI)
IMPORTANT - The following section contains paths as part of the configuration. These are solution-specific and likely to differ in your environment. Use the screenshots and examples as reference only!
To run the JavaScript tests in a build of Continuous Integration in VSTS, add the Test Assemblies task to your build definition.

Set parameters
- Execution Options - The tests path and pattern.
- Advanced Execution Options - The root of test adapter : the packages folder where the Nuggets packages, including the Chutzpah package, are downloaded.
After the build, the results of the tests are obtained in the Summary tab.

And the details on the tests tab.

Code coverage analyse
Enabled the code coverage
The code coverage indicators provide an indication (in percentage) of the number of lines covered by the tests.
One of the advantages of Chutzpah is that it allows this analysis and generates a report during the tests execution.
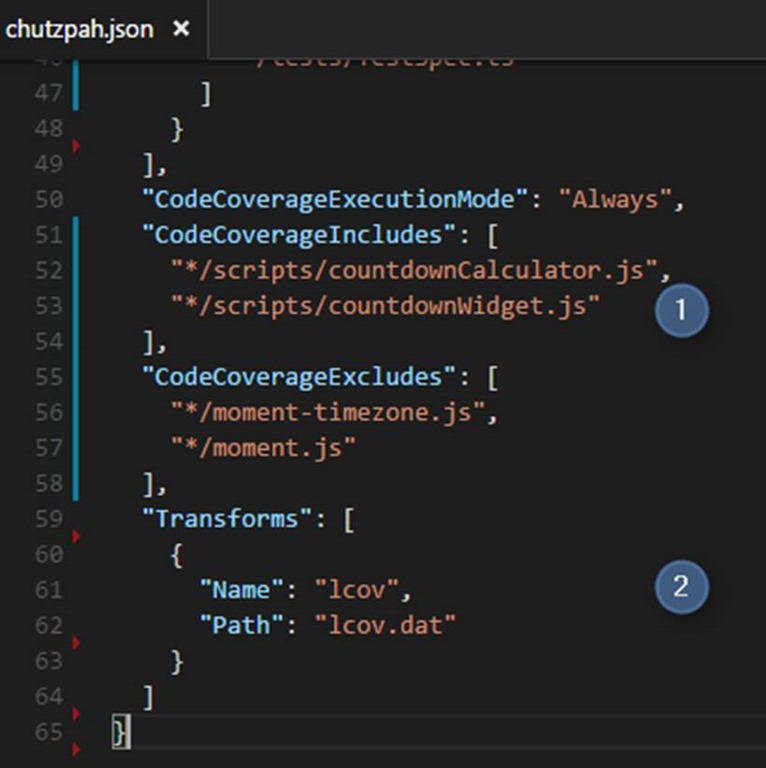
To activate it, add the parameters in the configuration file of chutzpah.

- Enable the code coverage analysis and the files to includes and excludes.
- Specify the file type for the analysis result; in our case, we will choose the lcov format.
Executing the code coverage analysis during CI build
With this configuration, the code coverage analysis will be done automatically at the same time that the tests will be executed, so there is nothing more to configure in the build.
After the build runs, the result of the analysis is visible in the summary tab.

Publish and view the detailed analysis report
Having this percentage is a good indication, but it's better to have a detailed report that indicates on each file the lines that are not covered by the tests in order to improve them.
In the result of the VSTS builds, the code coverage tab allows you to display this report, which is in the Jacoco or Cobertura format.
The problem we have is that the report generated by Chutzpah is in lcov format, so in the build execution convert this report into a report summary of type Cobertura, then, in html format, and, finally, publish this report.
- The first step is to convert the file "lcov.dat" obtained during the execution of the tests in "Cobertura.xml" format. This conversion is done with a Python script that is available here. Add this script into the repository, and execute it during the build with a Command Line task.


Example:
$(Build.SourcesDirectory)\CountdownWidget\lcov_cobertura.py $(Build.SourcesDirectory)\CountdownWidget\CountdownWidget\lcov.dat --output $(Build.BinariesDirectory)\Cobertura.xml
- It is necessary to generate a report in html format from the "Cobertura.xml" using the tool ReportGenerator which is obtained in a package Nuget (included in our project), available here.


Examples:
$(Build.SourcesDirectory)/CountdownWidget/packages/ReportGenerator.2.5.1/tools/ReportGenerator.exe
-reports:$(Build.BinariesDirectory)\Cobertura.xml -targetdir:$(Build.BinariesDirectory)\reports -reporttypes:Html;Xml;XmlSummary
- The last step is to publish the report generated by ReportGenerator by using the Publish Code coverage result task.


Examples:
$(Build.BinariesDirectory)/Cobertura.xml
$(Build.BinariesDirectory)/reports
Once the build is running, you get the report in the Code Coverage tab.

Checklist
- Add Jasmine to your project
- Add and validate unit tests
- Add and configure Test Assemblies task to your CI build
- Configure Chutzpah configuration to enable code coverage
- Publish code coverage results