Understanding IntelliTrace Part VI: Working with IntelliTrace Logs
This is a multi-part series, you can find the other parts here:
Understanding IntelliTrace Part I: What the @#$% is IntelliTrace?
Understanding IntelliTrace Part II: Where Do I Use IntelliTrace?
Understanding IntelliTrace Part III: IntelliTrace Events
Understanding IntelliTrace Part IV: IntelliTrace Calls
Understanding IntelliTrace Part V: Advanced IntelliTrace Settings
I want to give a special thanks to my friends on the IntelliTrace team for helping with this post. Specifically, Larry Guger, Tim Varcak, and Colin Thomsen. You guys rock! :)
Now on with the blog goodness…
Recall in the previous post I showed you how to turn on logging and covered the things you need to consider when choosing the log size. In this post the goal is to actually see what to do with a log file once you have it. This is critical to your success regardless where the log file comes from. So let’s create a log file and review what you can expect. As a reminder we are using the Brian Keller Virtual Machine if you want to do these examples in a safe environment.
Log File Format
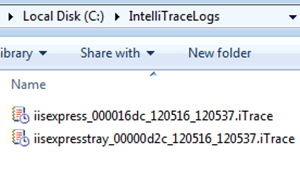
Create a log file by turning on logging (Part V) and collecting Events and Calls information (Part IV) for the TailSpin toys application. This will result in a log file entries that like this:
These log files are binary files that contain our IntelliTrace data. You will need Visual Studio Ultimate in order to examine the contents of these files. I like this example because it shows some of the extraneous information you may get when logging. In this case we used Visual Studio to test our application which caused the app to be loaded into IIS Express. An interesting thing about IIS Express is it comes with a system tray icon:
IntelliTrace collects information from the system tray application as well as the information we are actually interested in from IIS Express. Feel free to open and explore the express tray log later on if you want but there is really nothing in there. For now, take a look at the iisexpress file. First of all notice the file name structure. There are are four distinct parts that come into play with the log names that have the ITRACE extension. Breaking down the filename we can see what each piece means:
| Section | Description |
| iisexpress | Process captured |
| 000016dc | Value to uniquely identify the file |
| 120516 | Date of the capture started (YYMMDD) |
| 120537 | Time capture started (HHMMSS) |
You may notice a slight time gap (usually a few seconds) between the timestamp in the filename and the time of the first entry in the IntelliTrace log. This is expected behavior so just be aware of the difference.
Log File Contents
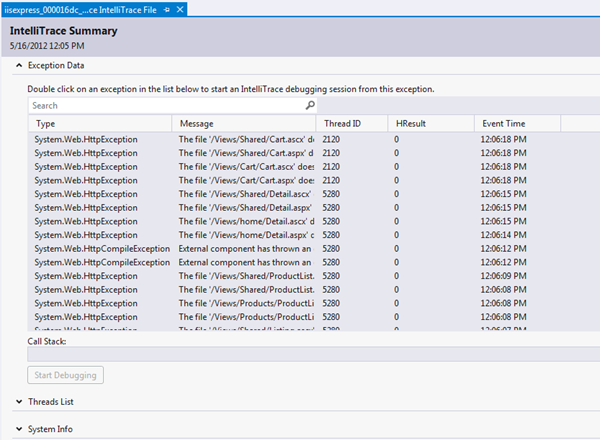
The real magic happens when you open the file in Visual Studio Ultimate. Double-click your capture and you should see something like this:
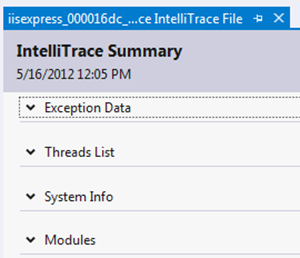
There are four sections to this file and each section can be collapsed (or expanded) by clicking the arrow to the left of each section name. Go ahead and collapse the Exception Data section now and we will review each of the sections in turn from bottom to top:
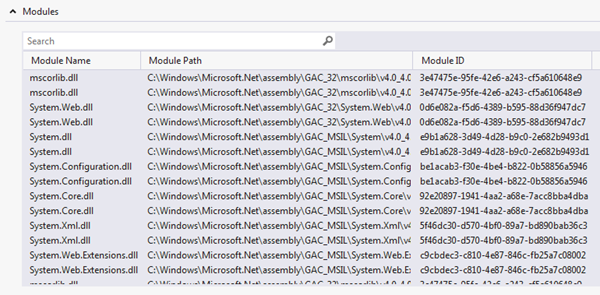
Modules
The Modules section lists out all the currently loaded .NET Assemblies at the time of capture:
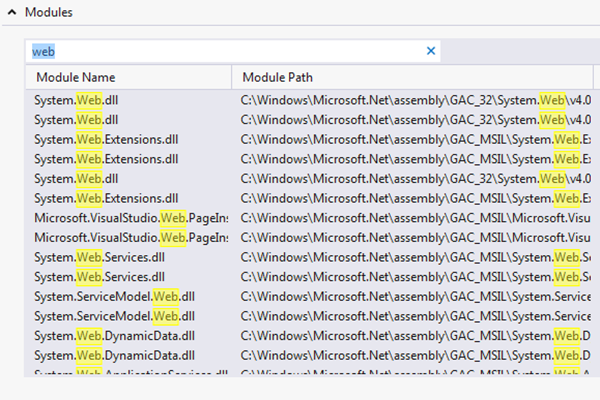
Every section has its own search area where you can filter the results looking for specific entries:
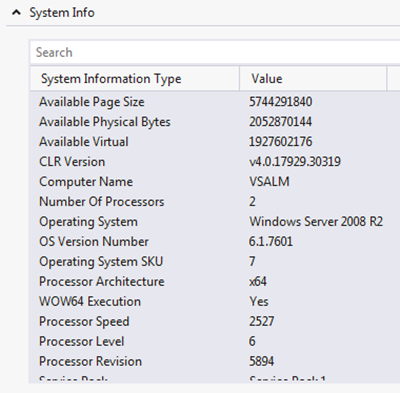
System Info
This section contains detailed information about the environment the capture took place in. It deals with the major areas where we might find issues due to environmental problems:
Threads List
Pretty self-explanatory, this section lists out the assembly threads active at the time of capture: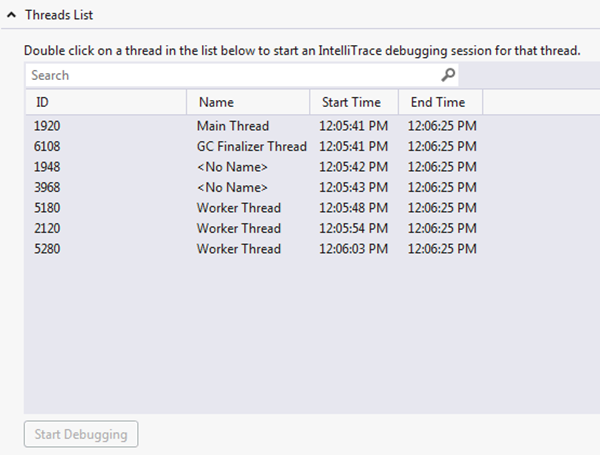
Using this section you can filter calls by thread:
Additionally, this section is one of two that allows you to actually pull up the Events and Call information in the IntelliTrace window. You can get there by either double-clicking an entry or selecting an entry and clicking the Start Debugging button at the bottom of the section.
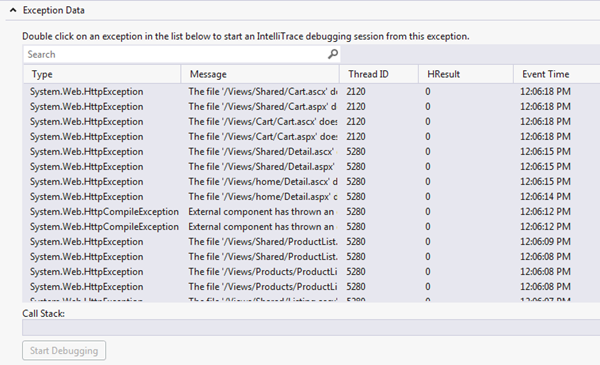
Exception Data
The first section you will be exposed to when you open a log file is this one. It provides at-a-glance information on exception events:
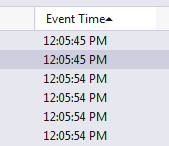
You can sort the data on any of the columns:
Like the other sections it has a search feature you can use to trim out extraneous data:
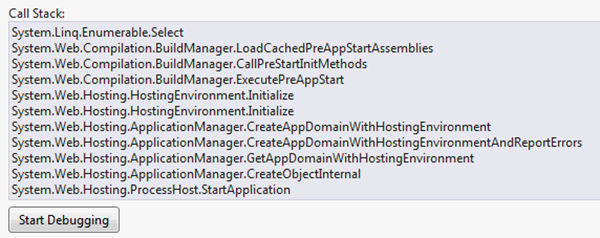
When you choose any entry, you will get call stack information at the bottom of the section:
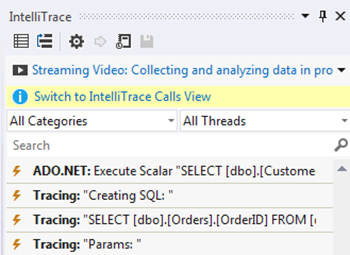
Just like the Thread List you can double-click any exception entry to cause the IntelliTrace Events and Calls windows to appear:
Review
This was a tour of the IntelliTrace log file and what you can expect to see when you begin using one. It’s not a deep treatment of the subject but is meant to give you a level of understanding that these files are not complex constructs. They can be used to quickly find the information you need to solve issues. As you will see in later posts, they are absolutely critical to your success when using IntelliTrace.
