.NET Profiling
Write Profilers With Ease Using High-Level Wrapper Classes
Joachim H. Fröhlich and Reinhard Wolfinger
This article discusses:
|
This article uses the following technologies: .NET Framework, COM, C++ |
Code download available at:NETProfiling.exe(304 KB)
Contents
The Low-Level CLR Profiling API
A Sample Profiler Target
A High-Level Profiling API
Bridging the APIs
Conclusion
The Profiling API of the common language runtime (CLR) provides services that exceed the needs of typical function and memory profilers. The latest extensions of the Profiling API for the Microsoft® .NET Framework 2.0 increase this functionality even further. These extensions enable tools to trace not only method calls at the class level, but also data flow across assembly boundaries without the need to instrument Common Intermediate Language (CIL) code for that purpose.
However, the powerful functionality and technical details of this API compromise its simplicity and usefulness. Programming with the CLR Profiling API can be laborious and error-prone because the numerous services are organized in an interface that applies a primarily functional design at a low level of abstraction.
In this article we will present a high-level, easy-to-grasp, and easy-to-apply profiling API, based on the CLR Profiling API, that conceals the mechanisms necessary to filter elementary profiling data and to rejoin them into semantically coherent concepts. Programming with the high-level API should considerably reduce the development effort required to construct various types of tools that profile a program, as it affords an abstraction level close to that of high-level languages within the .NET Framework.
A classic example of such a tool is a profiler that reconstructs method-call trees and aggregates execution times at the various levels of a call tree. Another demanding example is a profiler that generates test driver frames, such as for stochastic tests on the basis of real usage scenarios of assemblies under test. We'll use a sample tracer, a profiler of the latter type, to illustrate the high-level API. This profiler's job is to trace control and data flow across component interfaces.
We will start with a short review of the design of the low-level CLR Profiling API. For a detailed presentation of the API's functions, see the information in the "Profiling API Resources" sidebar.
Profiling API Resources
The following articles and books provide further information on the CLR Profiling API.
"CLR Profiler: No Code Can Hide from the Profiling API in the .NET Framework 2.0," by Jay Hilyard, MSDN Magazine, January 2005
"Under the Hood: The .NET Profiling API and the DNProfiler Tool" by Matt Pietrek, MSDN Magazine, December 2001
Debugging Applications for Microsoft .NET and Microsoft Windows by John Robbins (Microsoft Press, 2003) Chapter 10, "Managed Exception Monitoring," and Chapter 11, "Flow Tracing"
We will illustrate the design from a profiler's point of view with an example application that reveals the intricacy of the low-level API. This app focuses on the functions recently added to the API for inspecting data structures and their interplay with API functions for tracing control and data flow. The intrusiveness of technical details required for the low-level API in this case leads directly to a proposal for a high-level API and a preview of a profiler implementation that employs this API.
Finally we'll sketch an implementation that bridges both the high- and low-level APIs. The complete source code of the high-level profiler, along with a sample application to be profiled—a simple bank simulation—and some example profiles, are available in the code download for this issue.
The Low-Level CLR Profiling API
The CLR provides an easy-to-use, object-oriented platform for high-level programs. The list of CLR services includes management of assemblies, objects, method activation records, threads, exceptions, and metadata. These services concern the basic units of all .NET Framework-based programs regardless of the programming language in which they are written.
With the low-level CLR Profiling API, the exact behavior of a program is expressed as state changes in these CLR services. To receive notification about these state changes and handle them in some useful way, a profiler must be implemented as an in-process COM server. This is because the low-level CLR Profiling API spans three COM interfaces: ICorProfilerCallback2, ICorProfilerInfo2, and IMetaDataImport2 (IMetaDataImport2 is actually part of the Metadata API, and is used by unmanaged tools that target the CLR, including disassemblers, compilers, obfuscators, debuggers, and profilers). Figure 1 provides an explanation of these interfaces.
Figure 1 Profiling API Interfaces
| Interface | Description |
|---|---|
| ICorProfilerCallback2 | A callback interface that a profiler implements and the CLR uses to inform a profiler about state changes of the profiled application. |
| ICorProfilerInfo2 | An interface that the CLR implements and a profiler uses for navigating the current state of the profilee in terms of CLR structures. |
| IMetaDataImport2 | An interface that the CLR implements and a profiler uses for interpreting CLR structures. |
A closer look at the low-level CLR Profiling API underscores the conceptual distance to high-level concepts in the .NET Framework. For example, these three COM interfaces comprise 171 functions with 718 parameters. High-order concepts like assemblies, classes, and methods are addressed through tokens (UINT pointers). Structured method parameters of a profiled app require a complex interpretation procedure. Error checking of items passed to the COM interfaces is minimal, which can lead to spectacular crashes if a profiler provides wrong tokens. In addition, the CLR provides method input parameters and the addresses of output parameters only on method entry. To evaluate output parameters, a profiler needs to manage a separate shadow runtime stack.
Object addresses in the CLR Profiling API context do not reference actual objects because the heap management of the CLR moves objects during garbage collection and reuses addresses. A profiler must track movements in physical object memory. Future releases of the CLR could also use fibers. Running in fiber mode amounts to the CLR disassociating runtime threads from specific operating system threads. This impedes thread-local storage for implementing freethreaded profilers. These points go back to variable address mappings, which distort the recovery of execution models that high-level .NET-targeted languages apply.
Why are functions and UINT pointers used instead of cohesive COM interfaces for accessing constructs like assemblies, classes, and methods? One reason could be efficiency. However, a method call across an interface of an in-process COM server does not cost more than a method call through a vtbl in C++, and every call into the CLR goes across a COM interface anyway. So efficiency isn't likely to be the reason why the low-level API works with UINT pointers instead of COM interfaces. Another reason might be COM's approach to cooperative lifetime control of objects by means of the AddRef and Release members of IUnknown, and this can cause subtle errors in highly dynamic scenarios. A profiler violating the COM rules could easily confuse the CLR.
A Sample Profiler Target
To illustrate how profilers mix COM statements with functional C-style application logic and thus produce a heavy piece of code, we'll introduce an example bank application. Written in C#, this program simulates a simplistic bank with branches, accounts, and customers. Figure 2 shows the architecture of the bank app and indicates where the CLR and the profiler become involved. Standard assemblies like mscorlib.dll are omitted for clarity.
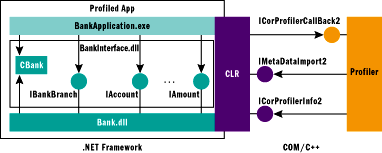
Figure 2** Bank App Architecture **
There are a few details of the client-side code worth looking at more closely. For example, the following code sets up a bank branch and a target account:
IBank bank = CBank.Get(); IBankBranch bankBranch; bank.Provide(out bankBranch); IAccount target = bankBranch.SetupAccount(); // initial balance 0.00 USD
The code in Figure 3 sets up several account holders (customers) where each customer can have a second account. In this code, all customers transfer various amounts of money to the target account at once (this is a multithreaded application):
foreach (CCustomer client in customers) client.StartTransaction();
Figure 4 shows a customer that can take money from several source accounts and transfer it to a target account in another thread.
Figure 4 CCustomer Class
using System.Threading; internal class CCustomer { private IBankBranch _bankBranch; private IAccount _account1; private IAccount _account2; private IAccount _target; private IAmount _amountToTransfer; private Thread _thread; internal CCustomer(string name, IBankBranch bankBranch) { _bankBanch = bankBranch; _thread = new Thread(new ThreadStart(Transfer)); _thread.Name = name; } internal string Name { get { return _thread.Name; } } internal IAccount BankAccount1 { set { _account1 = value; account.Owner = this.Name; } get { return _account1; } } internal IAccount TargetAccount { set { _target = value; } get { return _target; } } internal IAmount AmountToTransfer { set { _amountToTransfer = value; } get { return _amountToTransfer; } } internal void StartTransaction() { _thread.Start(); } private void Transfer() { _bankBranch.Transfer(_amountToTransfer, _account1, _account2, _target); } ... }
Figure 3 Setting Up Accounts
ArrayList customers = new ArrayList(); // Set up accounts for Smith CCustomer client = new CCustomer("Smith", bankBranch); client.BankAccount1 = bankBranch.SetupAccount( bank.GetAmount(100.00, "USD")); client.BankAccount2 = bankBranch.SetupAccount( bank.GetAmount(200.00, "USD")); client.TargetAccount = target; client.AmountToTransfer = bank.GetAmount(280.00, "USD"); customers.Add(client); // Set up accounts for Jones client = new CCustomer("Jones", bankBranch); client.BankAccount1 = bankBranch.SetupAccount( bank.GetAmount(800.00, "USD")); client.BankAccount2 = bankBranch.SetupAccount( bank.GetAmount(400.00, "USD")); client.TargetAccount = target; client.AmountToTransfer = bank.GetAmount(1100.00, "USD"); customers.Add(client); ...
The profiler needs to record the application's control flow as well as the data crossing method boundaries. One interesting new feature of the low-level CLR Profiling API is interpretation of method parameters. To extract the names, types, and values of both unstructured and structured parameters, the profiler must connect several low-level API functions during a callback from the CLR, which signals normal or exceptional control flow crossing a method boundary on either method activation (entering) or method deactivation (leaving).
The amount of code in the source file LowLevel.cpp in the download accompanying this article gives an impression of what must be done at the low-level API to dump the names, types, and values of a list of unstructured and structured method parameters. For example, we represent a sum of money as a structured parameter. In the sample app, the object comprises a currency denomination and a floating-point currency amount.
Technical details, like the guarding statements necessary for handling HRESULTs of COM functions and dummy values for parameters not needed when calling a function with many parameters, illustrate some frustrating elements of using the low-level Profiling API. Furthermore, at this implementation level, several services are simply not available, like the mapping of physical object addresses managed by the CLR's garbage collector back to object identifiers. For that to work, a profiler must track memory addresses for each object during its lifetime.
A High-Level Profiling API
Different types of profiling tools, like monitors, visualizers, protocol checkers, and generators of test drivers all apply the low-level CLR Profiling API in a similar way to reconstruct the behavior of a .NET Framework-based program in terms of components and objects. All these tools combine run-time data that reflect the behavior of a program written within .NET (using the ICorProfilerInfo2 interface) with data that enables interpretation of this data (through IMetaDataImport2). In general, profiling starts with tracing threads and functions or methods. Therefore threads and methods together constitute the root of the structured profiling interface, as shown in Figure 5. Figure 6 shows this interface in the overall profiling architecture.
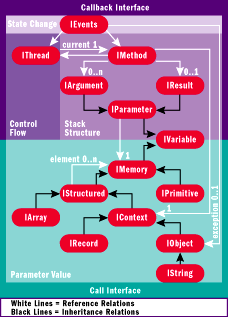
Figure 5** High-Level Profiling Interface **

Figure 6** Low-Level and High-Level Profiling Interfaces **
The high-level interface is designed according to how profilers will likely use it. The interface comprises several subinterfaces like IEvents and IMethod. IEvents is the high-level equivalent of ICorProfilerCallBack2 for signaling state changes of the profiled app, such as the CLR creating a thread, normal control flow entering a method, and exceptional control flow entering a method. IMethod is a high-level condensing of selected parts of ICorProfilerInfo2 and IMetaDataImport2 for obtaining the executing thread, the execution context (an object), all parameters, and the result, if any. Each of these interfaces is implemented as a pure abstract class, which in fact is a struct just to save access labels (public), as demonstrated by means of IEvents. A client of the high-level API must implement IEvents to be notified about state changes in the profiled app:
interface IEvents // #define interface struct { virtual void ThreadCreated(const IThread *thread) = 0; //"tc" for short virtual void ThreadDestroyed(const IThread *thread) = 0; //td virtual void NormalFlowEntered(const IMethod *method) = 0; //nfe virtual void NormalFlowLeft(const IMethod *method) = 0; //nfl virtual void ExceptionThrown(const IObject *exception) = 0; //et virtual void ExceptionalFlowEntered( const IMethod *method, const IObject *exception) = 0; //efe virtual void ExceptionalFlowLeft( const IMethod *method, const IObject *exception) = 0; //efl ... };
As this code suggests, programming with the high-level profiling API should be more appropriate to the needs of a profiling application and less error-prone than with the low-level CLR Profiling API. One reason for this convenience is the semantically rich structure of the high-level API. It has several high-level interfaces replacing low-level handles and tokens in a type-safe and expressive manner. Consider the excerpt of a profiler application shown in Figure 7. With significantly fewer statements, it does much more than the profiler implemented with the low-level API in LowLevel.cpp. Like the low-level variant, the high-level API dumps strings, doubles, and objects—as well as structs and arrays of one of the former types. Moreover, while the low-level profiler is capable only of dumping addresses of an object (which can change during the execution of a method of the profiled app due to garbage collection), the high-level profiler identifies objects with numbers unique to an application session. Object identifiers more directly reflect how objects are identified at the level of a .NET-targeted programming language. To ease comparison, the function call graph of the high-level profiler corresponds to that of the low-level profiler, albeit with one important difference: calls of the low-level API are completely hidden. Thus a profiler application can focus on its business.
Figure 7 High-Level Profiler API
void MsdnTracer::NormalFlowEntered(const IMethod *method) { TraceParameterList(method); } void MsdnTracer::TraceParameterList(const IMethod *method) { for(int i=0; i < method->GetArgumentCount(); i++) TraceParameter(method->GetArgument(i).get()); if(method->GetArgumentCount() > 0) _tprintf(_T("\n")); } void MsdnTracer::TraceParameter(const IArgument *arg) { IMemoryPtr value = arg->GetValue(); // typedef std::auto_ptr<IMemory> IMemoryPtr; CString direction; if(arg->IsIn()) direction = _T("in"); else if(arg->IsOut()) direction = _T("out"); else direction = _T("ref"); _tprintf( _T("High-level API: [ %s] %s %s %s="), direction, arg->GetTypeName(), arg->IsArray() ? _T("[]") : _T(""), arg->GetName()); TraceValue(arg->GetValue().get()); } void MsdnTracer::TraceValue(const IMemory *value) { const IPrimitive *pri; const IString *str; const IStructured *obj; if((pri = dynamic_cast<const IPrimitive*>(value)) != NULL && pri->GetDatatype() == typeDouble) TraceDouble(pri); else if((str = dynamic_cast<const IString*>(value)) != NULL) TraceString(str); else if((obj = dynamic_cast<const IStructured*>(value)) != NULL) TraceStructured(obj); else _tprintf(_T("$Unsupported")); } void MsdnTracer::TraceDouble(const IPrimitive *value) { _tprintf(_T(" %f"), value->GetDouble()); } void MsdnTracer::TraceString(const IString *value) { _tprintf(_T("# %d \" %s\""), value->GetLogicalId(), value->GetText()); } void MsdnTracer::TraceStructured(const IStructured *value) { _tprintf(_T("# %d {"), value->GetLogicalId()); for(int i=0; i < value->GetSize(); i++) { IMemoryPtr field = value->GetAt(i); if(i > 0) _tprintf(_T(", ")); _tprintf(_T(" %s %s %s="), field->GetTypeName(), field->IsArray() ? _T("[]") : _T(""), field->GetName()); TraceValue(field.get()); } _tprintf(_T("}")); }
The high-level profiler, HighLevel.cpp (shown in Figure 7), works essentially as follows. Class MsdnTracer is the entry point into the profiling application. Therefore MsdnTracer implements the NormalFlowEntered method of the callback interface IEvents in order to react to the control flow entering a method:
NormalFlowEntered(IMethod *method)
In case of an elementary parameter (for example, IPrimitive or IString), MsdnTracer dumps it and moves on to the next parameter. If a parameter consists of several components (for example, IStructured), then MsdnTracer loops over the components and dumps the type, name, and value of each:
for(int i=0; i < value->GetSize(); i++) { IMemoryPtr field = value->GetAt(i); if(i > 0) _tprintf(_T(", ")); _tprintf(_T(" %s %s %s="), field->GetTypeName(), field->IsArray() ? _T("[]") : _T(""), field->GetName()); TraceValue(field.get()); }
The loop is generically implemented because it covers all kinds of structures, namely arrays (IArray), structs (IRecord), and objects (IObject), in a uniform and type-safe way through the common supertype IStructured. This includes objects whose components (such as member variables) are defined by several classes along an inheritance path. Components belonging to one of the structured subtypes of IStructured are dumped during the recursive call of method TraceValue. Moreover, MsdnTracer dumps logical identifiers of strings (as they are objects) and of user-defined structures by calling the appropriate service of the profiler, a service that is not available at the low-level API:
_tprintf(_T("# %d \" %s\""), value->GetLogicalId(), value->GetText()); ... _tprintf(_T("# %d {"), value->GetLogicalId());
Note that the high-level profiler application is shorter, more functional, more readable, more robust, and easier to maintain than the profiler application directly implemented with the low-level CLR Profiling API. A variant of a high-level profiling application that formats the output in a more sophisticated manner is available in App.Tracer\IndentedTextFormatter.cpp in the download. The variant produces logs as contained in directory Bank.log in the download.

Figure 8** Stack Flow Control **
On examining the high-level profiling API in Figure 5, you may have some questions about the design of the run-time model, including the modeling of interfaces and namespaces, exception handling, and so on. Designers of expressive logs or test drivers for real-world applications cannot avoid such questions, so we provide answers regarding design decisions for our profiling API. (Furthermore, the reader might not concur with all of our design decisions.)
We modeled namespaces—which, strictly speaking, include classes and interfaces—as properties of IMethod. This facilitates filtering of relevant method activations on the basis of namespaces. This decision is appropriate due to the central role that methods play in the profiling of program behavior.
We modeled an exception entering a method simply as a reverse control flow that optionally carries an object that provides information about the exception. Figure 8 illustrates this by means of events describing an exceptional control flow across several stack layers (ET1 to EFE2).
Bridging the APIs
The expressiveness of the high-level API does not come for free, of course. This is simply because, at the high-level API, our profiler offers services necessary for reconstructing different views on programs at the object-oriented abstraction level, including:
- Filtering events for objects of relevant assemblies, classes, and interfaces
- Cutting call stacks beyond a certain depth
- Tracking different memory positions of a .NET-based object during its lifetime
- Remapping operating system threads onto threads in the .NET Framework
- Managing method parameters on a stack to access them equally on method entry and on method exit
- Providing the machinery for easy interpretation of elementary and structured method parameters
This is a lot of work, so you might wonder how all the pieces fit together. To configure our profiler we have to set some environment variables as shown in Config.cmd (see Figure 9). Recall that the profiler discussed here records usage scenarios of a concrete bank implementation. In this configuration, the profiler produces the logs in Directory Bank.log in the download. These logs support testing and debugging of profiled apps.
Figure 9 Section Profiler Configuration
@REM *** Section 1: configure the CLR profiler @set COR_ENABLE_PROFILING=1 @regsvr32 /s Spyder.dll @set COR_PROFILER={B98BC3F3-D630-4001-B214-8CEF909E7BB2} @REM *** Section 2: configure the profiler core @set SPYDER_TARGET_PROCESS=BankApplication.exe @set SPYDER_STACK_DEPTH=1 & REM trace only direct method calls @set SPYDER_FILTER=C:{Bank.Interface}.* ^| I:{Bank.Interface}.* & REM ‚or' in the sense of set union @set SPYDER_TARGET_ASSEMBLY=BankInterface;Bank @set SPYDER_APPLICATION=Tracer @REM *** Section 3: configure the profiler application (here: Tracer.dll) @set SPYDER_INSTANCE_DATA=1 & REM dump objects crossing boundaries @set SPYDER_SHOW_NAMESPACE=0 & REM do not dump namespace names @set SPYDER_FILE_PER_THREAD=0 & REM all data go to one file
First, we tell the CLR which profiler to load. In our case the profiler actually resides in Spyder.dll, which we refer to as the profiler core:
@set COR_ENABLE_PROFILING=1 @regsvr32 /s Spyder.dll @set COR_PROFILER={B98BC3F3-D630-4001-B214-8CEF909E7BB2}
In the second section, we tell the application-independent part of our profiler to hook only onto our profiled app of interest, BankApplication.exe. Herein the profiler will record all top-level activations of methods declared in classes or interfaces of namespace Bank.Interface:
@set SPYDER_STACK_DEPTH=1 & REM trace only direct method calls @set SPYDER_FILTER=C:{Bank.Interface}.* ^| I:{Bank.Interface}.* & REM ‚or' in the sense of set union
As you might guess from the code, namespace Bank.Interface is restricted to the assembly BankInterface.dll, which completely separates a bank application from a concrete bank implementation (see Figure 2). In order to accelerate the profiler, we restrict its attention to exactly these two assemblies (see line 9) because we know that they together constitute the parts relevant for our profiling goal:
@set SPYDER_TARGET_ASSEMBLY=BankInterface;Bank
Next we tell the profiler core to load the application-dependent part of our profiler from Tracer.dll, a possible profiler application, which is configured in the third section:
@set SPYDER_APPLICATION=Tracer
In this case the tracer is set up to dump the structure of objects flowing between a bank application and the bank implementation. Note that here dumping object structures is just for the sake of demonstration:
@set SPYDER_INSTANCE_DATA=1 & REM dump objects crossing boundaries
Usually it should suffice to dump object identifiers (set SPYDER_INSTANCE_DATA=0) because their inner structure is completely hidden from clients, as is the case in the bank example. Furthermore the profiler application shall dump names of classes and interfaces without leading namespaces to compact logs:
@set SPYDER_SHOW_NAMESPACE=0 & REM do not dump namespace names
Because we want to obtain a global view of the program behavior during one specific session, we tell the profiler to dump data about all threads into a single log file:
@set SPYDER_FILE_PER_THREAD=0 & REM all data go to one file
The last point suggests an efficiency bottleneck. You might propose shortening the response time of the tracer and replacing our simple variant with a more clever solution. Such a tracer could, for instance, be split into two parts and work in two phases. The first part is attached to the profiler core:
set SPYDER_APPLICATION=YourCleverProfiler.dll
In the first phase, it tags each control flow event of each thread with a sequential number or time stamp and then dumps the data into separate files on a per-thread basis. In the second phase, an autonomous, externally running part of the tracer merges these separate files to retrieve the global view. This discussion brings us directly to the inner workings of the profiler.
Profilers must be implemented efficiently to minimize the impact on profiled apps. For a typical profiler that determines the distribution of run-time cycles among functions or methods, this essentially means subtracting the overhead due to the measuring procedure from the total run time. For a profiler that captures program sessions as traces for testing or debugging purposes, this in particular means avoiding timeouts. Timeouts triggered by a profiler would change a profiled app's behavior in irregular ways. Therefore, the profiler must be optimized primarily for run- time performance. The memory needs of a profiler can increase the profiled app's working set as long as it remains below a certain threshold and does not stress the memory manager of the operating system, thus again avoiding timeouts.
The profiler core is primarily designed to fulfill two requirements: it must be as lean as possible and it must operate only on demand. Both requirements aim primarily to save running time. While generally treating both time and space as efficiently as possible, in a conflict situation we decided in favor of minimal impact on time.
The profiler core implements the first requirement by using the CLR as a data container instead of managing separate copies of data items. Only in some cases does the profiler core convert CLR data and cache the conversion results in order to accelerate future access. Obvious examples are names of methods and namespaces. Once converted on method entry, these names are maintained because a profiler application most likely will access them again on method exit. In the majority of cases the profiler core simply remembers positions within CLR data structures to avoid repeated iteration.
The profiler encapsulates this processing state information in objects that a profiler application can access only through parts of the high-level profiling interface, such as IPrimitive or IObject. The code in Figure 10 illustrates the resulting implementation by means of an excerpt of the Method class implementing the high-level interface IMethod.
Figure 10 Method Class
IArgumentPtr Method::InternalGetArgument(int index) { PCCOR_SIGNATURE sigBlob = NULL; int argumentCount = this->GetArgumentCount(); // reuse position in the argument's part of the signature blob int argIndex = 0; if(m_argSig.GetSize() == 0) { this->Seek(_Arguments); // go to the argument's part sigBlob = m_sigBlob[_Arguments]; } else { // argument has already been read; use nearest position argIndex = min(index, m_argSig.GetSize()-1); sigBlob = m_argSig[argIndex]; // postion of the nearest argument } for(; sigBlob != NULL && argIndex < argumentCount; argIndex++) { // remember where the part describing an argument // starts in the sigBlob if((argIndex+1) > m_argSig.GetSize()) m_argSig.Add(sigBlob); bool isByRef, isArray; CorElementType type = TypeInterpreter::GetType(sigBlob, isByRef, isArray); mdTypeDef typeDef = TypeInterpreter::GetTypeToken(sigBlob, type); if(argIndex == index) return IArgumentPtr(DEBUG_NEW Argument( this, argIndex, type, isByRef, isArray, typeDef)); } return IArgumentPtr(NULL); }
The code illustrates what runs behind the high-level profiling API when a profiler application accesses an argument for a parameter of a profiled app's method by its position in the parameter list. This code block results in an object of type IArgument, which the profiler application can then use for querying name, type, and value. Note that the profiling interface of the CLR forces a profiler to iterate through the CLR data structure describing the argument list (sigBlob in Figure 10) until it arrives at the designated argument. The profiler core indexes this data structure while iterating. Thus recurrent parameter access requires constant time instead of linear time as during initial access.
The on-demand requirement reveals the profiler core as lazy. The profiler core merely wraps method arguments in access objects like those of class Method and converts parameter values when a profiler application requires access to them. The profiler core executes autonomously only those tasks absolutely necessary for tracking the behavior of a profiled app at the object-oriented .NET abstraction level. One of these tasks is managing shadow stacks with method activations of components that the profiler user selected for recording.
Another task concerns the inversion of mappings for entities like threads and objects. In the case of .NET Framework-based objects, CLR memory management can map them to different physical addresses, and one physical address might be assigned to different objects. In the case of threads, the CLR can back them with different threads of the OS. To undo these mappings, the profiler core uses two tables: one for maintaining relations between low-level OS threads and high-level .NET-based threads and one for maintaining relations between low-level memory addresses and high-level object identifiers. Using tables for mapping ensures constant run-time usage. Note that high-level profiler applications that record usage scenarios of selected components, as test-driver generators do, lead to much smaller shadow stacks because they only observe top-level calls of methods on the interface of selected assemblies. If a profiler application traces each method call of any assembly at any call level, then the real stacks and their respective shadow stacks manage the same number of method activations.
We must stress another consequence of the profiler core's laziness, even if it seems to be rather obvious. A developer of a profiler application could be tempted to save an activation record, actually a reference to an object of type IMethod, in order to check protocol-dependent constraints on parameter values across method activations. After deactivation of a method—actually after the profiler core has raised one of the events NormalFlowLeft or ExceptionalFlowLeft for an activated method—activation-specific data is no longer available. An extended profiler core could offer an additional service that, on demand by a profiler application, clones activation records and saves them in a compact form for future access.
The design of the high-level profiling API profits from the expressiveness of C++. We have already mentioned pure abstract structs as a means for describing interfaces with only public method declarations. From a conceptual point of view, another example is the fact that all parts of the runtime model are constant because a profiler must not change the usual course of actions, the logical behavior, of a profiled app. However, declaring a function at the high-level API as constant contradicts the requirement for the profiler's core to operate only on demand, at the latest possible time.
Remember that in C++ you can slack the tension between the demand for security on the one side and efficiency on the other side through lazy initialization simply by making a const object temporarily modifiable with a const-cast. Service objects running inside the profiler core wait and change state only when a profiler application forces them to do so. Now we can close the gap between the abstract, high-level interface exemplified by method IMethod.GetArgument and the implementation Method.InternalGetArgument in the profiler core:
interface IMethod // #define interface struct { ... virtual IArgumentPtr GetArgument(int index) const = 0; ... };
A const-cast in this case simply removes the const part of the object's type for an entire method:
class Method : public IMethod { public: ... IArgumentPtr GetArgument(int index) const { return (const_cast<Method*>(this))->InternalGetArgument(index); } ... };
Conclusion
This article can be seen as a discussion of the relationship between efficiency and abstraction. COM, with its focus on binary interfaces, and C++, with its comprehensive language features, both provide ideal means to reconcile abstraction and efficiency in a harmonic way. We maintain that this will hold for some time to come, even as managed programs written in one of the amazingly potent .NET-targeted languages gain in importance.
A final question remains to be answered: what does the overall performance of a profiler application amount to? This obviously depends on the profiler's tasks and the profiled app's structure.
All in all, the underlying problem has several dimensions. For instance, a profiler that only dumps method signatures obviously needs less time than a profiler that also recursively dumps method arguments. With minimal runtime overhead, the profiler core provides services not available at the low-level CLR Profiling API as well as a method for diminishing the multidimensional problem by means of additional data filters. Data filters enable the extraction of focused profiles—and generating test drivers for selected assemblies is exactly this. Developers and testing staff should always know the structure of their programs in terms of assemblies, components, and publicly available classes and interfaces of interest and their relations; these interfaces should be concise and minimal. If they are not, either the data filter is too complicated, which increases the cost of applying the filter, or the data filter is too narrow or too wide, which leads to less useful profiles.
Experts agree that sharp interfaces of highly cohesive components characterize well-designed and testable programs. Testable programs enable the use of the power of both profiling APIs to ensure the quality of your .NET-based program. Programming with the low-level CLR Profiling API is less structured and thus more flexible, but it is also harder to use. Programming with our high-level profiling API is less flexible, but it is often simpler to use, and it is tailored to the needs of profilers operating close to the abstraction level of high-level .NET-targeted languages.
Joachim H. Fröhlich (joachim.froehlich@acm.org) is a member of the Software Engineering Department of the Johannes Kepler University of Linz, Austria. He works on .NET component architectures with a focus on testability and configurability.
Reinhard Wolfinger (wolfinger@ase.jku.at) works as a researcher at the Christian Doppler Laboratory for Automated Software Engineering in Linz, Austria. He focuses on .NET component architectures and reuse.