Advanced Basics
Monitor Your Apps with System.Diagnostics
Brad McCabe
Contents
Event Logs
Performance Counters
Process Class
It never fails. The application you just deployed ran great on your development machine—but stumbles in production. The problem might show up right away or maybe it creeps up over time. Now what?
All too often developers whip out the debug version of their code and redeploy that. This special build is often loaded with random writes to some file on disk for the developer to wade through later to try to figure out what’s going on. There has to be a better way.
The solution lies in the System.Diagnostics namespace, which provides classes for interacting with event logs, performance counters, and system processes. You can leave this monitoring code enabled in your production application and view information whenever a problem arises. Let’s see how you can use these classes in your applications.
Event Logs
Countless developers debug their applications by writing information out to external files. Besides leaving bits of trash around the hard drive, this approach often takes a long time, is not sortable or filterable, and rarely provides rich data. So why do so many people do it? They don’t realize how easy the event log is to use.
Let’s start by writing to the event log the long way to illustrate the concepts, then take a look at the quick and easy way. First, add an import statement to your code to reference the System.Diagnostics namespace, then insert the following code into your error handling routine:
‘ Create the source, if it does not already
‘ exist.
  If Not EventLog.SourceExists("MSDNDemo") Then
    EventLog.CreateEventSource("MSDNDemo", _
    "CustomLog")
End If

‘ Create an EventLog instance and assign its
‘ source.
Dim myLog As New EventLog()
myLog.Source = "MSDNDemo"

‘ Write an informational entry to the event log.
myLog.WriteEntry("Hello from the event log.")
The top section checks whether you’ve already created the source of your event. Most developers use the name of their application, making it easy to quickly pick out the application’s events from other entries in the event log.
If the source does not exist, it is created and associated with an event log. You can use existing sections of the event log such as the Application and System sections, or you can create your own section by specifying a name (as this demo does).
Once the source is created, adding events to the event log is as simple as creating a new EventLog object and associating it with the source. This example simply writes "Hello from the event log," but you can pass in detailed information—like a stack trace—to the WriteEntry method and place any information in the event log.

Figure 1** User-Generated Event Log Entries in a Custom Section **
Let this code execute several times, and your event log will display the activity as shown in Figure 1. You can view the Windows® Event Viewer (%windir%\system32\eventvwr.exe), as shown in Figure 1. You can also view the event log from inside of Visual Studio® in the Server Explorer, as in Figure 2. If you double-click one of these entries, you can view the details and see your custom error message (see Figure 3).

Figure 2** Event Logs within Visual Studio **
The EventLog.WriteEntry method has 10 overloads that give you lots of flexibility and control. One of the most useful lets you specify the type of event you’re logging. Notice in Figure 1 that each item is of type Information. For a demo this works fine, but in the real world you might have lots of different events. The WriteEntry method lets you supply the event type, such as error, warning, information, success audit, or failure audit:
    myLog.WriteEntry("Your error here.", _
    EventLogEntryType.Error)

Figure 3** User-Generated Event Log **
Now let’s try it the quick and easy way. Visual Basic® 2005 introduced the My object to act as a speed dial into the framework. You can use My to quickly add events to the event log:
My.Application.Log.WriteException( _
    "Written from My", TraceEventType.Warning, _
    "Additional Information")
And you can also use My via the WriteEntry method:
My.Application.Log.WriteEntry("Written from My", TraceEventType.Error)
But if you call this method and look in the event log, the message may not be there, because the My object lets you route your messages to different listeners based on settings in your configuration file. More discussion of this very powerful functionality is beyond the scope of this column, but you can find further information at "My.Application.Log Object".
Use the event log responsibly—there are few things more annoying than overly chatty applications that fill the event log with worthless noise. If you have an error, important warning, or information, you should log it. Specifying types on your entries will greatly help because most columns can be filtered in the event viewer in Windows.
Performance Counters
The event log is a great place to write messages, but what if you want to see what is going on inside your application while it is running? This is where performance counters come in.
Many developers are familiar with the Windows Performance Monitor for viewing CPU and memory utilization or hard drive information (see Figure 4). Did you know you can add your own counters and data points with the PerformanceCounter class? Used together, PerformanceCounter and the Windows Performance Monitor are like being able to hook an EKG machine up to your application at any time.

Figure 4** Standard Windows Performance Tool **
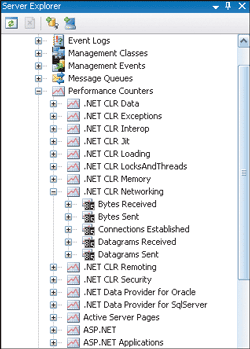
Before I talk about adding custom counters, let’s explore the counters that are already available. Open the Server Explorer in Visual Studio and navigate to the Performance Counters on one of your machines. You’ll see a huge list of categories for counters, which expand to reveal many individual counters for each category (see Figure 5).

Figure 5** Performance Counters **
You can use these system-managed counters in your application. Go ahead and expand the Memory category and then the Available Bytes counter. Drag the Available Bytes counter to a new Windows Form in your application.
On that form, drop a label and a new timer object with the Enabled property set to true. Add the following code:
Private Sub Timer1_Tick(ByVal sender As System.Object, _
     ByVal e As System.EventArgs) Handles Timer1.Tick
    Label1.Text = Me.PerformanceCounter1.NextValue
End Sub
This is a very simple example, not something you’re likely to do in a real application, but it shows how you can add basic monitoring or retrieving system counters to an application. In a real world scenario, you might take action based on the state of a value, log this information, or do any of a number of things.
More than likely, you are going to want to write some custom counters to monitor the health and performance of your apps at any given time. To add a new counter, right-click on the Performance Counters item in Server Explorer and choose Create New Category.
In this example, let’s create a category called TestCategory and add a new Counter named TestCounter. This time, you’ll access the counter from code.
Start by dragging and dropping a new timer and button to the form and add a private variable called counter to your form:
Private counter As PerformanceCounter
In the button click event, add the following code:
‘Init the counter object
counter = New PerformanceCounter("TestCategory", "TestCounter", False)
   ‘ Set its value to 0
   counter.RawValue = 0
   ‘ Start the time to update the counter
   Timer2.Enabled = True
In the timer event, add this code:
Counter.IncrementBy(New Random().Next(-5, 10))
This causes the counter to increment by some random number from -5 to 10. The example uses a random number, but this could be the number of sales or orders processed, users logged on, errors logged, or anything else it makes sense to track in your application.
Before you start the sample application, load Performance Monitor from under Administrative Tools. This time, click on the + sign to add a new counter. Under Performance Object, you’ll now see the new TestCategory you created. You can select that from the dropdown and pick TestCounter from the list of counters.
With Performance Monitor running, click the button of the sample application. You should see a graph similar to Figure 6.
As you can see in the sample code, the IncrementBy method was used to increase or decrease the counter. If you wanted to move the counter up or down by one, you could simply call the Increment and Decrement methods.

Figure 6** TestCounter Results Displayed in Performance Monitor **
For an example like this that uses the Server Explorer, some developers wonder if they can do it all with code. Yes, you could write code such as
   If Not
     PerformanceCounterCategory.Exists("MSDNSample")
   Then
     PerformanceCounterCategory.Create("MSDNSample", _
       "Built to show how to add custom counters", _
        PerformanceCounterCategoryType.SingleInstance, _
       "MSDNSampleCounter", _
       "Built to show how to add custom counters")
   End If
and add it to your button click event to create a different category and counter entirely from code. If you update your other code to point to this category and counter, you’ll see that the project runs and functions exactly the same as the sample.
Process Class
So far in this column you’ve seen how to use an event log and performance counters; now let’s dig into a third area of the System.Diagnostics namespace, the Process class.
First, let’s define a process: it’s simply a running application. With the Process class and the right permissions you can access information and perform actions, such as start or kill, on various processes on users’ systems.
The Process class gives you access to lots of data about your application or other processes. For the example here, let’s boost the base priority of the sample application.
Here’s the scenario. Your application is running on a server; it is the primary application and function on that server, but it’s not performing well because background tasks are consuming too much processor time. You can do one of two things; lower the priority of the background tasks or increase the priority of your tasks. (In most cases, you won’t need to adjust the priority of a process because Windows does a good job of running multiple processes and swapping them in and out.)
To work with the process class, you first need to fetch a reference to either your process or another process. Since you want to boost the current process, you’ll use:
   Dim myProcess As Process = _
       Process.GetCurrentProcess()
To access other processes on your machine or remote machines, you’d use the GetProcessessByName method instead:
   Dim theProcesses() As Process = _
       myprocess.GetProcessesByName( _
       "ProcessName", "MachineName")
Once you have a reference to a process, you can find out lots of information about it using its properties. For a complete list of properties, see ".NET Framework Class Library Process Members".
It takes just one line of code to boost the priority:
myProcess.PriorityClass = ProcessPriorityClass.RealTime
You boosted the application to RealTime. This is the highest level you can set in the OS and gives the app priority over just about everything This can lead to problems if your application hogs all of the system resources. Launch Task Manager to confirm that the OS sees the application in its boosted state, as shown in Figure 7.

Figure 7** Boosting to RealTime **
You can use the process command to do lots of common tasks. Let’s say you wanted to start Microsoft Internet Explorer® minimized and navigate to the Visual Basic Developer Center. You would simply use the following code:
Dim startInfo As New ProcessStartInfo("IExplore.exe")
startInfo.WindowStyle = ProcessWindowStyle.Minimized
startInfo.Arguments = "msdn.microsoft.com/vbasic"
Process.Start(startInfo)
The Process class works well for printing, too.
Dim myDocumentsPath As String = _
    Environment.GetFolderPath(Environment.SpecialFolder.Personal)
myProcess.StartInfo.FileName = myDocumentsPath + "\MyFile.doc"
myProcess.StartInfo.Verb = "Print"
myProcess.StartInfo.CreateNoWindow = True
myProcess.Start()
As you can see, there are many uses for the System.Diagnostics namespace, from logging events to the event log, to reading and writing performance counters, to working with system processes. This is an incredibly useful and powerful set of tools that every developer should become familiar with and use in their work.
Send your questions and comments to basics@microsoft.com.
Brad McCabe is a program manager at Microsoft and, among other things, is responsible for the Visual Basic Developer Center on MSDN.