Toolbox
Advanced Unit Testing, Object Mocking, Profiling Your Apps and More
James Avery
Contents
Advanced Unit Testing
Better Testing with Mocks
Quantifying App Performance
Implementing a Continuous Integration Environment
Advanced Unit Testing
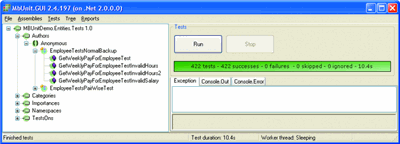
Unit testing has gradually moved from a fringe technology to standard practice on many Microsoft® .NET Framework projects. Many .NET developers have at least some experience working with nUnit, the predominant unit-testing framework for .NET. While nUnit covers most required scenarios for unit testing .NET applications, you can take unit testing to the next level with MbUnit 2.4. MbUnit is an open-source unit-testing framework started by Jonathan "Peli" de Halleux (who has since gone on to work at Microsoft Research) and is currently led by Andy Stopford along with a team of talented developers.
MbUnit starts with the general functionality that most xUnit-testing frameworks include: test fixtures with setup and teardown attributes, the familiar test attribute, a number of assertions, a console test runner, and an easy-to-use windows test runner. But MbUnit differentiates itself from other unit-testing frameworks with some very useful and innovative extras.
Row testing is a feature that allows you to pass in parameters to your unit tests. Instead of writing separate tests for each different scenario you want to examine, you can write one test with parameters and then pass in data using convenient attributes. For instance, you might have a method that accepts a book name and ISBN number and then checks if that book is in stock. Instead of writing different tests for books in stock, books out of stock, and books that aren't in the database, you can write one test method that accepts a book name and ISBN number as parameters. Then, using the Row attribute, you can specify three different sets of values for each different scenario as well as what the expected result would be. Not only does this reduce the amount of code you have to write for your tests, it also makes those tests more readable and maintainable in the future.
A similar feature, pair-wise testing, allows you to use factories to feed data into your unit test. Factories make it easy to test a very large number of data scenarios without a lot of code. Continuing the example from above, you could create a factory that returns hundreds, even thousands, of books and ISBN numbers. MbUnit is even smart enough to eliminate combinations in testing data that would be redundant based on earlier combinations.
MbUnit also includes a number of performance-oriented test attributes. The duration attribute can be used to find the amount of time it takes for your test to execute. MbUnit also gives you the ability to write tests that can read and make an assertion based on the value of a performance counter using the PerfCounter attribute.
Finally, MbUnit includes another useful feature called the Rollback attribute, which will wrap your test in a transaction and then roll back that transaction when the test is done. This way, you don't end up with a database full of test data. This feature works in both the .NET Framework 1.1 (using COM+ transactions) and in the .NET Framework 2.0 (using the new built-in transaction support).
Price: Free; source code available.

MbUnit Provides Advanced Unit-Testing Support for .NET Developers
(Click the image for a larger view)
Better Testing with Mocks
The more unit tests you create, the longer it takes to run those unit tests. Ideally, unit tests should take only seconds to run so developers can run them every time they build the application. However, most applications today rely heavily on databases, Web services, and myriad other external dependencies. There is no way a large set of unit tests that use one of these dependencies, can run in seconds.
Actually, the only way your unit tests can run that quickly is if you use something to simulate the external dependency. This is where mocks come into the picture. Mocks are objects that pretend to be your external dependency so that your code can run normally using the mock object instead of the external dependency. Not only does this ensure that your tests run quickly, but perhaps more importantly, it allows you to focus on testing the functionality of your code instead of the external dependency. Moreover, you also get the ability to test the interaction between your code and the external dependencies. Instead of just testing that your business layer can successfully return an object, you can test that it will call a specific method on your data access layer to retrieve that object.
There are a number of different mocking frameworks available for .NET, and each one handles the problem of defining what a mock should expect and return a little bit differently. Rhino.Mocks, an open-source framework developed by Oren Eini (also known as Ayende Rahien), stands out because of its ability to provide strongly typed mocked objects. Most of the available mocking frameworks require the use of hard-coded strings to define method names and parameters, which means you won't know about potential issues until you actually try to run your tests at run time. By allowing for strongly typed mock objects, Rhino.Mocks gives you all the benefits of compilation—helping you catch errors earlier.
Rhino.Mocks is also flexible in the types of mocking allowed. A normal mock object will throw an exception if an unexpected method is called. But Rhino.Mocks offers a dynamic mock object that, instead of throwing an exception, will return null or 0 for any unexcepted method calls. Finally, Rhino.Mocks allows a partial mock, which also avoids throwing an exception if there is no expectation defined, but instead of returning 0 or null, it will call the original method on the object and return that value. This lets you mock only the methods needed on an object.
Rhino.Mocks also offers a number of other useful features, including support for generic types, callbacks, and the ability to mock delegates and events.
Price: Free; source code available.
Quantifying App Performance
One of the main goals when writing any application is performance, yet most developers work on a daily basis with almost no way to quantify this goal. Typically, it is left to users to identify which screens or pages are running too slow, followed by a guessing game on the developer's part as to what is causing the performance issues. What developers really need is a way to quantify how an application is performing and quickly identify bottlenecks. dotTrace is an application profiler from JetBrains that makes accomplishing both tasks quick and easy.
Using dotTrace, you can profile Windows® applications, Web applications (using either IIS or the Visual Studio® Development Server), and Windows services. dotTrace offers both performance profiling, which allows you to view the amount of time each of your methods and lines of code takes to execute, as well as memory profiling, which shows the amount of memory currently being used and by what objects. Performance profiling is available for applications built on the 1.1 and 2.0 versions of the .NET Framework; memory profiling is available only for applications built using version 2.0.
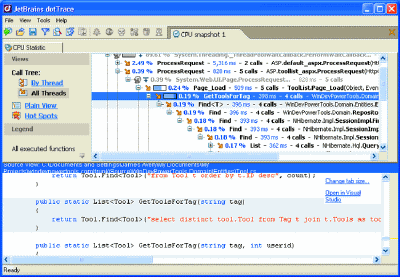
Performance profiling with dotTrace shows you how many times each of your methods was called, how much total time was spent in those methods, and what percentage of the overall time a particular method consumes. These stats can be easily examined to find the parts of your application that aren't performing well. An even easier way is to use the Hot Spots feature, which shows you the 100 worst-performing parts of your application.
dotTrace includes two modes for memory profiling. You can get a dump of the memory, which lets you view the objects currently in memory and the amount of space they occupy. Or you can use the Differences mode, which lets you capture memory during a particular interval and then shows you both new objects and dead objects and the difference between the two during a profiling run. Both ways of memory profiling can be very valuable when trying to track down a memory leak.
One feature that makes dotTrace stand out is its integration with Visual Studio, which lets you easily start profiling a solution with just a couple of mouse clicks. With dotTrace, the next time you need to speed up all or part of your application, you will know exactly what needs to be optimized to gain the maximum performance improvement for the least amount of work.
Price: $499.

dotTrace Offers a Number of Ways to View Profiling Data that is Stored in Snapshots
(Click the image for a larger view)
Implementing a Continuous Integration Environment
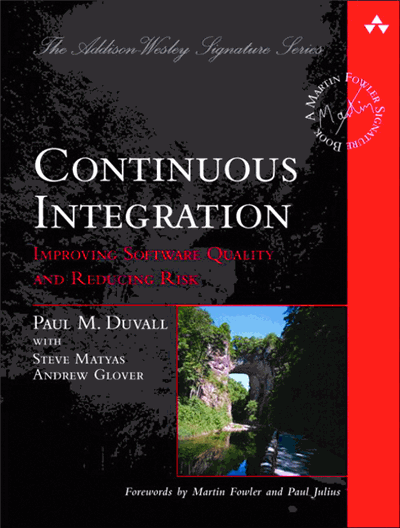
There is plenty of information on the Internet and scattered throughout different books and articles on setting up and configuring a continuous integration environment. However, Continuous Integration: Improving Software Quality and Reducing Risk by Paul M. Duvall with Steve Matyas and Andrew Glover (Addison-Wesley Professional, 2007) is the first attempt I'm aware of to collect in one place all of the great reasons to use continuous integration as well as the patterns and best practices for setting up and using continuous integration on a software project.
The book starts with easy-to-understand scenarios that underscore the benefits of continuous integration—and the dangers of not using it. Anyone trying to convince his team or manager to incorporate continuous integration should find more than enough information to make a compelling case. The first section also includes some best practices concerning your actual build, like being sure you have a dedicated build server and build metrics.
The book goes on to identify best practices for continuous integration, with chapters on database integration, running and providing feedback from automated tests, code inspection and analysis, deployment, and providing feedback. These chapters are, for the most part, technology-neutral. While specific tools and code samples are used in each section, most of the advice is applicable regardless of your continuous integration platform.
The book concludes with a pair of useful appendices. The first presents a good list of tools for building your continuous integration environment. The second appendix describes the best way to choose the tools to include in your continuous integration environment and includes a more in-depth guide to the major continuous integration servers.
Price: $44.99.

Send your questions and comments for James to toolsmm@microsoft.com.
James Avery runs his own .NET consulting practice, Infozerk Inc. His most recent book is Windows Developer Power Tools (O'Reilly, 2006). You can e-mail him at javery@infozerk.com.