Enabling SignalR Tracing
Warning
This documentation isn't for the latest version of SignalR. Take a look at ASP.NET Core SignalR.
This document describes how to enable and configure tracing for SignalR servers and clients. Tracing enables you to view diagnostic information about events in your SignalR application.
This topic was originally written by Patrick Fletcher.
Software versions used in the tutorial
- Visual Studio 2013
- .NET Framework 4.5
- SignalR version 2
Questions and comments
Please leave feedback on how you liked this tutorial and what we could improve in the comments at the bottom of the page. If you have questions that are not directly related to the tutorial, you can post them to the ASP.NET SignalR forum or StackOverflow.com.
When tracing is enabled, a SignalR application creates log entries for events. You can log events from both the client and the server. Tracing on the server logs connection, scaleout provider, and message bus events. Tracing on the client logs connection events. In SignalR 2.1 and later, tracing on the client logs the full content of hub invocation messages.
Contents
Enabling tracing on the server
You enable tracing on the server within the application's configuration file (either App.config or Web.config depending on the type of project.) You specify which categories of events you want to log. In the configuration file, you also specify whether to log the events to a text file, the Windows event log, or a custom log using an implementation of TraceListener.
The server event categories include the following sorts of messages:
| Source | Messages |
|---|---|
| SignalR.SqlMessageBus | SQL Message Bus scaleout provider setup, database operation, error, and timeout events |
| SignalR.ServiceBusMessageBus | Service bus scaleout provider topic creation and subscription, error, and messaging events |
| SignalR.RedisMessageBus | Redis scaleout provider connection, disconnection, and error events |
| SignalR.ScaleoutMessageBus | Scaleout messaging events |
| SignalR.Transports.WebSocketTransport | WebSocket transport connection, disconnection, messaging, and error events |
| SignalR.Transports.ServerSentEventsTransport | ServerSentEvents transport connection, disconnection, messaging, and error events |
| SignalR.Transports.ForeverFrameTransport | ForeverFrame transport connection, disconnection, messaging, and error events |
| SignalR.Transports.LongPollingTransport | LongPolling transport connection, disconnection, messaging, and error events |
| SignalR.Transports.TransportHeartBeat | Transport connection, disconnection, and keepalive events |
| SignalR.ReflectedHubDescriptorProvider | Hub discovery events |
Logging server events to text files
The following code shows how to enable tracing for each category of event. This sample configures the application to log events to text files.
XML server code for enabling tracing
<system.diagnostics>
    <sources>
      <source name="SignalR.SqlMessageBus">
        <listeners>
          <add name="SignalR-Bus" />
        </listeners>
      </source>
      <source name="SignalR.ServiceBusMessageBus">
        <listeners>
          <add name="SignalR-Bus" />
        </listeners>
      </source>
      <source name="SignalR.RedisMessageBus">
        <listeners>
          <add name="SignalR-Bus" />
        </listeners>
      </source>
      <source name="SignalR.ScaleoutMessageBus">
        <listeners>
          <add name="SignalR-Bus" />
        </listeners>
      </source>
      <source name="SignalR.Transports.WebSocketTransport">
        <listeners>
          <add name="SignalR-Transports" />
        </listeners>
      </source>
      <source name="SignalR.Transports.ServerSentEventsTransport">
        <listeners>
          <add name="SignalR-Transports" />
        </listeners>
      </source>
      <source name="SignalR.Transports.ForeverFrameTransport">
        <listeners>
          <add name="SignalR-Transports" />
        </listeners>
      </source>
      <source name="SignalR.Transports.LongPollingTransport">
        <listeners>
          <add name="SignalR-Transports" />
        </listeners>
      </source>
      <source name="SignalR.Transports.TransportHeartBeat">
        <listeners>
          <add name="SignalR-Transports" />
        </listeners>
      </source>
      <source name="SignalR.ReflectedHubDescriptorProvider">
        <listeners>
          <add name="SignalR-Init" />
        </listeners>
      </source>
    </sources>
    <!-- Sets the trace verbosity level -->
    <switches>
      <add name="SignalRSwitch" value="Verbose" />
    </switches>
    <!-- Specifies the trace writer for output -->
    <sharedListeners>
      <!-- Listener for transport events -->
      <add name="SignalR-Transports" type="System.Diagnostics.TextWriterTraceListener" initializeData="transports.log.txt" />
      <!-- Listener for scaleout provider events -->
      <add name="SignalR-Bus" type="System.Diagnostics.TextWriterTraceListener" initializeData="bus.log.txt" />
      <!-- Listener for hub discovery events -->
      <add name="SignalR-Init" type="System.Diagnostics.TextWriterTraceListener" initializeData="init.log.txt" />
    </sharedListeners>
    <trace autoflush="true" />
  </system.diagnostics>
In the code above, the SignalRSwitch entry specifies the TraceLevel used for events sent to the specified log. In this case, it is set to Verbose which means all debugging and tracing messages are logged.
The following output shows entries from the transports.log.txt file for an application using the above configuration file. It shows a new connection, a removed connection, and transport heartbeat events.
SignalR.Transports.TransportHeartBeat Information: 0 : Connection 9aa62c9b-09b3-416c-b367-06520e24f780 is New.
SignalR.Transports.TransportHeartBeat Verbose: 0 : KeepAlive(9aa62c9b-09b3-416c-b367-06520e24f780)
SignalR.Transports.TransportHeartBeat Verbose: 0 : KeepAlive(9aa62c9b-09b3-416c-b367-06520e24f780)
SignalR.Transports.TransportHeartBeat Verbose: 0 : KeepAlive(9aa62c9b-09b3-416c-b367-06520e24f780)
SignalR.Transports.WebSocketTransport Information: 0 : CloseSocket(9aa62c9b-09b3-416c-b367-06520e24f780)
SignalR.Transports.WebSocketTransport Information: 0 : Abort(9aa62c9b-09b3-416c-b367-06520e24f780)
SignalR.Transports.TransportHeartBeat Information: 0 : Removing connection 9aa62c9b-09b3-416c-b367-06520e24f780
SignalR.Transports.WebSocketTransport Information: 0 : End(9aa62c9b-09b3-416c-b367-06520e24f780)
SignalR.Transports.WebSocketTransport Verbose: 0 : DrainWrites(9aa62c9b-09b3-416c-b367-06520e24f780)
SignalR.Transports.WebSocketTransport Information: 0 : CompleteRequest (9aa62c9b-09b3-416c-b367-06520e24f780)
Logging server events to the event log
To log events to the event log rather than a text file, change the values for the entries in the sharedListeners node. The following code shows how to log server events to the event log:
XML server code for logging events to the event log
<sharedListeners>
  <!-- Listener for transport events -->
  <add name="SignalR-Transports" type="System.Diagnostics.EventLogTraceListener" initializeData="SignalRTransportLog" />
  <!-- Listener for scaleout provider events -->
  <add name="SignalR-Bus" type="System.Diagnostics.EventLogTraceListener" initializeData="SignalRScaleoutLog" />
  <!-- Listener for hub discovery events -->
  <add name="SignalR-Init" type="System.Diagnostics.EventLogTraceListener" initializeData="SignalRInitLog" />
</sharedListeners>
The events are logged in the Application log, and are available through the Event Viewer, as shown below:

Note
When using the event log, set the TraceLevel to Error to keep the number of messages manageable.
Enabling tracing in the .NET client (Windows Desktop apps)
The .NET client can log events to the console, a text file, or to a custom log using an implementation of TextWriter.
To enable logging in the .NET client, set the connection's TraceLevel property to a TraceLevels value, and the TraceWriter property to a valid TextWriter instance.
Logging Desktop client events to the console
The following C# code shows how to log events in the .NET client to the console:
var hubConnection = new HubConnection("http://www.contoso.com/");
hubConnection.TraceLevel = TraceLevels.All;
hubConnection.TraceWriter = Console.Out;
IHubProxy stockTickerHubProxy = hubConnection.CreateHubProxy("StockTickerHub");
stockTickerHubProxy.On<Stock>("UpdateStockPrice", stock => Console.WriteLine("Stock update for {0} new price {1}", stock.Symbol, stock.Price));
await hubConnection.Start();
Logging Desktop client events to a text file
The following C# code shows how to log events in the .NET client to a text file:
var hubConnection = new HubConnection("http://www.contoso.com/");
var writer = new StreamWriter("ClientLog.txt");
writer.AutoFlush = true;
hubConnection.TraceLevel = TraceLevels.All;
hubConnection.TraceWriter = writer;
IHubProxy stockTickerHubProxy = hubConnection.CreateHubProxy("StockTickerHub");
stockTickerHubProxy.On<Stock>("UpdateStockPrice", stock => Console.WriteLine("Stock update for {0} new price {1}", stock.Symbol, stock.Price));
await hubConnection.Start();
The following output shows entries from the ClientLog.txt file for an application using the above configuration file. It shows the client connecting to the server, and the hub invoking a client method called addMessage:
19:41:39.9103763 - null - ChangeState(Disconnected, Connecting)
19:41:40.3750726 - dd61fd48-d796-4518-b36b-ec1dcb970d72 - WS Connecting to: ws://localhost:8080/signalr/signalr/connect?transport=webSockets&clientProtocol=1.4&connectionToken=AQAAANCMnd8BFdERjHoAwE%2FCl%2BsBAAAAh8Lp
KH5%2FDkCQeR4ALAwR%2BAAAAAACAAAAAAADZgAAwAAAABAAAADHpCa7wm%2FbOhjluf%2Fm9GA9AAAAAASAAACgAAAAEA
AAAEqRfJihLExRI6tZy7lWRwYoAAAApotSsJXW0OiwEgiUUi0pzhK6oKbz%2BkMeVbezuEDQLnJecM9otFe9PRQAAAAuHK
BlOnPmXt%2FhXV%2Felr1QvC156Q%3D%3D&connectionData=[{"Name":"MyHub"}]
19:41:40.4442923 - dd61fd48-d796-4518-b36b-ec1dcb970d72 - WS: OnMessage({"C":"d-5196BF5C-A,0|B,0|C,1|D,0","S":1,"M":[]})
19:41:40.4874324 - dd61fd48-d796-4518-b36b-ec1dcb970d72 - ChangeState(Connecting, Connected)
19:41:47.4511770 - dd61fd48-d796-4518-b36b-ec1dcb970d72 - WS: OnMessage({"C":"d-5196BF5C-A,1|B,0|C,1|D,0","M":[{"H":"MyHub","M":"addMessage","A":["User One","Hello!"]}]})
19:41:47.4576968 - dd61fd48-d796-4518-b36b-ec1dcb970d72 - WS: OnMessage({"I":"0"})
19:41:50.3959119 - dd61fd48-d796-4518-b36b-ec1dcb970d72 - WS: OnMessage({})
19:41:50.8928084 - dd61fd48-d796-4518-b36b-ec1dcb970d72 - WS: OnMessage({"C":"d-5196BF5C-A,2|B,0|C,1|D,0","M":[{"H":"MyHub","M":"addMessage","A":["User Two","Hello!"]}]})
Enabling tracing in Windows Phone 8 clients
SignalR applications for Windows Phone apps use the same .NET client as desktop apps, but Console.Out and writing to a file with StreamWriter are not available. Instead, you need to create a custom implementation of TextWriter for tracing.
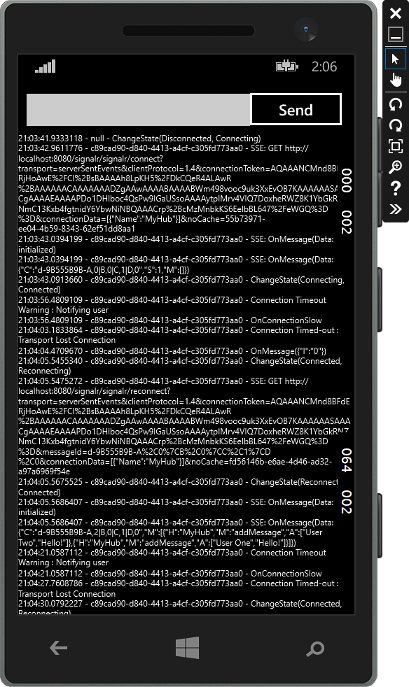
Logging Windows Phone client events to the UI
The SignalR codebase includes a Windows Phone sample that writes trace output to a TextBlock using a custom TextWriter implementation called TextBlockWriter. This class can be found in the samples/Microsoft.AspNet.SignalR.Client.WP8.Samples project. When creating an instance of TextBlockWriter, pass in the current SynchronizationContext, and a StackPanel where it will create a TextBlock to use for trace output:
Connection = new HubConnection(ServerURI);
var writer = new TextBlockWriter(SynchronizationContext.Current, StackPanelConsole);
Connection.TraceWriter = writer;
Connection.TraceLevel = TraceLevels.All;
The trace output will then be written to a new TextBlock created in the StackPanel you passed in:
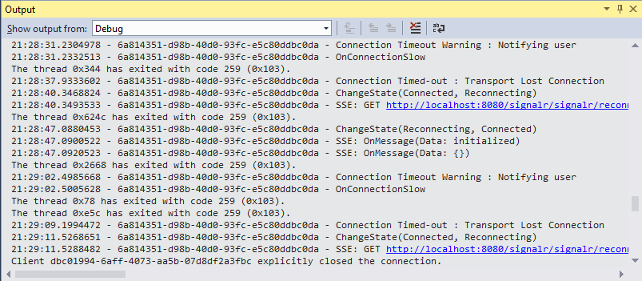
Logging Windows Phone client events to the debug console
To send output to the debug console rather than the UI, create an implementation of TextWriter that writes to the debug window, and assign it to your connection's TraceWriter property:
Connection = new HubConnection(ServerURI);
var writer = new DebugTextWriter();
Connection.TraceWriter = writer;
Connection.TraceLevel = TraceLevels.All;

...

private class DebugTextWriter : TextWriter
{
    private StringBuilder buffer;

    public DebugTextWriter()
    {
        buffer = new StringBuilder();
    }

    public override void Write(char value)
    {
        switch (value)
        {
            case '\n':
                return;
            case '\r':
                Debug.WriteLine(buffer.ToString());
                buffer.Clear();
                return;
            default:
                buffer.Append(value);
                break;
        }
    }

    public override void Write(string value)
    {
        Debug.WriteLine(value);

    }
    #region implemented abstract members of TextWriter
    public override Encoding Encoding
    {
        get { throw new NotImplementedException(); }
    }
    #endregion
}
Trace information will then be written to the debug window in Visual Studio:
Enabling tracing in the JavaScript client
To enable client-side logging on a connection, set the logging property on the connection object before you call the start method to establish the connection.
Client JavaScript code for enabling tracing to the browser console (with the generated proxy)
$.connection.hub.logging = true;
$.connection.hub.start();
Client JavaScript code for enabling tracing to the browser console (without the generated proxy)
var connection = $.hubConnection();
connection.logging = true;
connection.start();
When tracing is enabled, the JavaScript client logs events to the browser console. To access the browser console, see Monitoring Transports.
The following screenshot shows a SignalR JavaScript client with tracing enabled. It shows connection and hub invocation events in the browser console:

Feedback
Coming soon: Throughout 2024 we will be phasing out GitHub Issues as the feedback mechanism for content and replacing it with a new feedback system. For more information see: https://aka.ms/ContentUserFeedback.
Submit and view feedback for