Add a bubble layer to a map in the iOS SDK (Preview)
This article shows you how to render point data from a data source as a bubble layer on a map. Bubble layers render points as circles on the map with a fixed point radius.
Note
Azure Maps iOS SDK retirement
The Azure Maps Native SDK for iOS is now deprecated and will be retired on 3/31/25. To avoid service disruptions, migrate to the Azure Maps Web SDK by 3/31/25. For more information, see The Azure Maps iOS SDK migration guide.
Tip
Bubble layers by default will render the coordinates of all geometries in a data source. To limit the layer so that it only renders point geometry features, set the filter option of the layer to NSPredicate(format: "%@ == \"Point\"", NSExpression.geometryTypeAZMVariable). If you want to include MultiPoint features as well, use NSCompoundPredicate.
Prerequisites
Be sure to complete the steps in the Quickstart: Create an iOS app document. Code blocks in this article can be inserted into the viewDidLoad function of ViewController.
Add a bubble layer
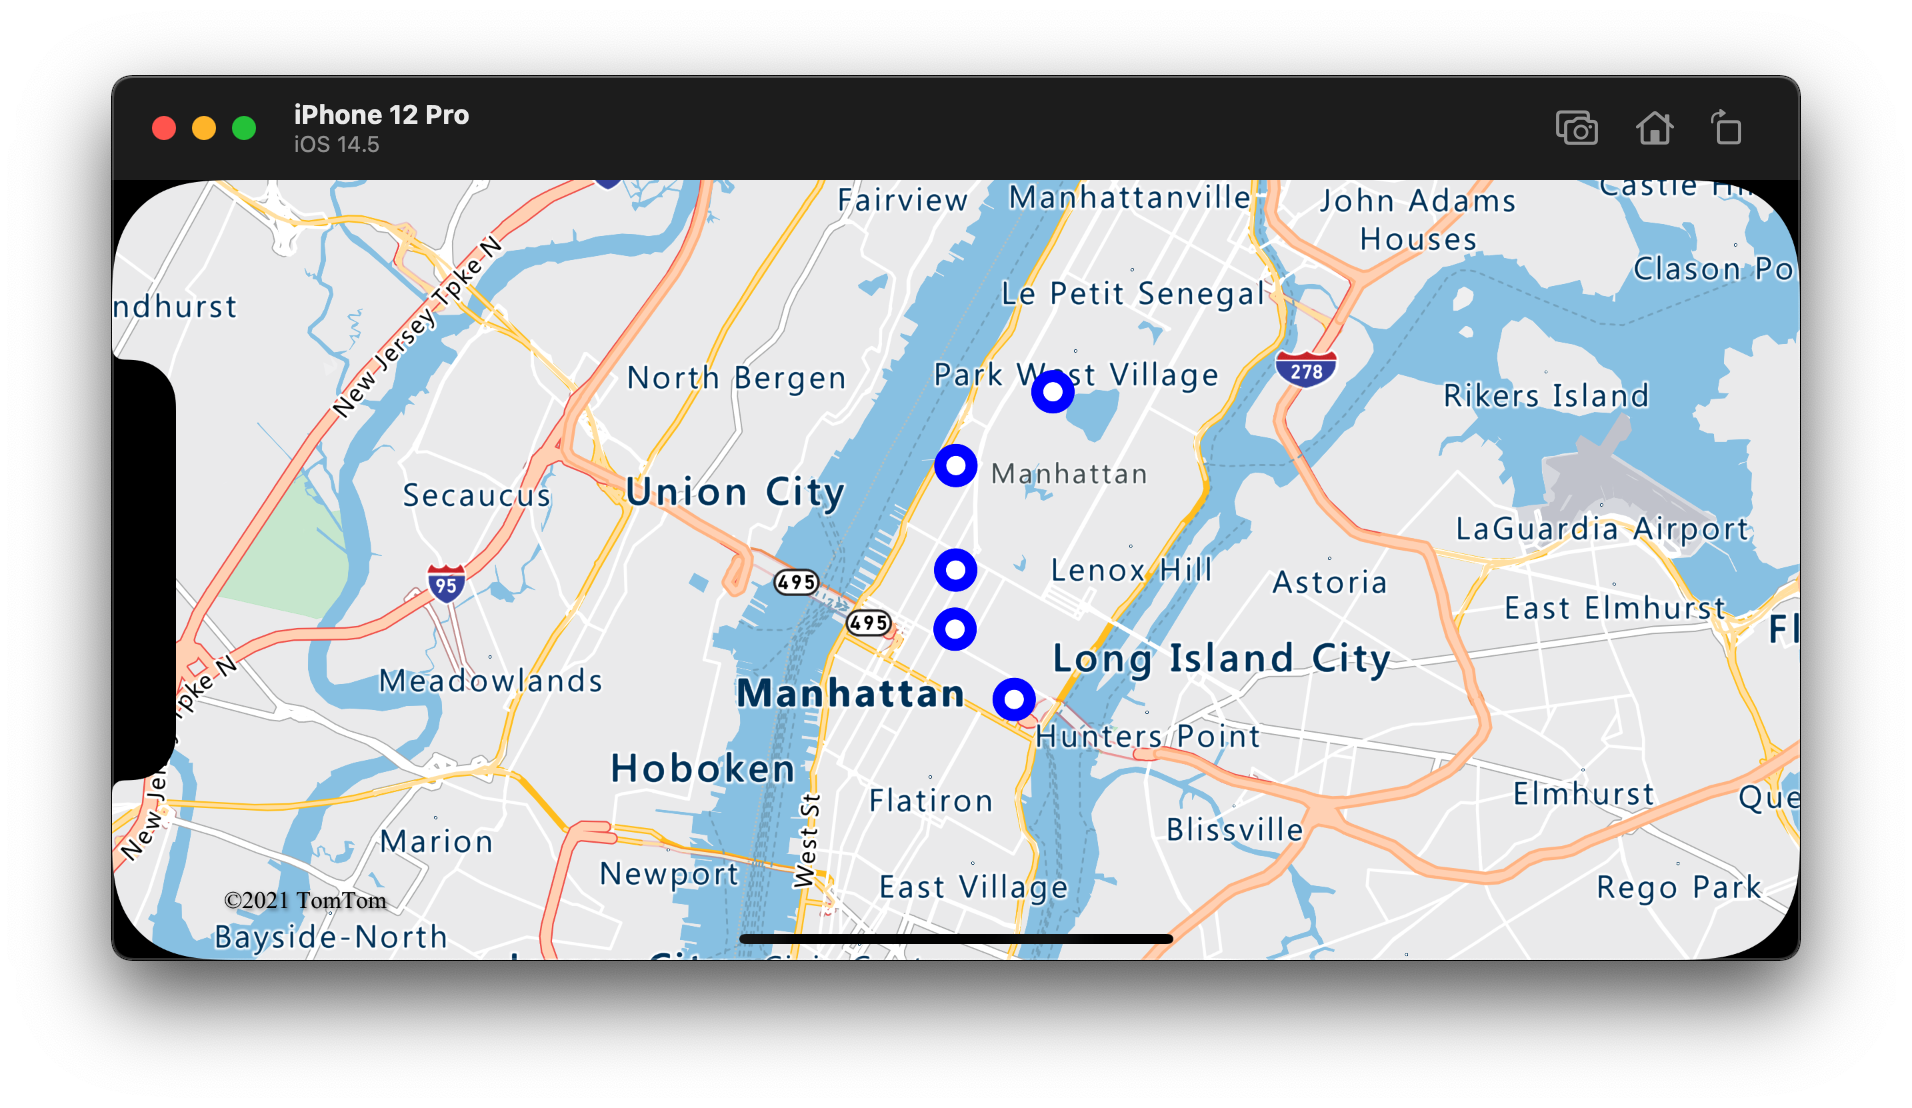
The following code loads an array of points into a data source. Then, it connects the data points are to a bubble layer. The bubble layer renders the radius of each bubble with five points and a fill color of white. And, a stroke color of blue, and a stroke width of six points.
// Create a data source and add it to the map.
let source = DataSource()
map.sources.add(source)

// Create point locations.
let points = [
    Point(CLLocationCoordinate2D(latitude: 40.75773, longitude: -73.985708)),
    Point(CLLocationCoordinate2D(latitude: 40.76542, longitude: -73.985600)),
    Point(CLLocationCoordinate2D(latitude: 40.77900, longitude: -73.985550)),
    Point(CLLocationCoordinate2D(latitude: 40.74859, longitude: -73.975550)),
    Point(CLLocationCoordinate2D(latitude: 40.78859, longitude: -73.968900))
]

// Add multiple points to the data source.
source.add(geometries: points)

// Create a bubble layer to render the filled in area of the circle, and add it to the map.
let layer = BubbleLayer(source: source, options: [
    .bubbleRadius(5),
    .bubbleColor(.white),
    .bubbleStrokeColor(.blue),
    .bubbleStrokeWidth(6)
])
map.layers.addLayer(layer)
The following screenshot shows the above code renders points in a bubble layer.
Show labels with a bubble layer
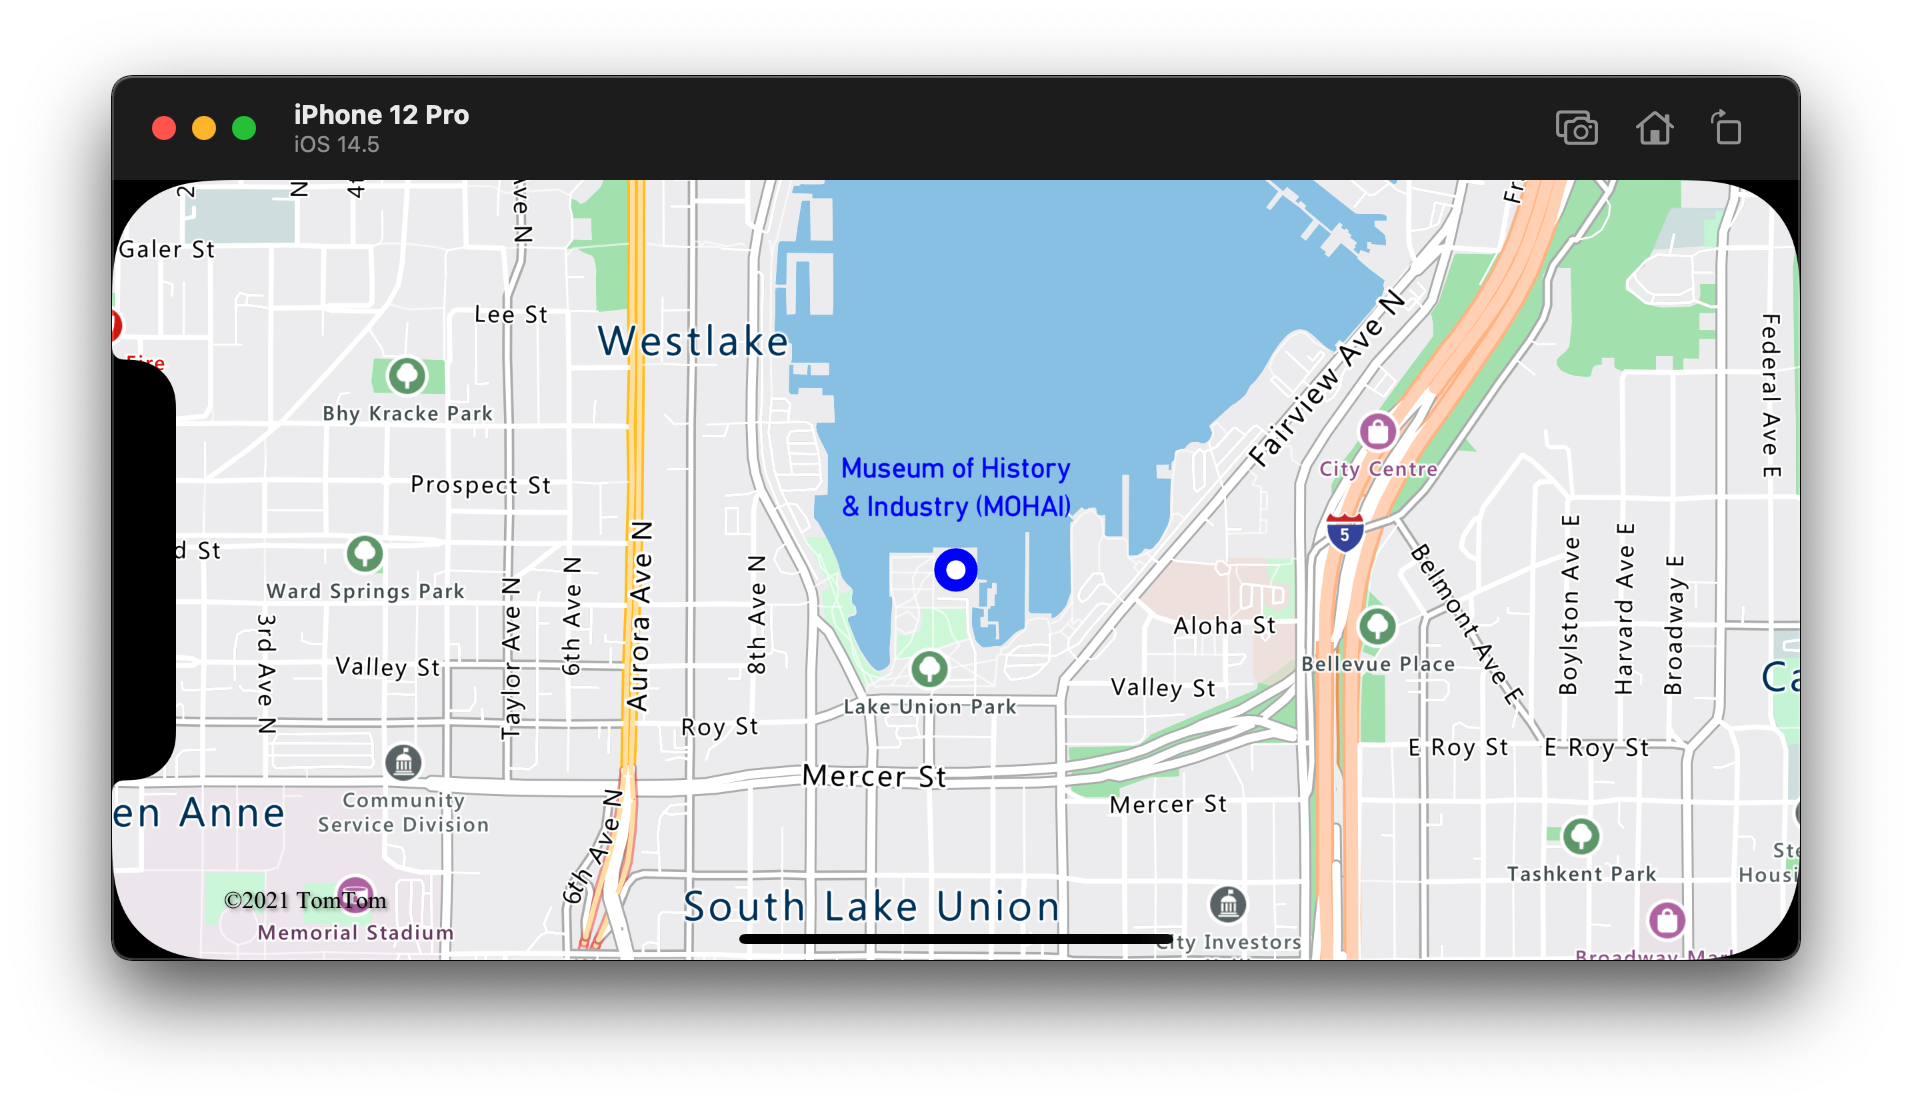
This code shows you how to use a bubble layer to render a point on the map. And, how to use a symbol layer to render a label. To hide the icon of the symbol layer, set the iconImage option to nil.
// Create a data source and add it to the map.
let source = DataSource()
map.sources.add(source)

// Add a data point to the map.
source.add(geometry: Point(CLLocationCoordinate2D(latitude: 47.627631, longitude: -122.336641)))

// Add a bubble layer.
map.layers.addLayer(
    BubbleLayer(source: source, options: [
        .bubbleRadius(5),
        .bubbleColor(.white),
        .bubbleStrokeColor(.blue),
        .bubbleStrokeWidth(6)
    ])
)

// Add a symbol layer to display text, hide the icon image.
map.layers.addLayer(
    SymbolLayer(source: source, options: [
        .iconImage(nil),
        .textField("Museum of History & Industry (MOHAI)"),
        .textColor(.blue),
        .textOffset(CGVector(dx: 0, dy: -2.2))
    ])
)
The following screenshot shows the above code rendering a point in a bubble layer and a text label for the point with a symbol layer.
Additional information
See the following articles for more code samples to add to your maps:
Feedback
Coming soon: Throughout 2024 we will be phasing out GitHub Issues as the feedback mechanism for content and replacing it with a new feedback system. For more information see: https://aka.ms/ContentUserFeedback.
Submit and view feedback for