Add a bubble layer
The Bubble layer renders location data as scaled circles on the map.
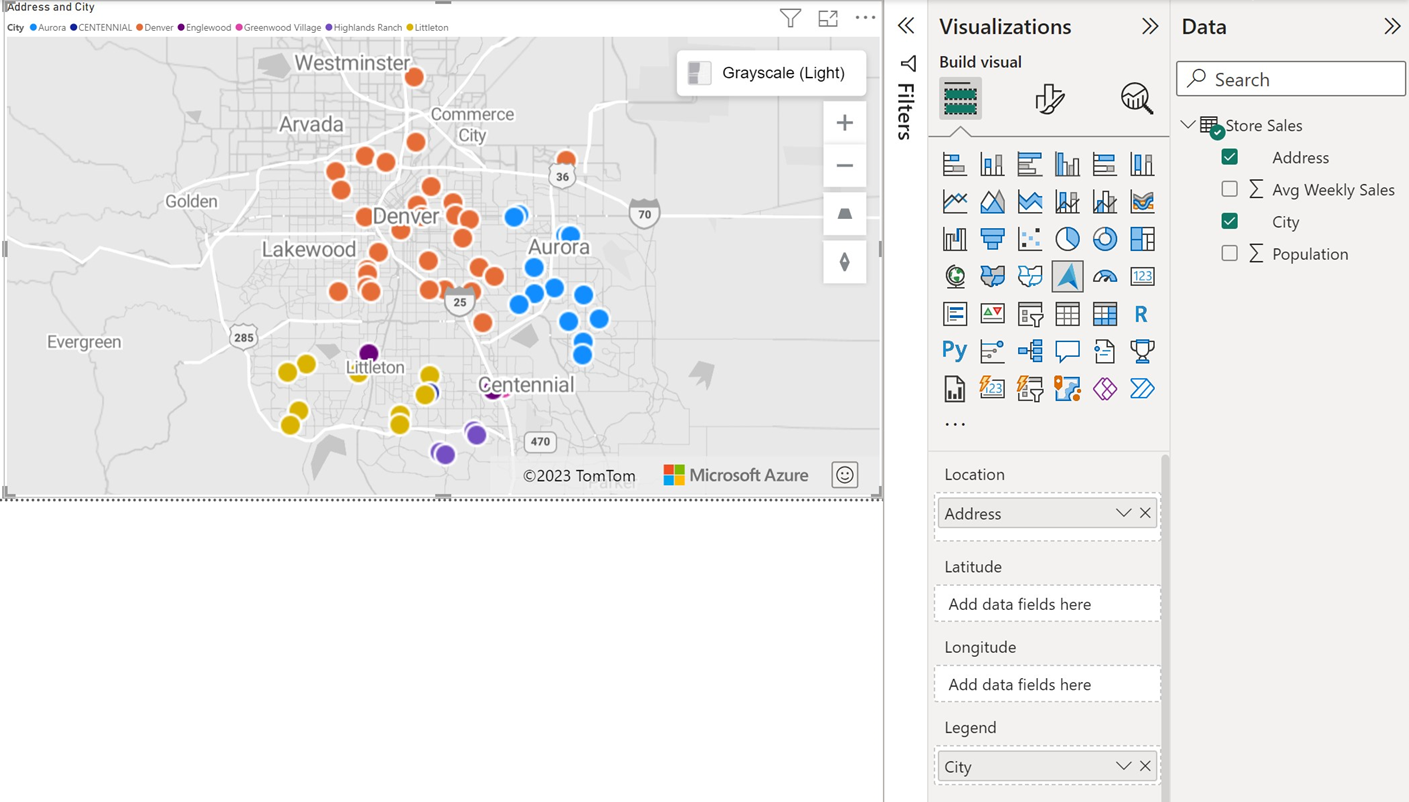
Initially all bubbles have the same fill color. If a field is passed into the Legend bucket of the Fields pane, the bubbles are colored based on their categorization. The outline of the bubbles is white be default but can be changed to a new color or by enabling the high-contrast outline option. The High-contrast outline option dynamically assigns an outline color that is a high-contrast variant of the fill color. This helps to ensure the bubbles are clearly visible regardless of the style of the map. The following are the primary settings in the Format pane that are available in the Bubble layer section.
| Setting | Description |
|---|---|
| Size | The size of each bubble. This option is hidden when a field is passed into the Size bucket of the Fields pane. More options appear as outlined in the Bubble size scaling section further down in this article. |
| Range scaling | Used to define how the bubble layer scales the bubbles. • Magnitude: Bubble size scales by magnitude. Negative values are automatically converted to positive values. • DataRange: Bubble size scales from min-of-data to max-of-data. There's no anchoring to zero. • Automatic: Bubble size scales automatically into one of the two types, as follows: • Magnitude: Positive or negative only data. • DataRange: data that contains both positive and negative values. • (Deprecated): Applies to reports created prior to the range scaling property, to provide backward-compatibility. It's recommended that you change this to use any one of the three preceding options. |
| Shape | Transparency. The fill transparency of each bubble. |
| Color | Fill color of each bubble. This option is hidden when a field is passed into the Legend bucket of the Fields pane and a separate Data colors section appears in the Format pane. |
| Border | Settings for the border include color, width, transparency and blur. • Color specifies the color that outlines the bubble. This option is hidden when the High-contrast outline option is enabled. • Width specifies the width of the outline in pixels. • Transparency specifies the transparency of each bubble. • Blur specifies the amount of blur applied to the outline of the bubble. A value of one blurs the bubbles such that only the center point has no transparency. A value of 0 apply any blur effect. |
| Zoom | Settings for the zoom property include scale, maximum and minimum. • (Deprecated) Zoom scale is the amount the bubbles should scale relative to the zoom level. A zoom scale of one means no scaling. Large values make bubbles smaller when zoomed out and larger when zoomed in. This helps to reduce the clutter on the map when zoomed out, yet ensures points stand out more when zoomed in. A value of 1 doesn't apply any scaling. • Maximum zoom level tiles are available. • Minimum zoom level tiles are available. |
| Options | Settings for the options property include pitch alignment and layer position. • Pitch alignment specifies how the bubbles look when the map is pitched. • layer position specifies the position of the layer relative to other map layers. |
Bubble size scaling
Note
Bubble size scaling retirement
The Power BI Visual bubble layer Bubble size scaling settings were deprecated starting in the September 2023 release of Power BI. You can no longer create reports using these settings, but existing reports will continue to work. It is recomended that you upgrade existing reports that use these settings to the new range scaling property. To upgrade to the new range scaling property, select the desired option in the Range scaling drop-down list:
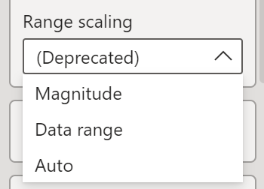
For more information on the range scaling settings, see range scaling in the previous section.
If a field is passed into the Size bucket of the Fields pane, the bubbles are scaled relatively to the measure value of each data point. The Size option in the Bubble layer section of the Format pane disappears when a field is passed into the Size bucket, as the bubbles have their radii scaled between a min and max value. The following options appear in the Bubble layer section of the Format pane when a Size bucket has a field specified.
| Setting | Description |
|---|---|
| Min size | Minimum bubble size when scaling the data. |
| Max size | Maximum bubble size when scaling the data. |
| Size scaling method | Scaling algorithm used to determine relative bubble size. • Linear: Range of input data linearly mapped to the min and max size. (default) • Log: Range of input data logarithmically mapped to the min and max size. • Cubic-Bezier: Specify X1, Y1, X2, Y2 values of a Cubic-Bezier curve to create a custom scaling method. |
When the Size scaling method is set to Log, the following options are made available.
| Setting | Description |
|---|---|
| Log scale | The logarithmic scale to apply when calculating the size of the bubbles. |
When the Size scaling method is set to Cubic-Bezier, the following options are made available to customize the scaling curve.
| Setting | Description |
|---|---|
| X1 | X1 parameter of a cubic Bezier curve. |
| Y1 | X2 parameter of a cubic Bezier curve. |
| X2 | Y1 parameter of a cubic Bezier curve. |
| Y2 | Y2 parameter of a cubic Bezier curve. |
Tip
https://cubic-bezier.com/ has a handy tool for creating the parameters for Cubic-Bezier curves.
Category labels
When the bubble layer displays on a map, the Category labels settings become active in the Format visual pane.

The Category labels settings enable you to customize font setting such as font type, size and color as well as the category labels background color and transparency.

Next steps
Change how your data is displayed on the map:
Add more context to the map:
Customize the visual:
Feedback
Coming soon: Throughout 2024 we will be phasing out GitHub Issues as the feedback mechanism for content and replacing it with a new feedback system. For more information see: https://aka.ms/ContentUserFeedback.
Submit and view feedback for