Contextual on-object interaction with Azure Maps Power BI visual (preview)
The Azure Maps Power BI Visual now features on-object interaction, an intuitive and efficient way to update the formatting of any element on the map. With on-object interaction, you can interact with the Azure Maps Power BI Visual like you interact with other Microsoft products or web applications.
Use on-object interaction in your Power BI Visual
On-object interaction can be used to edit chart titles, legends, bubble layers, Map style and Map controls.
Formatting objects on the map
A context sensitive menu appears when you right-click an object in the map, with formatting options for that object, which eliminates the need to search for the correct setting in the Format pane.
To exit edit mode, select the Esc key or select anywhere on the canvas outside of the Azure Maps Visual.

Edit a chart tile or legend
To edit chart tile or legend, you can right-click on the text to edit title or font style/size.

The format pane
While you're using on-object interaction, the format pane is expanded, and the corresponding card appears to enable a review of the completed settings.

You may also use on-object interaction on the bubble layer. By selecting bubbles, you can set bubble layer's position or its formatting such as size or color.

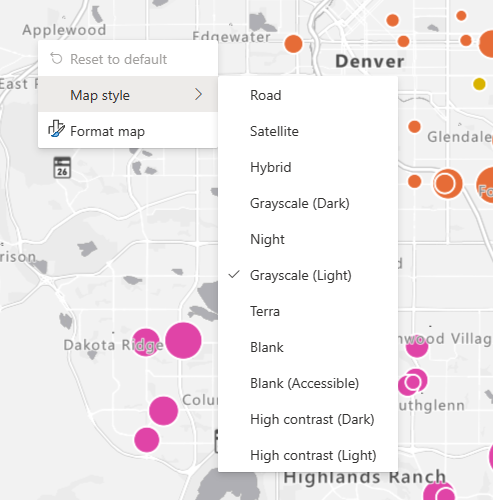
Select Map styles
You can also select the map background to bring up a context menu showing all available map styles such as road, satellite, hybrid etc.
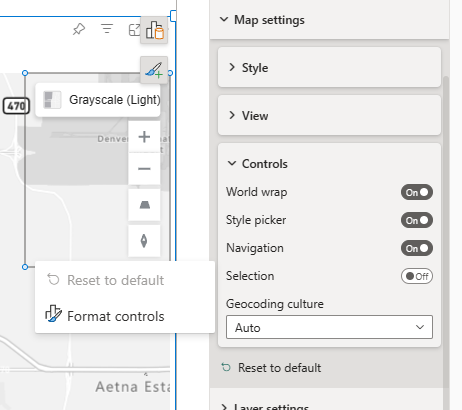
On-object interaction applies to the Map control as well.
The on-object interaction feature available in Azure Maps Visual is a user-friendly and innovative method for adjusting map settings. Additionally, other Power BI Visuals also offer on-object interaction capabilities, providing users with efficient tools to personalize their Power BI reports.
Next steps
Change how your data is displayed on the map:
Feedback
Coming soon: Throughout 2024 we will be phasing out GitHub Issues as the feedback mechanism for content and replacing it with a new feedback system. For more information see: https://aka.ms/ContentUserFeedback.
Submit and view feedback for