Define Azure Monitor Agent network settings
Azure Monitor Agent supports connecting by using direct proxies, Log Analytics gateway, and private links. This article explains how to define network settings and enable network isolation for Azure Monitor Agent.
Virtual network service tags
Azure Monitor Agent supports Azure virtual network service tags. Both AzureMonitor and AzureResourceManager tags are required.
Azure Virtual network service tags can be used to define network access controls on network security groups, Azure Firewall, and user-defined routes. Use service tags in place of specific IP addresses when you create security rules and routes. For scenarios where Azure virtual network service tags cannot be used, the Firewall requirements are given below.
Firewall requirements
| Cloud | Endpoint | Purpose | Port | Direction | Bypass HTTPS inspection | Example |
|---|---|---|---|---|---|---|
| Azure Commercial | global.handler.control.monitor.azure.com | Access control service | Port 443 | Outbound | Yes | - |
| Azure Commercial | <virtual-machine-region-name>.handler.control.monitor.azure.com |
Fetch data collection rules for specific machine | Port 443 | Outbound | Yes | westus2.handler.control.monitor.azure.com |
| Azure Commercial | <log-analytics-workspace-id>.ods.opinsights.azure.com |
Ingest logs data | Port 443 | Outbound | Yes | 1234a123-aa1a-123a-aaa1-a1a345aa6789.ods.opinsights.azure.com |
| Azure Commercial | management.azure.com | Only needed if sending time series data (metrics) to Azure Monitor Custom metrics database | Port 443 | Outbound | Yes | - |
| Azure Commercial | <virtual-machine-region-name>.monitoring.azure.com |
Only needed if sending time series data (metrics) to Azure Monitor Custom metrics database | Port 443 | Outbound | Yes | westus2.monitoring.azure.com |
| Azure Commercial | <data-collection-endpoint>.<virtual-machine-region-name>.ingest.monitor.azure.com |
Only needed if sending data to Log Analytics Custom Logs table | Port 443 | Outbound | Yes | 275test-01li.eastus2euap-1.canary.ingest.monitor.azure.com |
| Azure Government | Replace '.com' above with '.us' | Same as above | Same as above | Same as above | Same as above | |
| Microsoft Azure operated by 21Vianet | Replace '.com' above with '.cn' | Same as above | Same as above | Same as above | Same as above |
Note
If you use private links on the agent, you must only add the private data collection endpoints (DCEs). The agent does not use the non-private endpoints listed above when using private links/data collection endpoints. The Azure Monitor Metrics (custom metrics) preview isn't available in Azure Government and Azure operated by 21Vianet clouds.
Proxy configuration
If the machine connects through a proxy server to communicate over the internet, review the following requirements to understand the network configuration required.
The Azure Monitor Agent extensions for Windows and Linux can communicate either through a proxy server or a Log Analytics gateway to Azure Monitor by using the HTTPS protocol. Use it for Azure virtual machines, Azure virtual machine scale sets, and Azure Arc for servers. Use the extensions settings for configuration as described in the following steps. Both anonymous and basic authentication by using a username and password are supported.
Important
Proxy configuration isn't supported for Azure Monitor Metrics (public preview) as a destination. If you're sending metrics to this destination, it will use the public internet without any proxy.
Use this flowchart to determine the values of the
SettingsandProtectedSettingsparameters first.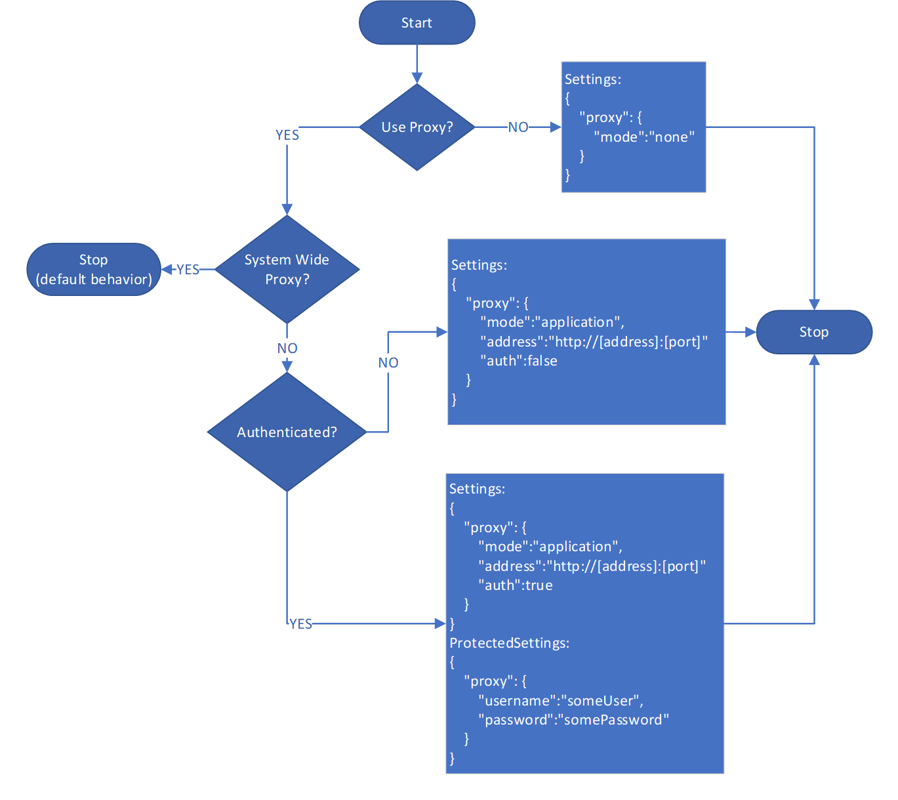
Note
Setting Linux system proxy via environment variables such as
http_proxyandhttps_proxyis only supported using Azure Monitor Agent for Linux version 1.24.2 and above. For the ARM template, if you have proxy configuration please follow the ARM template example below declaring the proxy setting inside the ARM template. Additionally, a user can set "global" environment variables that get picked up by all systemd services via the DefaultEnvironment variable in /etc/systemd/system.conf.After you determine the
SettingsandProtectedSettingsparameter values, provide these other parameters when you deploy Azure Monitor Agent. Use PowerShell commands, as shown in the following examples:

$settingsString = '{"proxy":{"mode":"application","address":"http://[address]:[port]","auth": "true"}}';
$protectedSettingsString = '{"proxy":{"username":"[username]","password": "[password]"}}';
Set-AzVMExtension -ExtensionName AzureMonitorWindowsAgent -ExtensionType AzureMonitorWindowsAgent -Publisher Microsoft.Azure.Monitor -ResourceGroupName <resource-group-name> -VMName <virtual-machine-name> -Location <location> -TypeHandlerVersion <type-handler-version> -SettingString $settingsString -ProtectedSettingString $protectedSettingsString
Log Analytics gateway configuration
- Follow the preceding instructions to configure proxy settings on the agent and provide the IP address and port number that correspond to the gateway server. If you've deployed multiple gateway servers behind a load balancer, the agent proxy configuration is the virtual IP address of the load balancer instead.
- Add the configuration endpoint URL to fetch data collection rules to the allowlist for the gateway
Add-OMSGatewayAllowedHost -Host global.handler.control.monitor.azure.comAdd-OMSGatewayAllowedHost -Host <gateway-server-region-name>.handler.control.monitor.azure.com. (If you're using private links on the agent, you must also add the data collection endpoints.) - Add the data ingestion endpoint URL to the allowlist for the gateway
Add-OMSGatewayAllowedHost -Host <log-analytics-workspace-id>.ods.opinsights.azure.com. - Restart the OMS Gateway service to apply the changes
Stop-Service -Name <gateway-name>andStart-Service -Name <gateway-name>.
Next steps
Feedback
Coming soon: Throughout 2024 we will be phasing out GitHub Issues as the feedback mechanism for content and replacing it with a new feedback system. For more information see: https://aka.ms/ContentUserFeedback.
Submit and view feedback for