Collect IIS logs with Azure Monitor Agent
The Internet Information Service (IIS) logs data to the local disk of Windows machines. This article explains how to collect IIS logs from monitored machines with Azure Monitor Agent by creating a data collection rule (DCR).
Prerequisites
To complete this procedure, you need:
Log Analytics workspace where you have at least contributor rights.
One or two data collection endpoints, depending on whether your virtual machine and Log Analytics workspace are in the same region.
For more information, see How to set up data collection endpoints based on your deployment.
Permissions to create Data Collection Rule objects in the workspace.
A VM, Virtual Machine Scale Set, or Arc-enabled on-premises server that runs IIS.
- An IIS log file in W3C format must be stored on the local drive of the machine on which Azure Monitor Agent is running.
- Each entry in the log file must be delineated with an end of line.
- The log file must not allow circular logging, log rotation where the file is overwritten with new entries, or renaming where a file is moved and a new file with the same name is opened.
Create data collection rule to collect IIS logs
The data collection rule defines:
- Which source log files Azure Monitor Agent scans for new events.
- How Azure Monitor transforms events during ingestion.
- The destination Log Analytics workspace and table to which Azure Monitor sends the data.
You can define a data collection rule to send data from multiple machines to multiple Log Analytics workspaces, including workspaces in a different region or tenant. Create the data collection rule in the same region as your Analytics workspace.
Note
To send data across tenants, you must first enable Azure Lighthouse.
To create the data collection rule in the Azure portal:
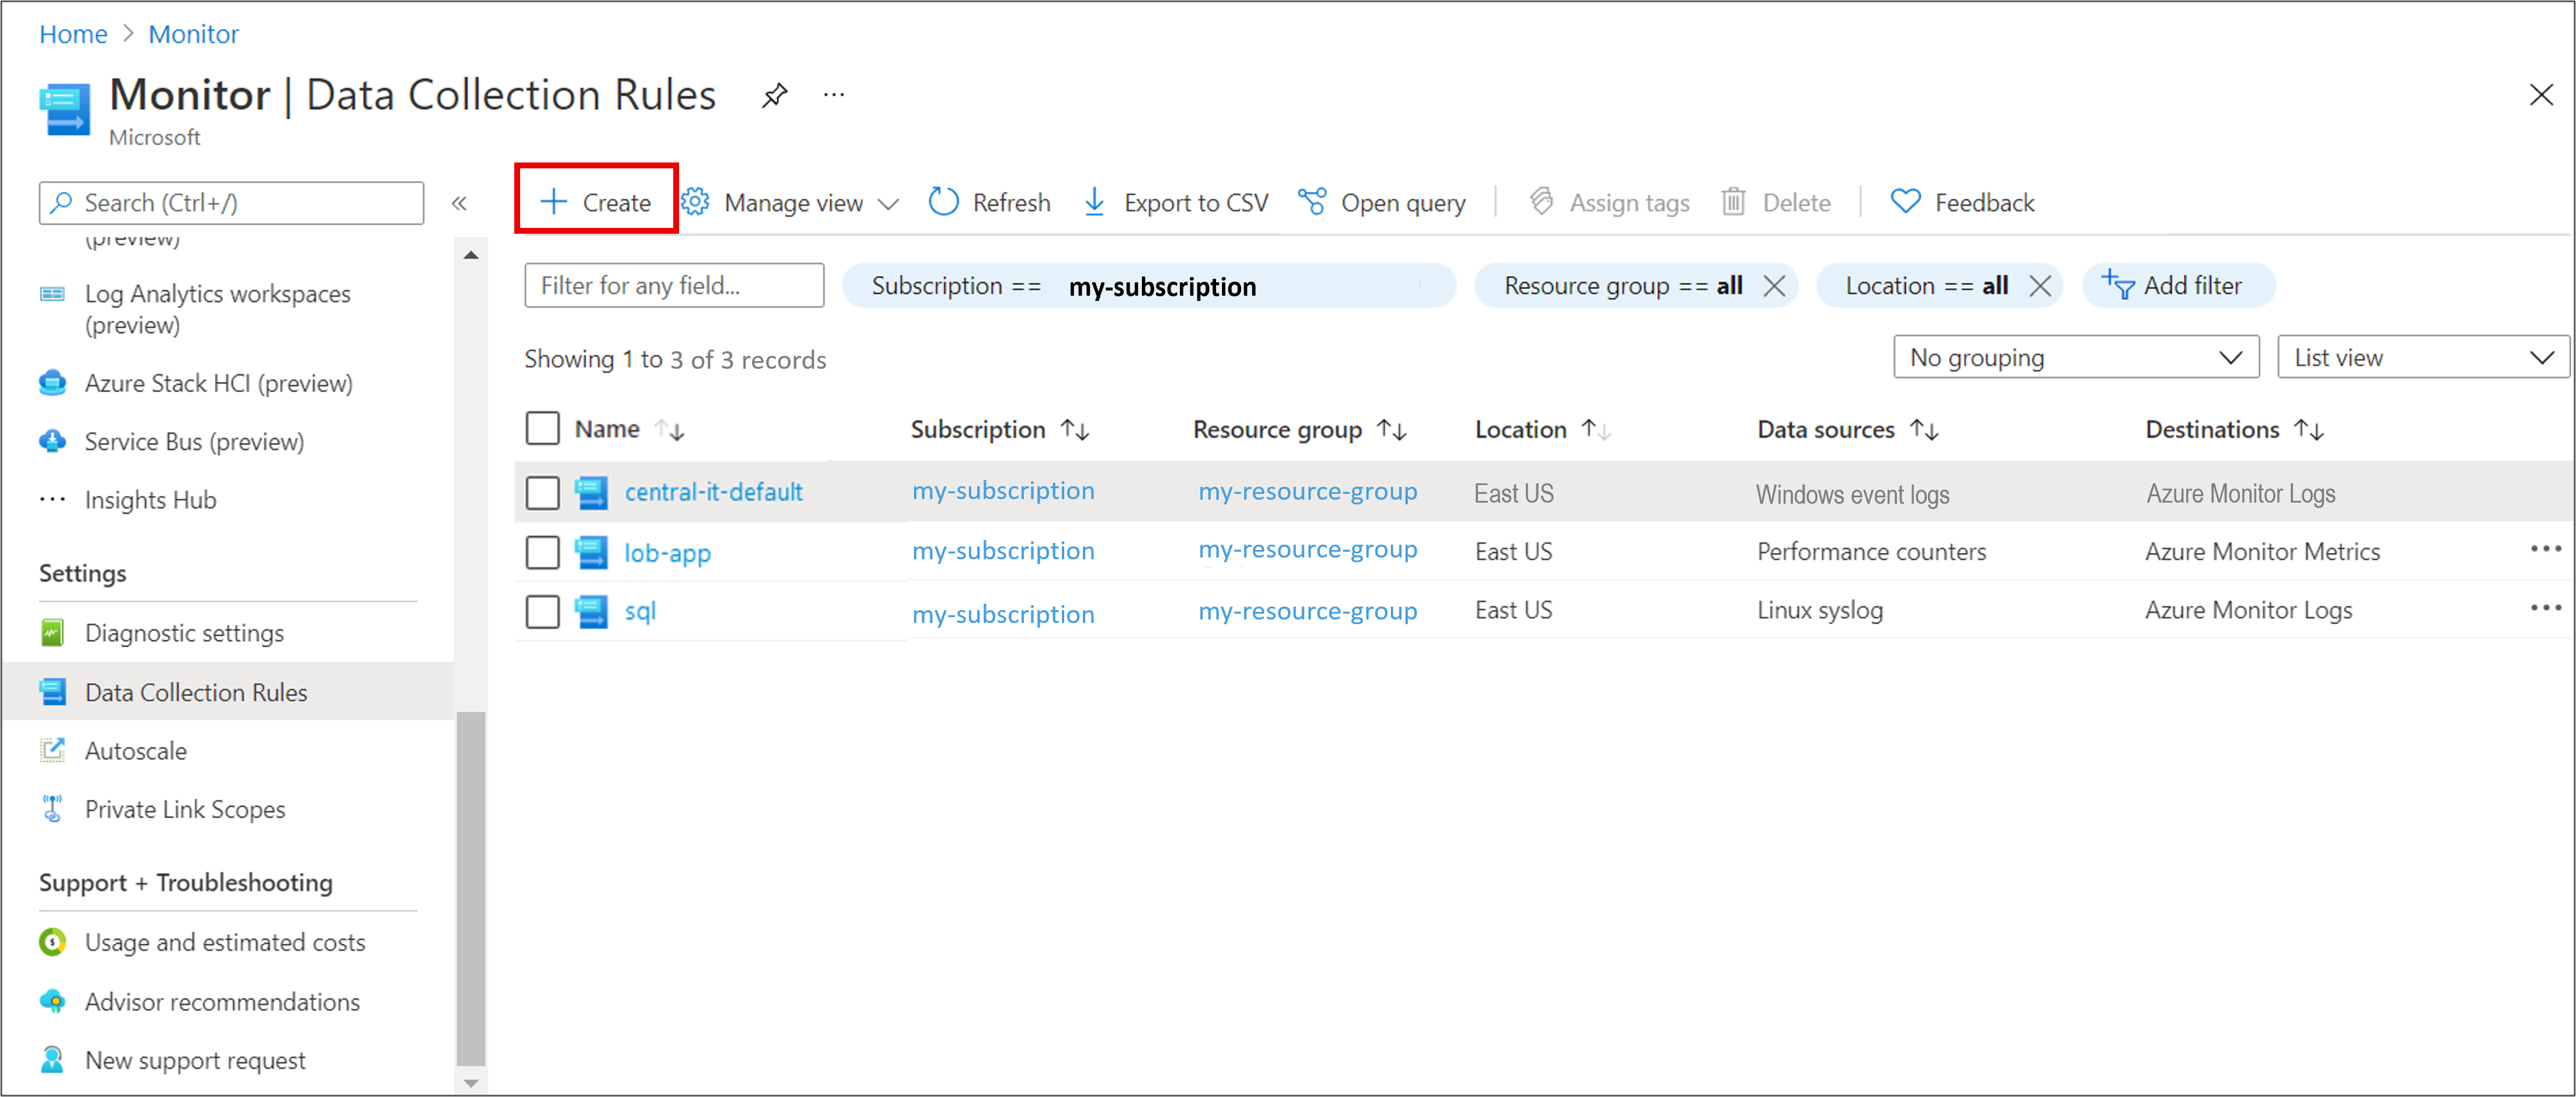
On the Monitor menu, select Data Collection Rules.
Select Create to create a new data collection rule and associations.
Enter a Rule name and specify a Subscription, Resource Group, Region, Platform Type, and Data collection endpoint:
- Region specifies where the DCR will be created. The virtual machines and their associations can be in any subscription or resource group in the tenant.
- Platform Type specifies the type of resources this rule can apply to. The Custom option allows for both Windows and Linux types.
- Data Collection Endpoint specifies the data collection endpoint used to collect data. This data collection endpoint must be in the same region as the Log Analytics workspace. For more information, see How to set up data collection endpoints based on your deployment.

On the Resources tab:
Select + Add resources and associate resources to the data collection rule. Resources can be virtual machines, Virtual Machine Scale Sets, and Azure Arc for servers. The Azure portal installs Azure Monitor Agent on resources that don't already have it installed.
Important
The portal enables system-assigned managed identity on the target resources, along with existing user-assigned identities, if there are any. For existing applications, unless you specify the user-assigned identity in the request, the machine defaults to using system-assigned identity instead.
Select Enable Data Collection Endpoints.
Select a data collection endpoint for each of the virtual machines associate to the data collection rule.
This data collection endpoint sends configuration files to the virtual machine and must be in the same region as the virtual machine. For more information, see How to set up data collection endpoints based on your deployment.

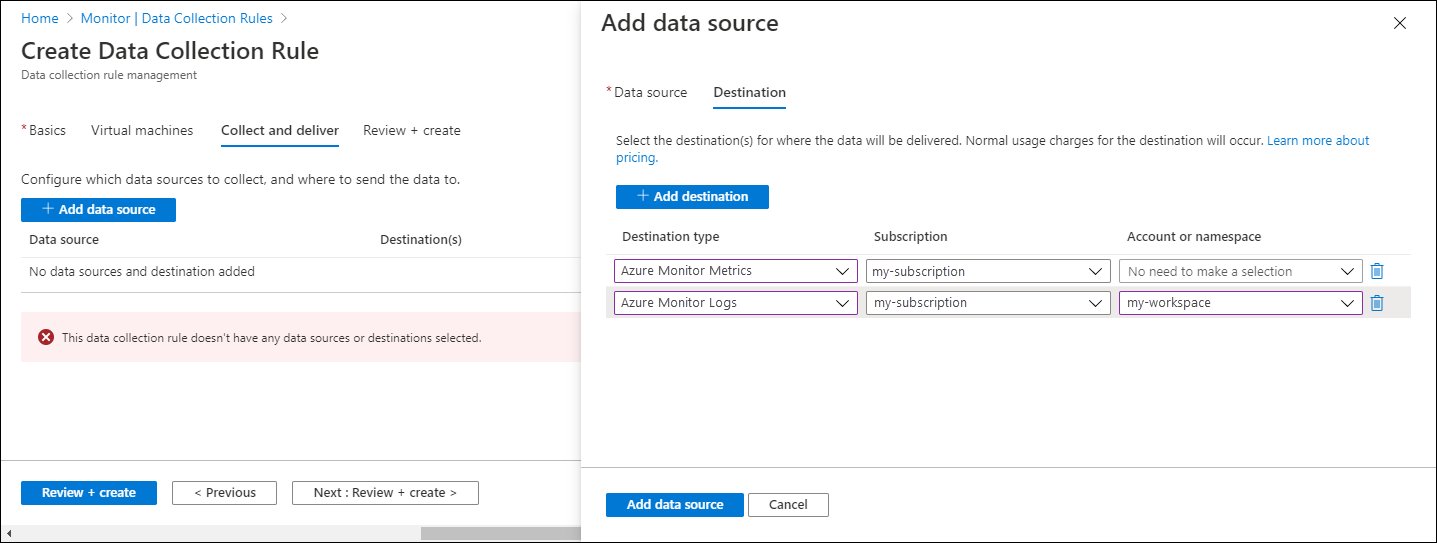
On the Collect and deliver tab, select Add data source to add a data source and set a destination.
Select IIS Logs.

Specify a file pattern to identify the directory where the log files are located.
On the Destination tab, add a destination for the data source.
Select Review + create to review the details of the data collection rule and association with the set of virtual machines.
Select Create to create the data collection rule.


Note
It can take up to 5 minutes for data to be sent to the destinations after you create the data collection rule.
Sample log queries
Count the IIS log entries by URL for the host www.contoso.com.
W3CIISLog
| where csHost=="www.contoso.com"
| summarize count() by csUriStem
Review the total bytes received by each IIS machine.
W3CIISLog
| summarize sum(csBytes) by Computer
Sample alert rule
Create an alert rule on any record with a return status of 500.
W3CIISLog
| where scStatus==500
| summarize AggregatedValue = count() by Computer, bin(TimeGenerated, 15m)
Troubleshoot
Use the following steps to troubleshoot collection of IIS logs.
Check if any IIS logs have been received
Start by checking if any records have been collected for your IIS logs by running the following query in Log Analytics. If the query doesn't return records, check the other sections for possible causes. This query looks for entires in the last two days, but you can modify for another time range.
W3CIISLog
| where TimeGenerated > ago(48h)
| order by TimeGenerated desc
Verify that the agent is sending heartbeats successfully
Verify that Azure Monitor agent is communicating properly by running the following query in Log Analytics to check if there are any records in the Heartbeat table.
Heartbeat
| where TimeGenerated > ago(24h)
| where Computer has "<computer name>"
| project TimeGenerated, Category, Version
| order by TimeGenerated desc
Verify that IIS logs are being created
Look at the timestamps of the log files and open the latest to see that latest timestamps are present in the log files. The default location for IIS log files is C:\inetpub\logs\LogFiles\W3SVC1.

Verify that you specified the correct log location in the data collection rule
The data collection rule will have a section similar to the following. The logDirectories element specifies the path to the log file to collect from the agent computer. Check the agent computer to verify that this is correct.
    "dataSources": [
    {
            "configuration": {
                "logDirectories": ["C:\\scratch\\demo\\W3SVC1"]
            },
            "id": "myIisLogsDataSource",
            "kind": "iisLog",
            "streams": [{
                    "stream": "ONPREM_IIS_BLOB_V2"
                }
            ],
            "sendToChannels": ["gigl-dce-6a8e34db54bb4b6db22d99d86314eaee"]
        }
    ]
This directory should correspond to the location of the IIS logs on the agent machine.

Verify that the IIS logs are W3C formatted
Open IIS Manager and verify that the logs are being written in W3C format.

Open the IIS log file on the agent machine to verify that logs are in W3C format.

Note
The X-Forwarded-For custom field is not supported at this time. If this is a critical field, you can collect the IIS logs as a custom text log.
Next steps
Learn more about:
Feedback
Coming soon: Throughout 2024 we will be phasing out GitHub Issues as the feedback mechanism for content and replacing it with a new feedback system. For more information see: https://aka.ms/ContentUserFeedback.
Submit and view feedback for