Collect Syslog events with Azure Monitor Agent
Caution
This article references CentOS, a Linux distribution that is nearing End Of Life (EOL) status. Please consider your use and planning accordingly. For more information, see the CentOS End Of Life guidance.
Syslog is an event logging protocol that's common to Linux. You can use the Syslog daemon that's built in to Linux devices and appliances to collect local events of the types you specify. Then you can have it send those events to a Log Analytics workspace. Applications send messages that might be stored on the local machine or delivered to a Syslog collector.
When the Azure Monitor agent for Linux is installed, it configures the local Syslog daemon to forward messages to the agent when Syslog collection is enabled in data collection rules (DCRs). Azure Monitor Agent then sends the messages to an Azure Monitor or Log Analytics workspace where a corresponding Syslog record is created in a Syslog table.


The following facilities are supported with the Syslog collector:
- None
- Kern
- user
- daemon
- auth
- syslog
- lpr
- news
- uucp
- ftp
- ntp
- audit
- alert
- mark
- local0
- local1
- local2
- local3
- local4
- local5
- local6
- local7
For some device types that don't allow local installation of Azure Monitor Agent, the agent can be installed instead on a dedicated Linux-based log forwarder. The originating device must be configured to send Syslog events to the Syslog daemon on this forwarder instead of the local daemon. For more information, see the Sentinel tutorial.
Configure Syslog
The Azure Monitor Agent for Linux only collects events with the facilities and severities that are specified in its configuration. You can configure Syslog through the Azure portal or by managing configuration files on your Linux agents.
Configure Syslog in the Azure portal
Configure Syslog from the Data Collection Rules menu of Azure Monitor. This configuration is delivered to the configuration file on each Linux agent.
- Select Add data source.
- For Data source type, select Linux syslog.
You can collect Syslog events with a different log level for each facility. By default, all Syslog facility types are collected. If you don't want to collect, for example, events of auth type, select NONE in the Minimum log level list box for auth facility and save the changes. If you need to change the default log level for Syslog events and collect only events with a log level starting at NOTICE or a higher priority, select LOG_NOTICE in the Minimum log level list box.
By default, all configuration changes are automatically pushed to all agents that are configured in the DCR.
Create a data collection rule
Create a data collection rule in the same region as your Log Analytics workspace. A DCR is an Azure resource that allows you to define the way data should be handled as it's ingested into the workspace.
Sign in to the Azure portal.
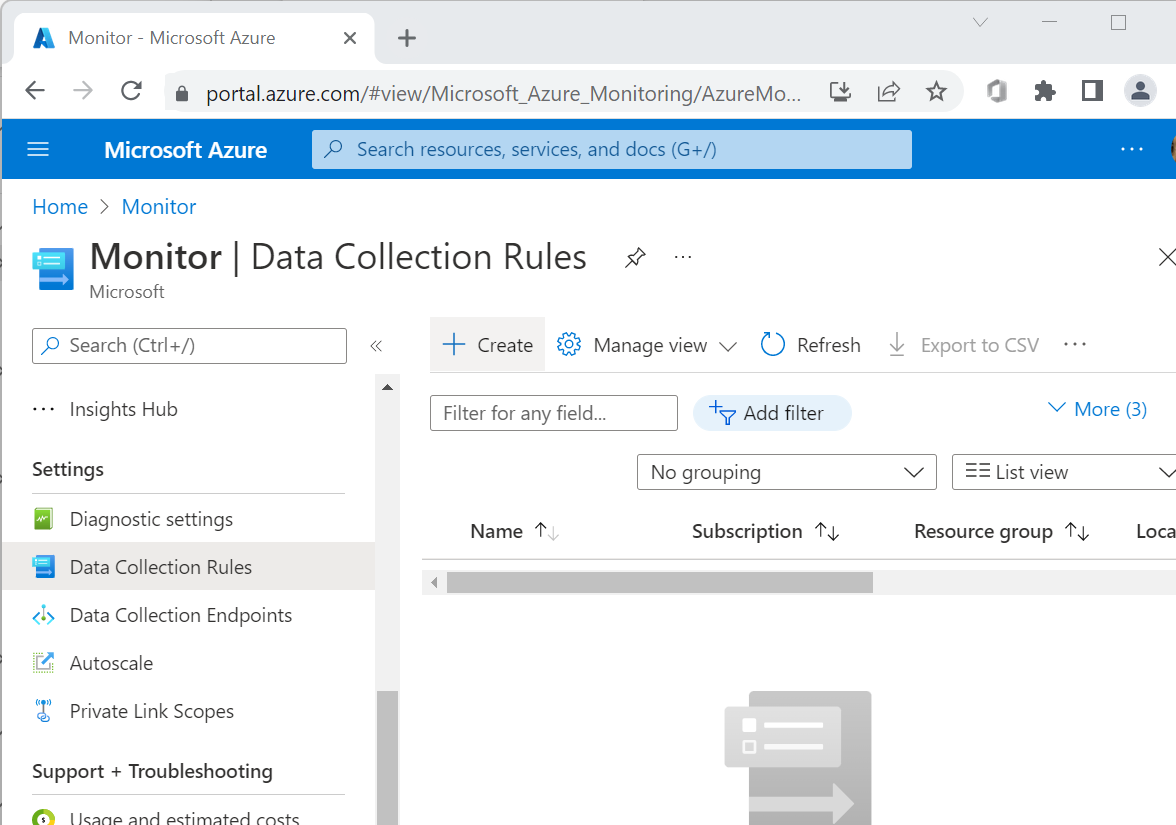
Search for and open Monitor.
Under Settings, select Data Collection Rules.
Select Create.

Add resources
Select Add resources.
Use the filters to find the virtual machine you want to use to collect logs.
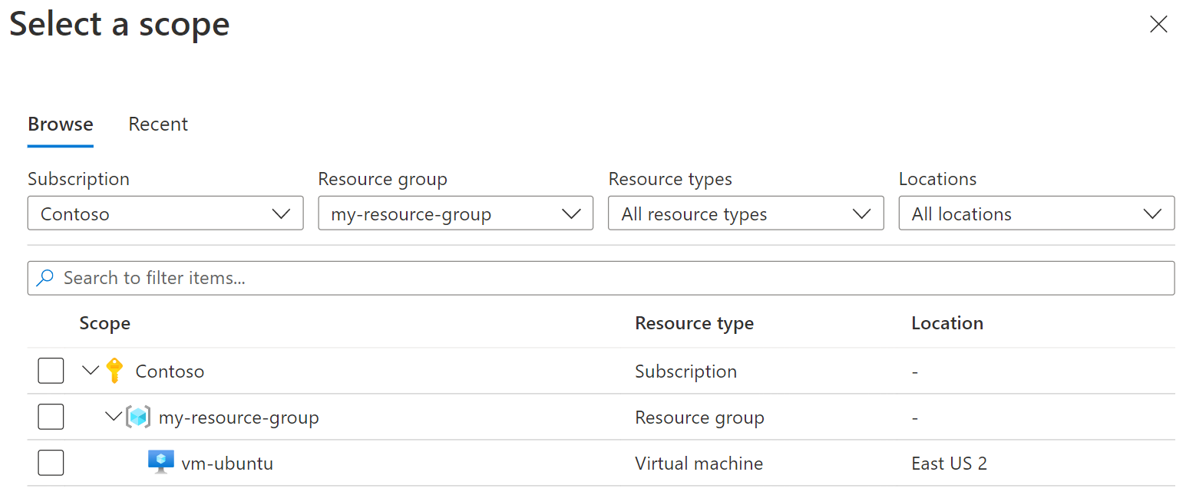
Select the virtual machine.
Select Apply.
Select Next: Collect and deliver.

Add a data source
Select Add data source.
For Data source type, select Linux syslog.
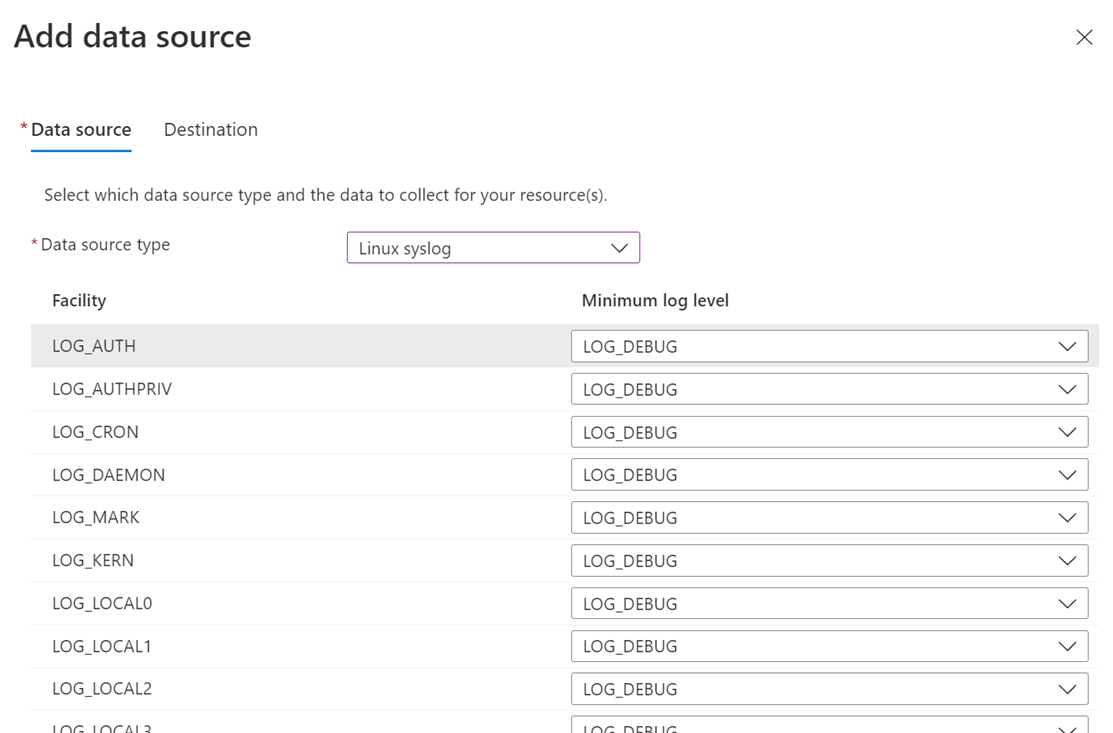
For Minimum log level, leave the default values LOG_DEBUG.
Select Next: Destination.

Add a destination
Select Add destination.
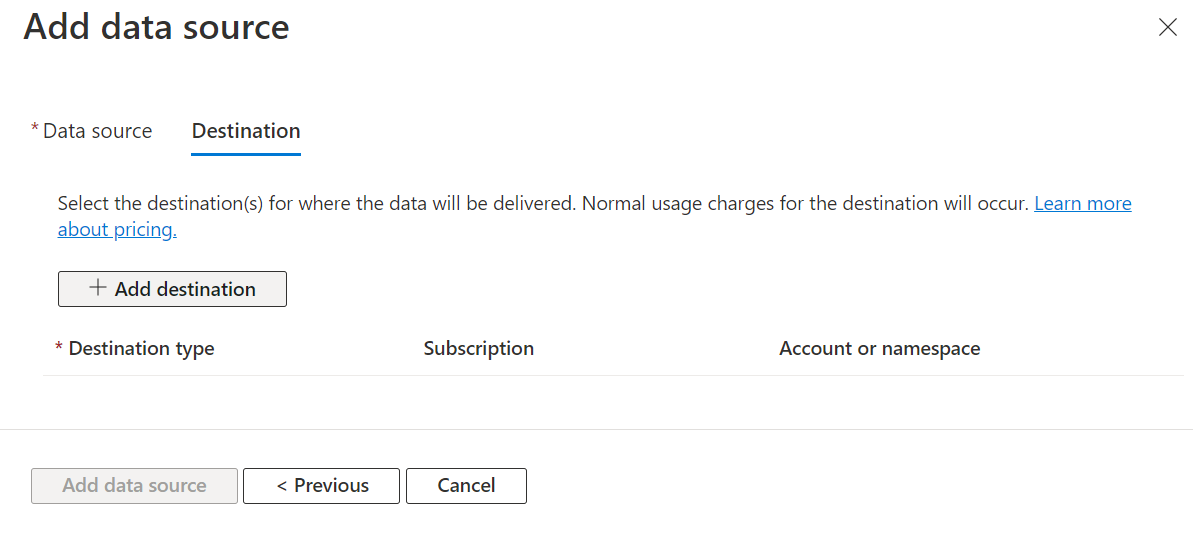
Enter the following values:
Field Value Destination type Azure Monitor Logs Subscription Select the appropriate subscription Account or namespace Select the appropriate Log Analytics workspace Select Add data source.
Select Next: Review + create.

Create a rule
- Select Create.
- Wait 20 minutes before you move on to the next section.
If your VM doesn't have Azure Monitor Agent installed, the DCR deployment triggers the installation of the agent on the VM.
Configure Syslog on the Linux agent
When Azure Monitor Agent is installed on a Linux machine, it installs a default Syslog configuration file that defines the facility and severity of the messages that are collected if Syslog is enabled in a DCR. The configuration file is different depending on the Syslog daemon that the client has installed.
Rsyslog
On many Linux distributions, the rsyslogd daemon is responsible for consuming, storing, and routing log messages sent by using the Linux Syslog API. Azure Monitor Agent uses the TCP forward output module (omfwd) in rsyslog to forward log messages to Azure Monitor Agent.
The Azure Monitor Agent installation includes default config files that get placed under the following directory: /etc/opt/microsoft/azuremonitoragent/syslog/rsyslogconf/
When Syslog is added to a DCR, these configuration files are installed under the etc/rsyslog.d system directory and rsyslog is automatically restarted for the changes to take effect. These files are used by rsyslog to load the output module and forward the events to the Azure Monitor Agent daemon by using defined rules.
Its default contents are shown in the following example. This example collects Syslog messages sent from the local agent for all facilities with all log levels.
$ cat /etc/rsyslog.d/10-azuremonitoragent-omfwd.conf
# Azure Monitor Agent configuration: forward logs to azuremonitoragent

template(name="AMA_RSYSLOG_TraditionalForwardFormat" type="string" string="<%PRI%>%TIMESTAMP% %HOSTNAME% %syslogtag%%msg:::sp-if-no-1st-sp%%msg%")
# queue.workerThreads sets the maximum worker threads, it will scale back to 0 if there is no activity
# Forwarding all events through TCP port
*.* action(type="omfwd"
template="AMA_RSYSLOG_TraditionalForwardFormat"
queue.type="LinkedList"
queue.filename="omfwd-azuremonitoragent"
queue.maxFileSize="32m"
action.resumeRetryCount="-1"
action.resumeInterval="5"
action.reportSuspension="on"
action.reportSuspensionContinuation="on"
queue.size="25000"
queue.workerThreads="100"
queue.dequeueBatchSize="2048"
queue.saveonshutdown="on"
target="127.0.0.1" Port="28330" Protocol="tcp")
On some legacy systems, such as CentOS 7.3, we've seen rsyslog log formatting issues when a traditional forwarding format is used to send Syslog events to Azure Monitor Agent. For these systems, Azure Monitor Agent automatically places a legacy forwarder template instead:
template(name="AMA_RSYSLOG_TraditionalForwardFormat" type="string" string="%TIMESTAMP% %HOSTNAME% %syslogtag%%msg:::sp-if-no-1st-sp%%msg%\n")
Syslog-ng
The configuration file for syslog-ng is installed at /etc/opt/microsoft/azuremonitoragent/syslog/syslog-ngconf/azuremonitoragent-tcp.conf. When Syslog collection is added to a DCR, this configuration file is placed under the /etc/syslog-ng/conf.d/azuremonitoragent-tcp.conf system directory and syslog-ng is automatically restarted for the changes to take effect.
The default contents are shown in the following example. This example collects Syslog messages sent from the local agent for all facilities and all severities.
$ cat /etc/syslog-ng/conf.d/azuremonitoragent-tcp.conf
# Azure MDSD configuration: syslog forwarding config for mdsd agent
options {};

# during install time, we detect if s_src exist, if it does then we
# replace it by appropriate source name like in redhat 's_sys'
# Forwrding using tcp
destination d_azure_mdsd {
	network("127.0.0.1"
	port(28330)
	log-fifo-size(25000));
};

log {
	source(s_src); # will be automatically parsed from /etc/syslog-ng/syslog-ng.conf
	destination(d_azure_mdsd);
	flags(flow-control);
};
Note
Azure Monitor supports collection of messages sent by rsyslog or syslog-ng, where rsyslog is the default daemon. The default Syslog daemon on version 5 of Red Hat Enterprise Linux, CentOS, and Oracle Linux version (sysklog) isn't supported for Syslog event collection. To collect Syslog data from this version of these distributions, the rsyslog daemon should be installed and configured to replace sysklog.
If you edit the Syslog configuration, you must restart the Syslog daemon for the changes to take effect.
Prerequisites
You need:
- A Log Analytics workspace where you have at least contributor rights.
- A data collection endpoint.
- Permissions to create DCR objects in the workspace.
- Syslog messages must follow RFC standards (RFC5424 or RFC3164)
Syslog record properties
Syslog records have a type of Syslog and have the properties shown in the following table.
| Property | Description |
|---|---|
| Computer | Computer that the event was collected from. |
| Facility | Defines the part of the system that generated the message. |
| HostIP | IP address of the system sending the message. |
| HostName | Name of the system sending the message. |
| SeverityLevel | Severity level of the event. |
| SyslogMessage | Text of the message. |
| ProcessID | ID of the process that generated the message. |
| EventTime | Date and time that the event was generated. |
Log queries with Syslog records
The following table provides different examples of log queries that retrieve Syslog records.
| Query | Description |
|---|---|
| Syslog | All Syslogs |
| Syslog | where SeverityLevel == "error" | All Syslog records with severity of error |
| Syslog | where Facility == "auth" | All Syslog records with auth facility type |
| Syslog | summarize AggregatedValue = count() by Facility | Count of Syslog records by facility |
Next steps
Learn more about:
Feedback
Coming soon: Throughout 2024 we will be phasing out GitHub Issues as the feedback mechanism for content and replacing it with a new feedback system. For more information see: https://aka.ms/ContentUserFeedback.
Submit and view feedback for