Application monitoring for Azure App Service and Python (Preview)
Important
See the Supplemental Terms of Use for Microsoft Azure Previews for legal terms that apply to Azure features that are in beta, preview, or otherwise not yet released into general availability.
Monitor your Python web applications on Azure App Services without modifying the code. This guide shows you how to enable Azure Monitor Application Insights and offers tips for automating large-scale deployments.
The integration instruments popular Python libraries in your code, letting you automatically gather and correlate dependencies, logs, and metrics. After instrumenting, you collect calls and metrics from these Python libraries:
Note
If using Django, see the additional Django Instrumentation section in this article.
Logging telemetry is collected at the level of the root logger. To learn more about Python's native logging hierarchy, visit the Python logging documentation.
Prerequisites
- Python version 3.11 or prior.
- App Service must be deployed as code. Custom containers aren't supported.
Enable Application Insights
The easiest way to monitor Python applications on Azure App Services is through the Azure portal.
Activating monitoring in the Azure portal automatically instruments your application with Application Insights and requires no code changes.
Note
You should only use autoinstrumentation on App Service if you aren't using manual instrumentation of OpenTelemetry in your code, such as the Azure Monitor OpenTelemetry Distro or the Azure Monitor OpenTelemetry Exporter. This is to prevent duplicate data from being sent. To learn more about this, check out the troubleshooting section in this article.
Autoinstrumentation through Azure portal
For a complete list of supported autoinstrumentation scenarios, see Supported environments, languages, and resource providers.
Toggle on monitoring for your Python apps in Azure App Service with no code changes required.
Application Insights for Python integrates with code-based Linux Azure App Service.
The integration is in public preview. It adds the Python SDK, which is in GA.
Select Application Insights in the Azure control panel for your app service, then select Enable.
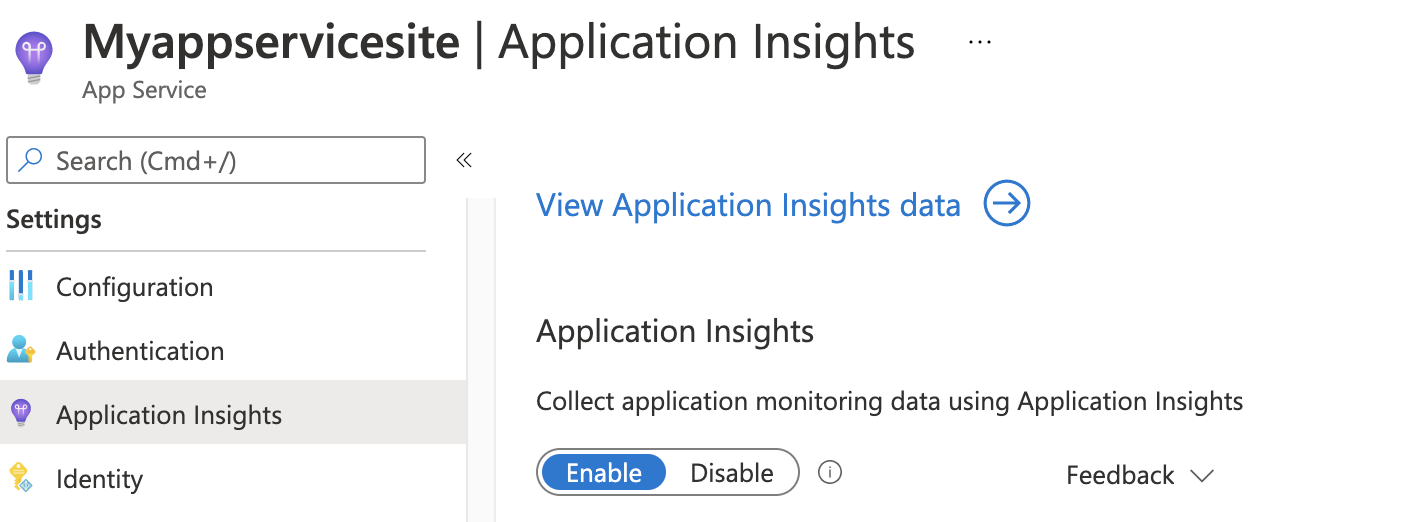
Choose to create a new resource, or select an existing Application Insights resource for this application.
Note
When you select OK to create the new resource you will be prompted to Apply monitoring settings. Selecting Continue will link your new Application Insights resource to your app service, doing so will also trigger a restart of your app service.

You specify the resource, and it's ready to use.


Configuration
You can configure with OpenTelemetry environment variables such as:
| Environment Variable | Description |
|---|---|
OTEL_SERVICE_NAME, OTEL_RESOURCE_ATTRIBUTES |
Specifies the OpenTelemetry Resource Attributes associated with your application. You can set any Resource Attributes with OTEL_RESOURCE_ATTRIBUTES or use OTEL_SERVICE_NAME to only set the service.name. |
OTEL_LOGS_EXPORTER |
If set to None, disables collection and export of logging telemetry. |
OTEL_METRICS_EXPORTER |
If set to None, disables collection and export of metric telemetry. |
OTEL_TRACES_EXPORTER |
If set to None, disables collection and export of distributed tracing telemetry. |
OTEL_BLRP_SCHEDULE_DELAY |
Specifies the logging export interval in milliseconds. Defaults to 5000. |
OTEL_BSP_SCHEDULE_DELAY |
Specifies the distributed tracing export interval in milliseconds. Defaults to 5000. |
OTEL_PYTHON_DISABLED_INSTRUMENTATIONS |
Specifies which OpenTelemetry instrumentations to disable. When disabled, instrumentations aren't executed as part of autoinstrumentation. Accepts a comma-separated list of lowercase library names. For example, set it to "psycopg2,fastapi" to disable the Psycopg2 and FastAPI instrumentations. It defaults to an empty list, enabling all supported instrumentations. |
Add a community instrumentation library
You can collect more data automatically when you include instrumentation libraries from the OpenTelemetry community.
Caution
We don't support or guarantee the quality of community instrumentation libraries. To suggest one for our distro, post or up-vote in our feedback community. Be aware, some are based on experimental OpenTelemetry specs and might introduce future breaking changes.
To add the community OpenTelemetry Instrumentation Library, install it via your app's requirements.txt file. OpenTelemetry autoinstrumentation automatically picks up and instruments all installed libraries. Find the list of community libraries here.
Automate monitoring
In order to enable telemetry collection with Application Insights, only the following Application settings need to be set:

Application settings definitions
| App setting name | Definition | Value |
|---|---|---|
| APPLICATIONINSIGHTS_CONNECTION_STRING | Connections string for your Application Insights resource | Example: abcd1234-ab12-cd34-abcd1234abcd |
| ApplicationInsightsAgent_EXTENSION_VERSION | Main extension, which controls runtime monitoring. | ~3 |
Note
Profiler and snapshot debugger are not available for Python applications
App Service application settings with Azure Resource Manager
Application settings for Azure App Service can be managed and configured with Azure Resource Manager templates. You can use this method when you deploy new App Service resources with Resource Manager automation or modify the settings of existing resources.
The basic structure of the application settings JSON for an App Service resource:
      "resources": [
        {
          "name": "appsettings",
          "type": "config",
          "apiVersion": "2015-08-01",
          "dependsOn": [
            "[resourceId('Microsoft.Web/sites', variables('webSiteName'))]"
          ],
          "tags": {
            "displayName": "Application Insights Settings"
          },
          "properties": {
            "key1": "value1",
            "key2": "value2"
          }
        }
      ]
For an example of a Resource Manager template with application settings configured for Application Insights, this template can be helpful. Specifically, see the section that starts on line 238.
Automate the creation of an Application Insights resource and link to your newly created App Service resource
To create a Resource Manager template with the default Application Insights settings, begin the process as if you were going to create a new web app with Application Insights enabled.
Create a new App Service resource with your desired web app information. Enable Application Insights on the Monitoring tab.
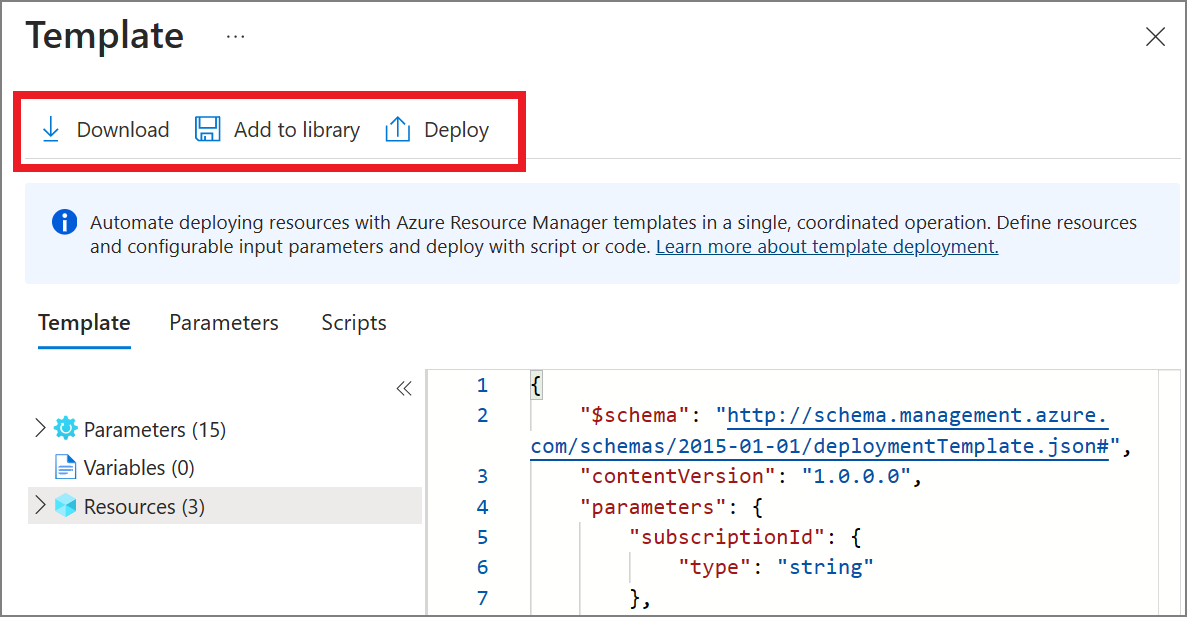
Select Review + create. Then select Download a template for automation.
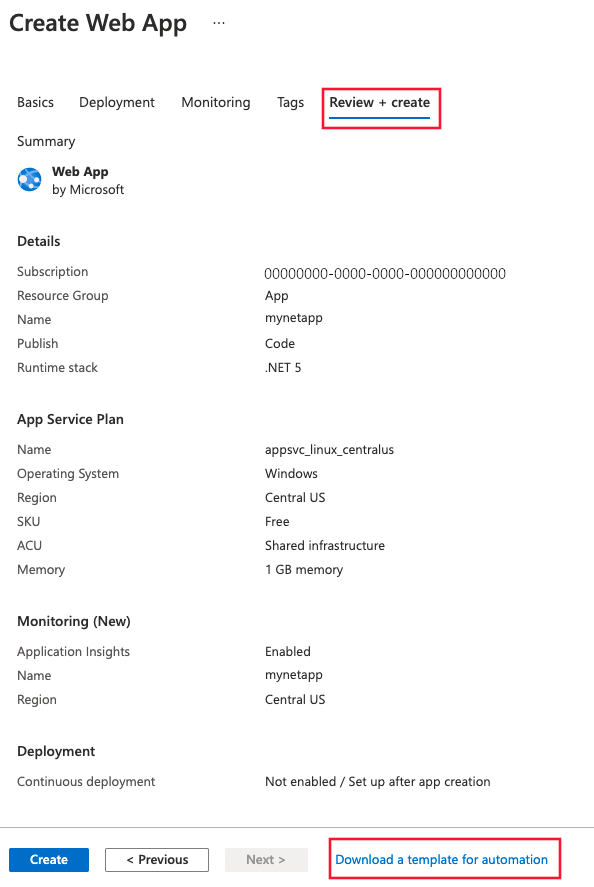
This option generates the latest Resource Manager template with all required settings configured.


In the following sample, replace all instances of AppMonitoredSite with your site name:
Note
If using Windows, set ApplicationInsightsAgent_EXTENSION_VERSION to ~2. If using Linux, set ApplicationInsightsAgent_EXTENSION_VERSION to ~3.
{
    "resources": [
        {
            "name": "[parameters('name')]",
            "type": "Microsoft.Web/sites",
            "properties": {
                "siteConfig": {
                    "appSettings": [
                        {
                            "name": "APPINSIGHTS_INSTRUMENTATIONKEY",
                            "value": "[reference('microsoft.insights/components/AppMonitoredSite', '2015-05-01').InstrumentationKey]"
                        },
                        {
                            "name": "APPLICATIONINSIGHTS_CONNECTION_STRING",
                            "value": "[reference('microsoft.insights/components/AppMonitoredSite', '2015-05-01').ConnectionString]"
                        },
                        {
                            "name": "ApplicationInsightsAgent_EXTENSION_VERSION",
                            "value": "~2"
                        }
                    ]
                },
                "name": "[parameters('name')]",
                "serverFarmId": "[concat('/subscriptions/', parameters('subscriptionId'),'/resourcegroups/', parameters('serverFarmResourceGroup'), '/providers/Microsoft.Web/serverfarms/', parameters('hostingPlanName'))]",
                "hostingEnvironment": "[parameters('hostingEnvironment')]"
            },
            "dependsOn": [
                "[concat('Microsoft.Web/serverfarms/', parameters('hostingPlanName'))]",
                "microsoft.insights/components/AppMonitoredSite"
            ],
            "apiVersion": "2016-03-01",
            "location": "[parameters('location')]"
        },
        {
            "apiVersion": "2016-09-01",
            "name": "[parameters('hostingPlanName')]",
            "type": "Microsoft.Web/serverfarms",
            "location": "[parameters('location')]",
            "properties": {
                "name": "[parameters('hostingPlanName')]",
                "workerSizeId": "[parameters('workerSize')]",
                "numberOfWorkers": "1",
                "hostingEnvironment": "[parameters('hostingEnvironment')]"
            },
            "sku": {
                "Tier": "[parameters('sku')]",
                "Name": "[parameters('skuCode')]"
            }
        },
        {
            "apiVersion": "2015-05-01",
            "name": "AppMonitoredSite",
            "type": "microsoft.insights/components",
            "location": "West US 2",
            "properties": {
                "ApplicationId": "[parameters('name')]",
                "Request_Source": "IbizaWebAppExtensionCreate"
            }
        }
    ],
    "parameters": {
        "name": {
            "type": "string"
        },
        "hostingPlanName": {
            "type": "string"
        },
        "hostingEnvironment": {
            "type": "string"
        },
        "location": {
            "type": "string"
        },
        "sku": {
            "type": "string"
        },
        "skuCode": {
            "type": "string"
        },
        "workerSize": {
            "type": "string"
        },
        "serverFarmResourceGroup": {
            "type": "string"
        },
        "subscriptionId": {
            "type": "string"
        }
    },
    "$schema": "https://schema.management.azure.com/schemas/2014-04-01-preview/deploymentTemplate.json#",
    "contentVersion": "1.0.0.0"
}
Enable through PowerShell
To enable the application monitoring through PowerShell, only the underlying application settings must be changed. The following sample enables application monitoring for a website called AppMonitoredSite in the resource group AppMonitoredRG. It configures data to be sent to the 012345678-abcd-ef01-2345-6789abcd instrumentation key.
Note
We recommend that you use the Azure Az PowerShell module to interact with Azure. See Install Azure PowerShell to get started. To learn how to migrate to the Az PowerShell module, see Migrate Azure PowerShell from AzureRM to Az.
Note
If using Windows, set ApplicationInsightsAgent_EXTENSION_VERSION to ~2. If using Linux, set ApplicationInsightsAgent_EXTENSION_VERSION to ~3.
$app = Get-AzWebApp -ResourceGroupName "AppMonitoredRG" -Name "AppMonitoredSite" -ErrorAction Stop
$newAppSettings = @{} # case-insensitive hash map
$app.SiteConfig.AppSettings | %{$newAppSettings[$_.Name] = $_.Value} # preserve non Application Insights application settings.
$newAppSettings["APPINSIGHTS_INSTRUMENTATIONKEY"] = "012345678-abcd-ef01-2345-6789abcd"; # set the Application Insights instrumentation key
$newAppSettings["APPLICATIONINSIGHTS_CONNECTION_STRING"] = "InstrumentationKey=012345678-abcd-ef01-2345-6789abcd"; # set the Application Insights connection string
$newAppSettings["ApplicationInsightsAgent_EXTENSION_VERSION"] = "~2"; # enable the ApplicationInsightsAgent
$app = Set-AzWebApp -AppSettings $newAppSettings -ResourceGroupName $app.ResourceGroup -Name $app.Name -ErrorAction Stop
Django Instrumentation
In order to use the OpenTelemetry Django Instrumentation, you need to set the DJANGO_SETTINGS_MODULE environment variable in the App Service settings to point from your app folder to your settings module. For more information, see the Django documentation.
Frequently asked questions
What's the difference between standard metrics from Application Insights vs. Azure App Service metrics?
Application Insights collects telemetry for the requests that made it to the application. If the failure occurs in WebApps/WebServer, and the request didn't reach the user application, Application Insights doesn't have any telemetry about it.
The duration for serverresponsetime calculated by Application Insights doesn't necessarily match the server response time observed by Web Apps. This behavior is because Application Insights only counts the duration when the request actually reaches the user application. If the request is stuck or queued in WebServer, the waiting time is included in the Web Apps metrics but not in Application Insights metrics.
Troubleshooting
Here we provide our troubleshooting guide for monitoring Python applications on Azure App Services using autoinstrumentation.
Duplicate telemetry
You should only use autoinstrumentation on App Service if you aren't using manual instrumentation of OpenTelemetry in your code, such as the Azure Monitor OpenTelemetry Distro or the Azure Monitor OpenTelemetry Exporter. Using autoinstrumentation on top of the manual instrumentation could cause duplicate telemetry and increase your cost. In order to use App Service OpenTelemetry autoinstrumentation, first remove manual instrumentation of OpenTelemetry from your code.
Missing telemetry
If you're missing telemetry, follow these steps to confirm that autoinstrumentation is enabled correctly.
Step 1: Check the Application Insights blade on your App Service resource
Confirm that autoinstrumentation is enabled in the Application Insights blade on your App Service Resource:

Step 2: Confirm that your App Settings are correct
Confirm that the ApplicationInsightsAgent_EXTENSION_VERSION app setting is set to a value of ~3 and that your APPLICATIONINSIGHTS_CONNECTION_STRING points to the appropriate Application Insights resource.
Step 3: Check autoinstrumentation diagnostics and status logs
Navigate to /var/log/applicationinsights/ and open status_*.json.
Confirm that AgentInitializedSuccessfully is set to true and IKey to have a valid iKey.
Here's an example JSON file:
    "AgentInitializedSuccessfully":true,

    "AppType":"python",

    "MachineName":"c89d3a6d0357",

    "PID":"47",

    "IKey":"00000000-0000-0000-0000-000000000000",

    "SdkVersion":"1.0.0"
The applicationinsights-extension.log file in the same folder may show other helpful diagnostics.
Django apps
If your app uses Django and is either failing to start or using incorrect settings, make sure to set the DJANGO_SETTINGS_MODULE environment variable. See the Django Instrumentation section for details.
Test connectivity between your application host and the ingestion service
Application Insights SDKs and agents send telemetry to get ingested as REST calls to our ingestion endpoints. You can test connectivity from your web server or application host machine to the ingestion service endpoints by using raw REST clients from PowerShell or curl commands. See Troubleshoot missing application telemetry in Azure Monitor Application Insights.
For the latest updates and bug fixes, consult the release notes. -->
Next steps
- Enable Azure diagnostics to be sent to Application Insights
- Monitor service health metrics to make sure your service is available and responsive
- Receive alert notifications whenever operational events happen or metrics cross a threshold
- Availability overview
Feedback
Coming soon: Throughout 2024 we will be phasing out GitHub Issues as the feedback mechanism for content and replacing it with a new feedback system. For more information see: https://aka.ms/ContentUserFeedback.
Submit and view feedback for