Troubleshooting guide for Azure SignalR Service common issues
This article provides troubleshooting guidance for some of the common issues that customers might encounter.
Access token too long
Possible errors
- Client-side
ERR_CONNECTION_ - 414 URI Too Long
- 413 Payload Too Large
- Access Token must not be longer than 4K. 413 Request Entity Too Large
Root cause
For HTTP/2, the max length for a single header is 4 K, so if using browser to access Azure service, there will be an error ERR_CONNECTION_ for this limitation.
For HTTP/1.1, or C# clients, the max URI length is 12 K, the max header length is 16 K.
With SDK version 1.0.6 or higher, /negotiate will throw 413 Payload Too Large when the generated access token is larger than 4 K.
Solution
By default, claims from context.User.Claims are included when generating JWT access token to ASRS(Azure SignalR Service), so that the claims are preserved and can be passed from ASRS to the Hub when the client connects to the Hub.
In some cases, context.User.Claims are used to store lots of information for app server, most of which aren't used by Hubs but by other components.
The generated access token is passed through the network, and for WebSocket/SSE connections, access tokens are passed through query strings. So as the best practice, we suggest only passing necessary claims from the client through ASRS to your app server when the Hub needs.
There's a ClaimsProvider for you to customize the claims passing to ASRS inside the access token.
For ASP.NET Core:
services.AddSignalR()
        .AddAzureSignalR(options =>
            {
                // pick up necessary claims
                options.ClaimsProvider = context => context.User.Claims.Where(...);
            });
For ASP.NET:
services.MapAzureSignalR(GetType().FullName, options =>
            {
                // pick up necessary claims
                options.ClaimsProvider = context.Authentication?.User.Claims.Where(...);
            });
Having issues or feedback about the troubleshooting? Let us know.
TLS 1.2 required
Possible errors
- ASP.NET "No server available" error #279
- ASP.NET "The connection isn't active, data cannot be sent to the service." error #324
- "An error occurred while making the HTTP request to
https://<API endpoint>. This error could be because the server certificate is not configured properly with HTTP.SYS in the HTTPS case. This error could also be caused by a mismatch of the security binding between the client and the server."
Root cause
Azure Service only supports TLS1.2 for security concerns. With .NET framework, it's possible that TLS1.2 isn't the default protocol. As a result, the server connections to ASRS can't be successfully established.
Troubleshooting guide
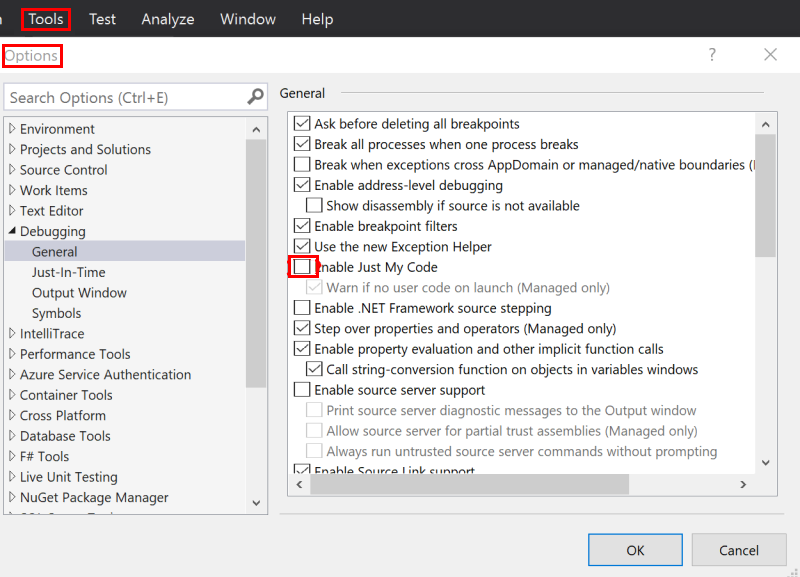
If this error can be reproduced locally, uncheck Just My Code and throw all CLR exceptions and debug the app server locally to see what exception throws.
Uncheck Just My Code
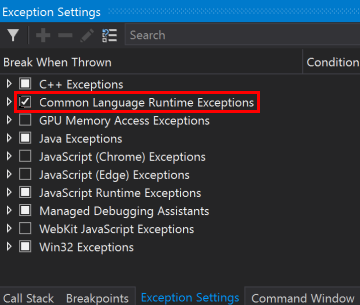
Throw CLR exceptions
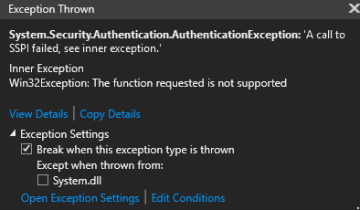
See the exceptions throw when debugging the app server-side code:
For ASP.NET ones, you can also add following code to your
Startup.csto enable detailed trace and see the errors from the log.app.MapAzureSignalR(this.GetType().FullName); // Make sure this switch is called after MapAzureSignalR GlobalHost.TraceManager.Switch.Level = SourceLevels.Information;
Solution
Add following code to your Startup:
ServicePointManager.SecurityProtocol = SecurityProtocolType.Tls12;
Having issues or feedback about the troubleshooting? Let us know.
400 Bad Request returned for client requests
Root cause
Check if your client request has multiple hub query strings. hub is a preserved query parameter and 400 will throw if the service detects more than one hub in the query.
Having issues or feedback about the troubleshooting? Let us know.
401 Unauthorized returned for client requests
Root cause
Currently the default value of JWT token's lifetime is one (1) hour.
For ASP.NET Core SignalR, when it's using WebSocket transport type, it's OK.
For ASP.NET Core SignalR's other transport type, SSE and long-polling, the default lifetime means by default the connection can at most persist for one hour.
For ASP.NET SignalR, the client sends a /ping "keep alive" request to the service from time to time, when the /ping fails, the client aborts the connection and never reconnect. For ASP.NET SignalR, the default token lifetime makes the connection last for at most one hour for all the transport type.
Solution
For security concerns, extend TTL isn't encouraged. We suggest adding reconnect logic from the client to restart the connection when such 401 occurs. When the client restarts the connection, it will negotiate with app server to get the JWT token again and get a renewed token.
Check here for how to restart client connections.
Having issues or feedback about the troubleshooting? Let us know.
404 returned for client requests
For a SignalR persistent connection, it first /negotiate to Azure SignalR service and then establishes the real connection to Azure SignalR service.
Troubleshooting guide
- Following How to view outgoing requests to get the request from the client to the service.
- Check the URL of the request when 404 occurs. If the URL is targeting to your web app, and similar to
{your_web_app}/hubs/{hubName}, check if the clientSkipNegotiationistrue. The client receives a redirect URL when it first negotiates with the app server. The client must not skip negotiation when using Azure SignalR. - Another 404 can happen when the connect request is handled more than five (5) seconds after
/negotiateis called. Check the timestamp of the client request, and open an issue to us if the request to the service has a slow response.
Having issues or feedback about the troubleshooting? Let us know.
404 returned for ASP.NET SignalR's reconnect request
For ASP.NET SignalR, when the client connection drops, it reconnects using the same connectionId for three times before stopping the connection. /reconnect can help if the connection is dropped due to network intermittent issues that /reconnect can reestablish the persistent connection successfully. Under other circumstances, for example, the client connection is dropped due to the routed server connection is dropped, or SignalR Service has some internal errors like instance restart/failover/deployment, the connection no longer exists, thus /reconnect returns 404. It's the expected behavior for /reconnect and after three times retry the connection stops. We suggest having connection restart logic when connection stops.
Having issues or feedback about the troubleshooting? Let us know.
429 (Too Many Requests) returned for client requests
There are two cases.
Concurrent connection count exceeds limit
For Free instances, Concurrent connection count limit is 20 For Standard instances, concurrent connection count limit per unit is 1 K, which means Unit100 allows 100-K concurrent connections.
The connections include both client and server connections. check here for how connections are counted.
Too many negotiate requests at the same time
We suggest having a random delay before reconnecting, check here for retry samples.
Having issues or feedback about the troubleshooting? Let us know.
500 Error when negotiate: Azure SignalR Service is not connected yet, please try again later
Root cause
This error is reported when there's no server connection to Azure SignalR Service connected.
Troubleshooting guide
Enable server-side trace to find out the error details when the server tries to connect to Azure SignalR Service.
Enable server-side logging for ASP.NET Core SignalR
Server-side logging for ASP.NET Core SignalR integrates with the ILogger based logging provided in the ASP.NET Core framework. You can enable server-side logging by using ConfigureLogging, a sample usage as follows:
.ConfigureLogging((hostingContext, logging) =>
        {
            logging.AddConsole();
            logging.AddDebug();
        })
Logger categories for Azure SignalR always start with Microsoft.Azure.SignalR. To enable detailed logs from Azure SignalR, configure the preceding prefixes to Debug level in your appsettings.json file like below:
{
    "Logging": {
        "LogLevel": {
            ...
            "Microsoft.Azure.SignalR": "Debug",
            ...
        }
    }
}
Enable server-side traces for ASP.NET SignalR
When using SDK version >= 1.0.0, you can enable traces by adding the following to web.config: (Details)
<system.diagnostics>
    <sources>
      <source name="Microsoft.Azure.SignalR" switchName="SignalRSwitch">
        <listeners>
          <add name="ASRS" />
        </listeners>
      </source>
    </sources>
    <!-- Sets the trace verbosity level -->
    <switches>
      <add name="SignalRSwitch" value="Information" />
    </switches>
    <!-- Specifies the trace writer for output -->
    <sharedListeners>
      <add name="ASRS" type="System.Diagnostics.TextWriterTraceListener" initializeData="asrs.log.txt" />
    </sharedListeners>
    <trace autoflush="true" />
  </system.diagnostics>
Having issues or feedback about the troubleshooting? Let us know.
Client connection drops
When the client is connected to the Azure SignalR, the persistent connection between the client and Azure SignalR can sometimes drop for different reasons. This section describes several possibilities causing such connection drop and provides some guidance on how to identify the root cause.
Possible errors seen from the client side
The remote party closed the WebSocket connection without completing the close handshakeService timeout. 30000.00ms elapsed without receiving a message from service.{"type":7,"error":"Connection closed with an error."}{"type":7,"error":"Internal server error."}
Root cause
Client connections can drop under various circumstances:
- When
Hubthrows exceptions with the incoming request - When the server connection, which the client routed to, drops, see below section for details on server connection drops
- When a network connectivity issue happens between client and SignalR Service
- When SignalR Service has some internal errors like instance restart, failover, deployment, and so on
Troubleshooting guide
- Open app server-side log to see if anything abnormal took place
- Check app server-side event log to see if the app server restarted
- Create an issue to us providing the time frame, and email the resource name to us
Having issues or feedback about the troubleshooting? Let us know.
Client connection increases constantly
It might be caused by improper usage of client connection. If someone forgets to stop/dispose SignalR client, the connection remains open.
Possible errors seen from the SignalR's metrics that is in Monitoring section of Azure portal resource menu
Client connections rise constantly for a long time in Azure SignalR's Metrics.
Root cause
SignalR client connection's DisposeAsync never be called, the connection keeps open.
Troubleshooting guide
Check if the SignalR client never closes.
Solution
Check if you close connection. Manually call HubConnection.DisposeAsync() to stop the connection after using it.
For example:
var connection = new HubConnectionBuilder()
	.WithUrl(...)
	.Build();
try
{
	await connection.StartAsync();
	// Do your stuff
	await connection.StopAsync();
}
finally
{
	await connection.DisposeAsync();
}
Common improper client connection usage
Azure Function example
This issue often occurs when someone establishes a SignalR client connection in an Azure Function method instead of making it a static member in the function class. You might expect only one client connection to be established, but instead you see client connection count increase constantly in metrics. All these connections drop only after the Azure Function or Azure SignalR service restarts. This behavior is because for each request, Azure Function creates one client connection, and if you don't stop client connection in the function method, the client keeps the connections alive to Azure SignalR service.
Solution
- Remember to close client connection if you use SignalR clients in Azure function or use SignalR client as a singleton.
- Instead of using SignalR clients in Azure function, you can create SignalR clients anywhere else and use Azure Functions Bindings for Azure SignalR Service to negotiate the client to Azure SignalR. And you can also utilize the binding to send messages. Samples to negotiate client and send messages can be found here. Further information can be found here.
- When you use SignalR clients in Azure function, there might be a better architecture to your scenario. Check if you design a proper serverless architecture. You can refer to Real-time serverless applications with the SignalR Service bindings in Azure Functions.
Having issues or feedback about the troubleshooting? Let us know.
Server connection drops
When the app server starts, in the background, the Azure SDK starts to initiate server connections to the remote Azure SignalR. As described in Internals of Azure SignalR Service, Azure SignalR routes incoming client traffics to these server connections. Once a server connection is dropped, all the client connections it serves will be closed too.
As the connections between the app server and SignalR Service are persistent connections, they may experience network connectivity issues. In the Server SDK, we have an Always Reconnect strategy to server connections. As a best practice, we also encourage users to add continuous reconnection logic to the clients with a random delay time to avoid massive simultaneous requests to the server.
Regularly, there are new version releases for the Azure SignalR Service, and sometimes the Azure-wide patching or upgrades or occasionally interruption from our dependent services. These events may bring in a short period of service disruption, but as long as client-side has a disconnect/reconnect mechanism, the effect is minimal like any client-side caused disconnect-reconnect.
This section describes several possibilities leading to server connection drop, and provides some guidance on how to identify the root cause.
Possible errors seen from the server side
[Error]Connection "..." to the service was droppedThe remote party closed the WebSocket connection without completing the close handshakeService timeout. 30000.00ms elapsed without receiving a message from service.
Root cause
Server-service connection is closed by ASRS(Azure SignalR Service).
For ping timeout, it might be caused by high CPU usage or thread pool starvation on the server side.
For ASP.NET SignalR, a known issue was fixed in SDK 1.6.0. Upgrade your SDK to newest version.
Thread pool starvation
If your server is starving, that means no threads are working on message processing. All threads aren't responding in a certain method.
Normally, this scenario is caused by async over sync or by Task.Result/Task.Wait() in async methods.
See ASP.NET Core performance best practices.
See more about thread pool starvation.
How to detect thread pool starvation
Check your thread count. If there are no spikes at that time, take these steps:
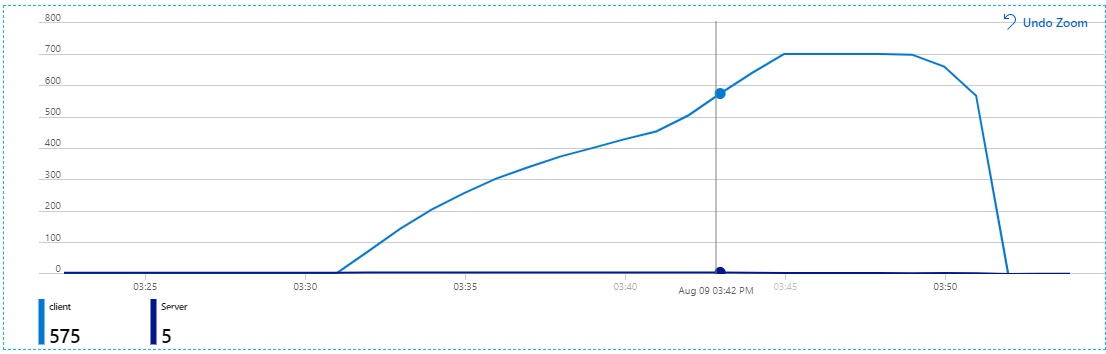
If you're using Azure App Service, check the thread count in metrics. Check the
Maxaggregation:
If you're using the .NET Framework, you can find metrics in the performance monitor in your server VM.
If you're using .NET Core in a container, see Collect diagnostics in containers.
You also can use code to detect thread pool starvation:
public class ThreadPoolStarvationDetector : EventListener
{
    private const int EventIdForThreadPoolWorkerThreadAdjustmentAdjustment = 55;
    private const uint ReasonForStarvation = 6;

    private readonly ILogger<ThreadPoolStarvationDetector> _logger;

    public ThreadPoolStarvationDetector(ILogger<ThreadPoolStarvationDetector> logger)
    {
        _logger = logger;
    }

    protected override void OnEventSourceCreated(EventSource eventSource)
    {
        if (eventSource.Name == "Microsoft-Windows-DotNETRuntime")
        {
            EnableEvents(eventSource, EventLevel.Informational, EventKeywords.All);
        }
    }

    protected override void OnEventWritten(EventWrittenEventArgs eventData)
    {
        // See: https://learn.microsoft.com/dotnet/framework/performance/thread-pool-etw-events#threadpoolworkerthreadadjustmentadjustment
        if (eventData.EventId == EventIdForThreadPoolWorkerThreadAdjustmentAdjustment &&
            eventData.Payload[2] as uint? == ReasonForStarvation)
        {
            _logger.LogWarning("Thread pool starvation detected!");
        }
    }
}
Add it to your service:
service.AddSingleton<ThreadPoolStarvationDetector>();
Then, check your log when the server connection is disconnected by ping timeout.
How to find the root cause of thread pool starvation
To find the root cause of thread pool starvation:
- Dump the memory, and then analyze the call stack. For more information, see Collect and analyze memory dumps.
- Use clrmd to dump the memory when thread pool starvation is detected. Then, log the call stack.
Troubleshooting guide
- Open the app server-side log to see if anything abnormal took place.
- Check the app server-side event log to see if the app server restarted.
- Create an issue. Provide the time frame, and email the resource name to us.
Having issues or feedback about the troubleshooting? Let us know.
Tips
How to view the outgoing request from the client?
Take ASP.NET Core one for example (ASP.NET one is similar):
From browser: Take Chrome as an example, you can use F12 to open the console window, and switch to Network tab. You might need to refresh the page using F5 to capture the network from the very beginning.
From C# client:
You can view local web traffics using Fiddler. WebSocket traffics are supported since Fiddler 4.5.


How to restart client connection?
Here are the Sample codes containing restarting connection logic with ALWAYS RETRY strategy:
Having issues or feedback about the troubleshooting? Let us know.
Next steps
In this guide, you learned about how to handle the common issues. You could also learn more generic troubleshooting methods.
Feedback
Coming soon: Throughout 2024 we will be phasing out GitHub Issues as the feedback mechanism for content and replacing it with a new feedback system. For more information see: https://aka.ms/ContentUserFeedback.
Submit and view feedback for