Monitor and debug with insights in Azure Cosmos DB for Apache Cassandra
APPLIES TO:
![]() Cassandra
Cassandra
Azure Cosmos DB helps provide insights into your application’s performance using the Azure Monitor API. Azure Monitor for Azure Cosmos DB provides metrics view to monitor your API for Cassandra Account and create dashboards.
This article walks through some common use cases and how best to use Azure Cosmos DB insights to analyze and debug your API for Cassandra account.
Note
The Azure Cosmos DB metrics are collected by default, this feature does not require you to enable or configure anything.
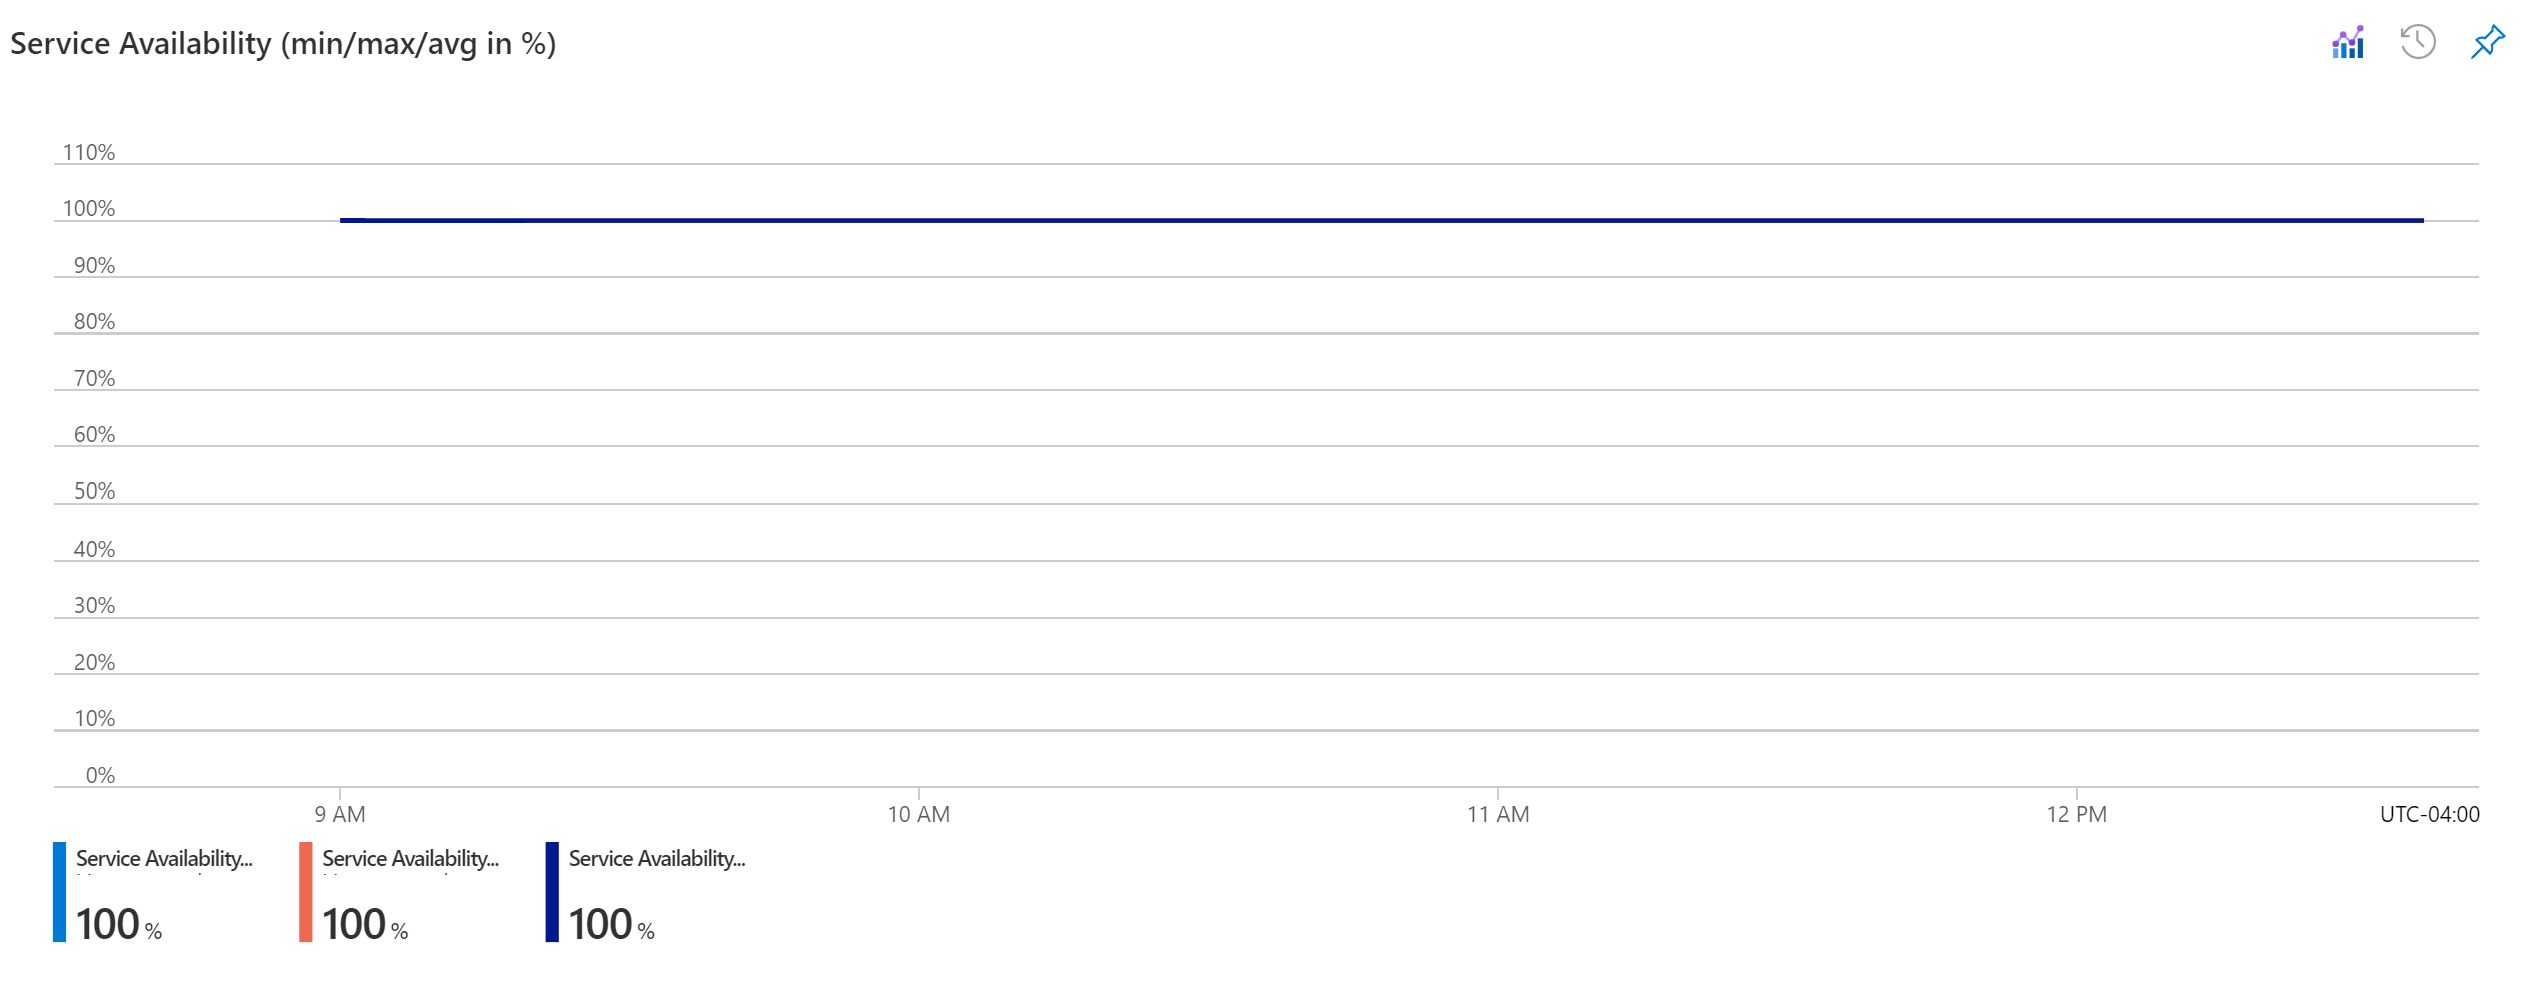
Availability
The availability shows the percentage of successful requests over the total requests per hour. Monitor service availability for a specified API for Cassandra account.
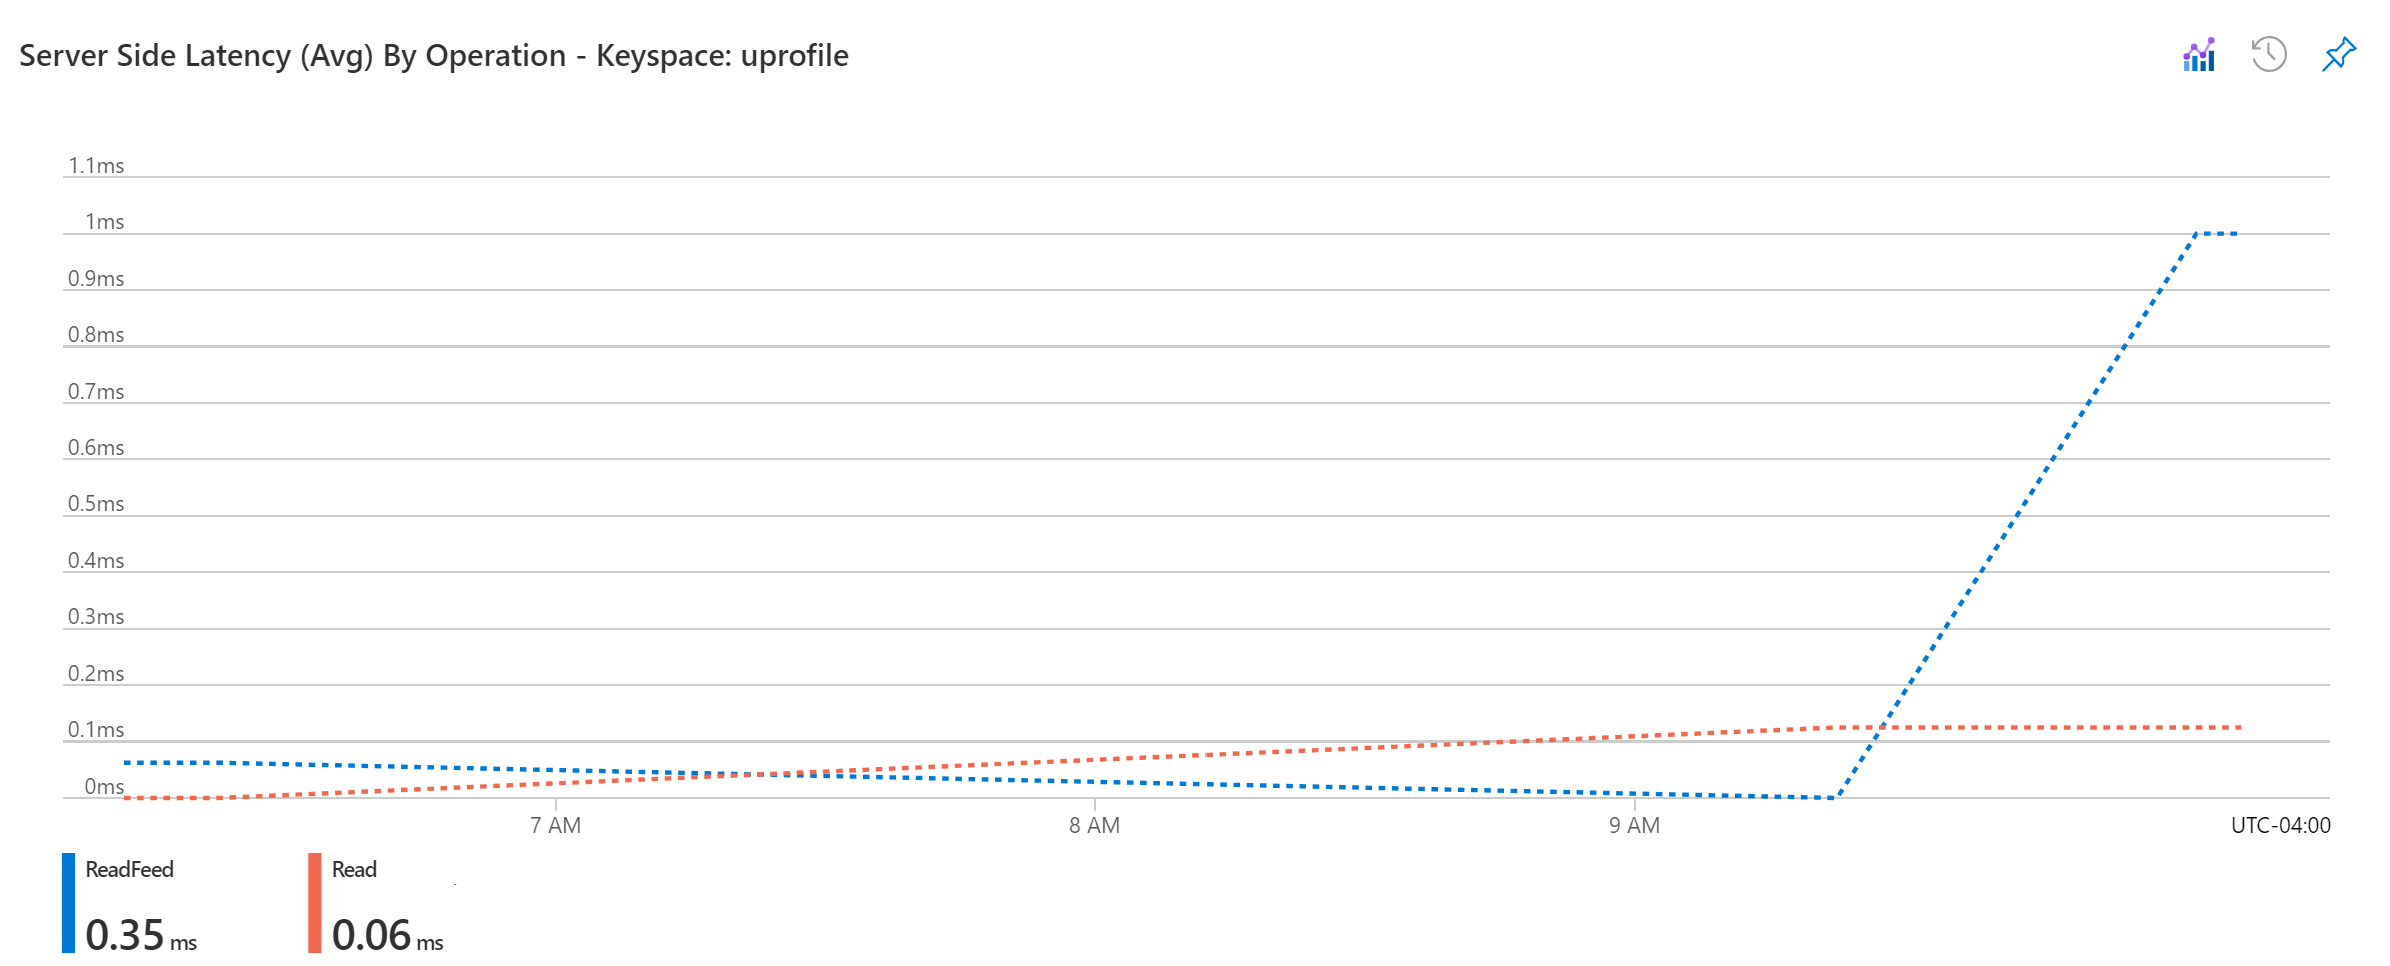
Latency
These charts below show the read and write latency observed by your API for Cassandra account in the region where your account is operating. You can visualize latency across regions for a geo-replicated account. This metric doesn't represent the end-to-end request latency. Use diagnostic log for cases where you experience high latency for query operations.
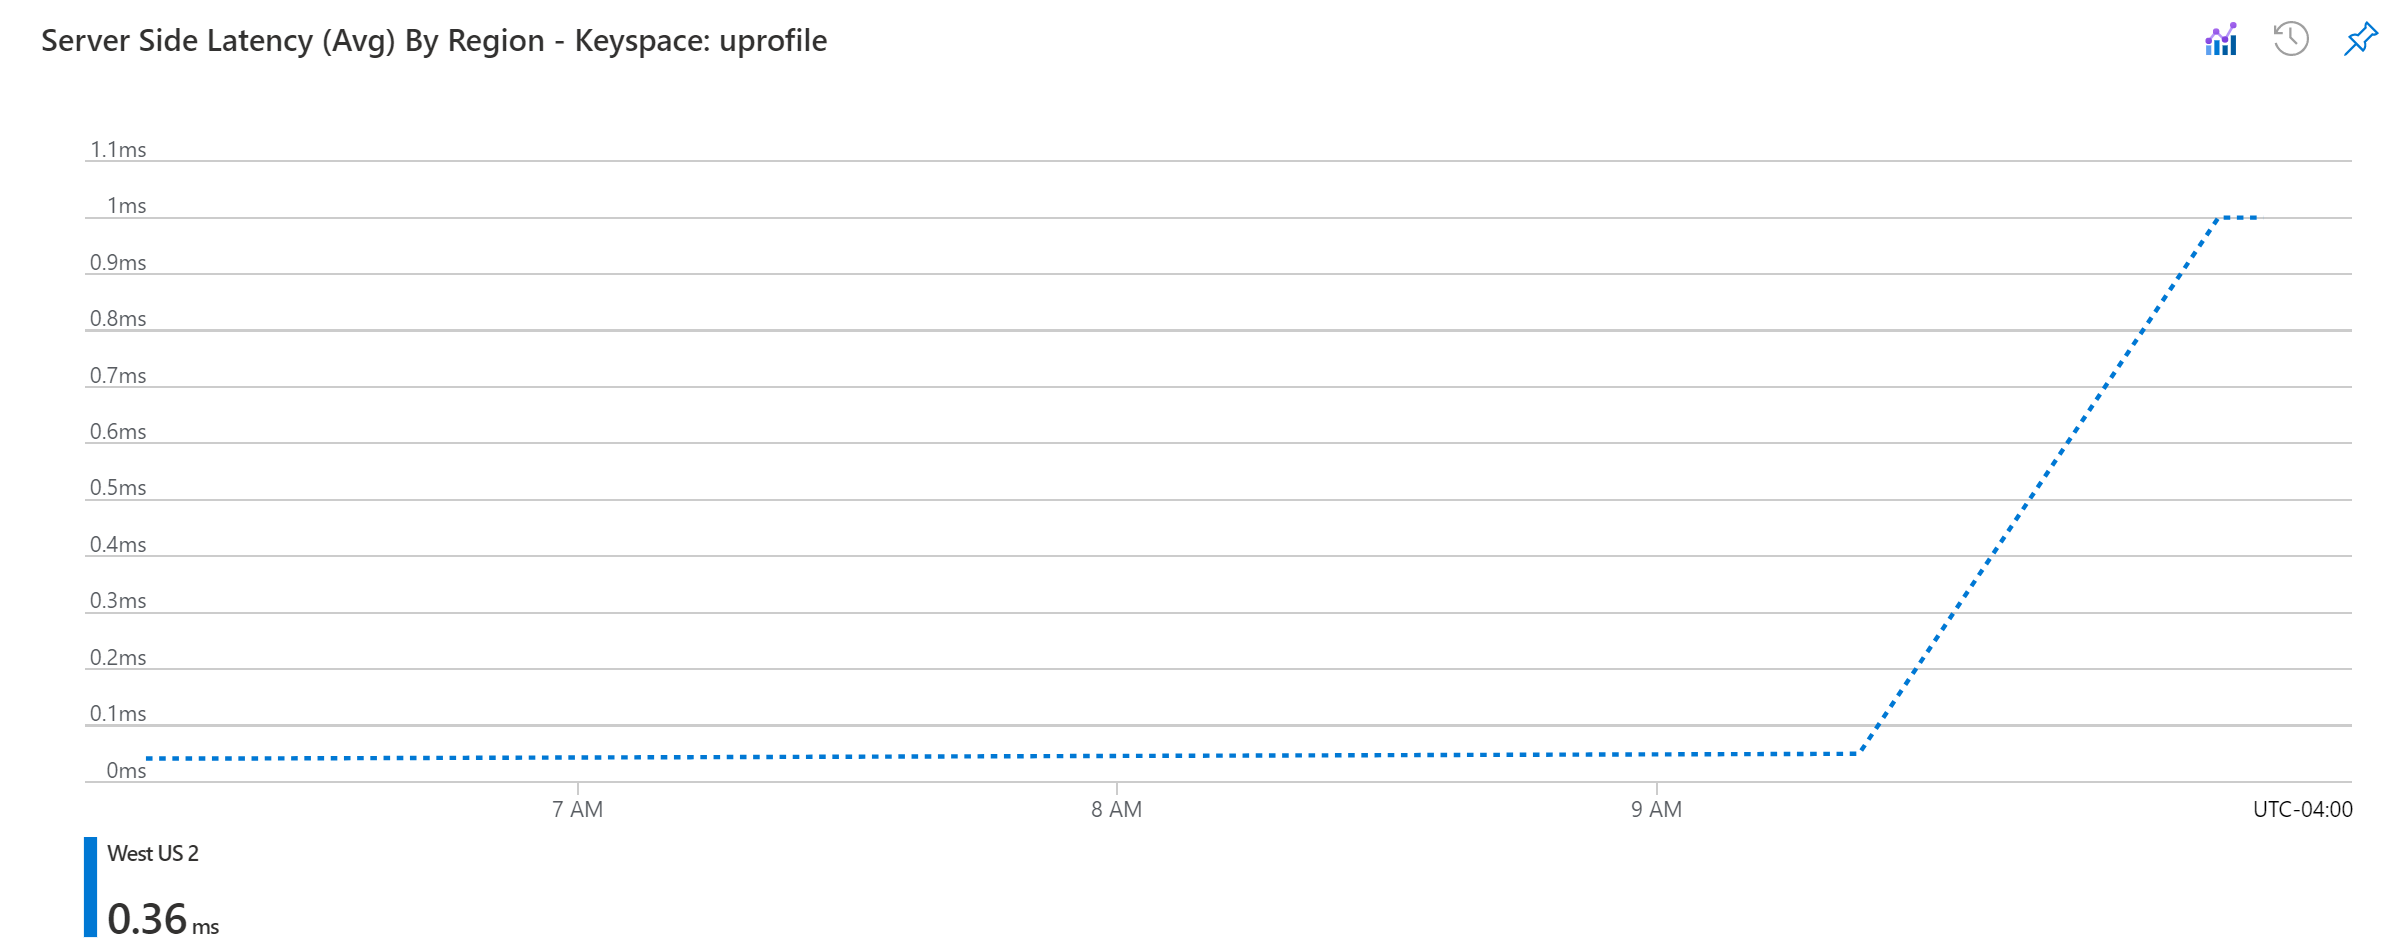
The server side latency (Avg) by region also displays a sudden latency spike on the server. It can help a customer differentiate between a client side latency spike and a server-side latency spike.

Also view server-side latency by different operations in a specific keyspace.
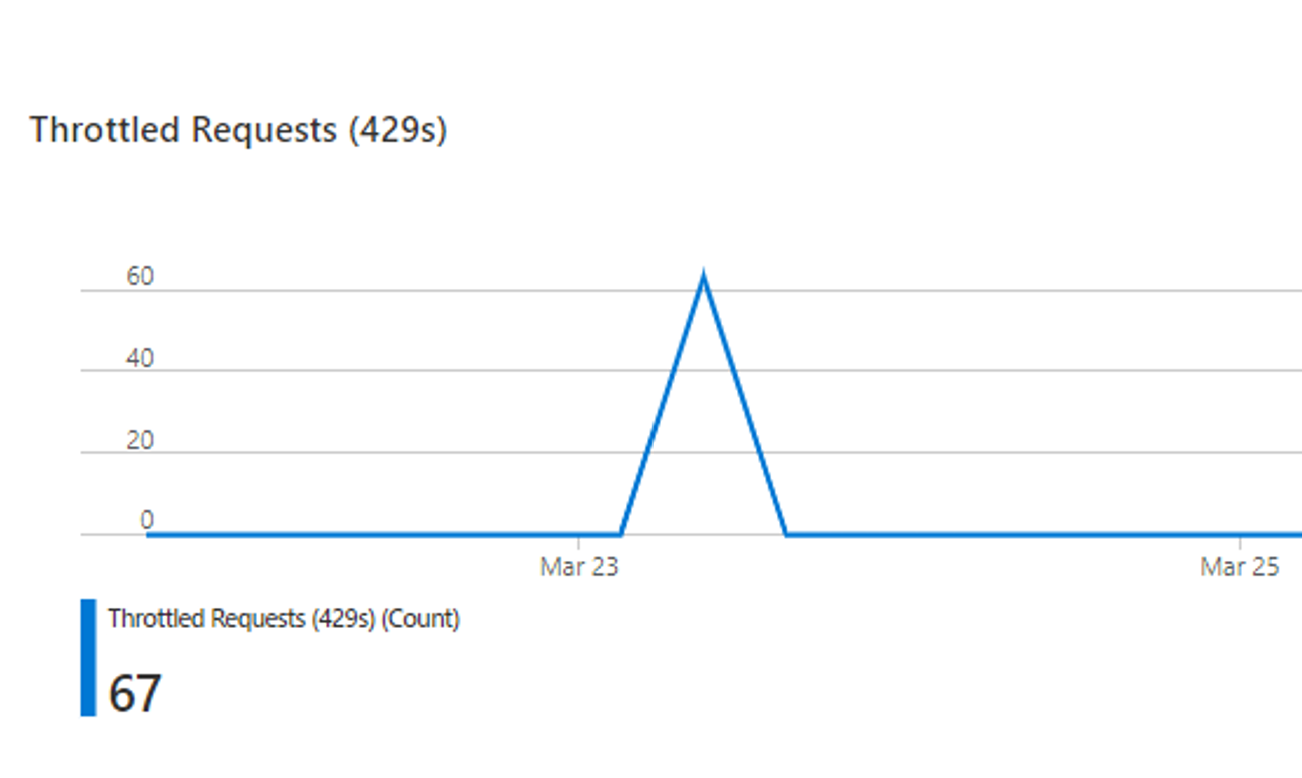
Is your application experiencing any throttling? The chart below shows the total number of requests failed with a 429-response code. Exceeding provisioned throughput could be one of the reasons. Enable Server Side Retry when your application experiences high throttling due to higher consumption of request units than what is allocated.
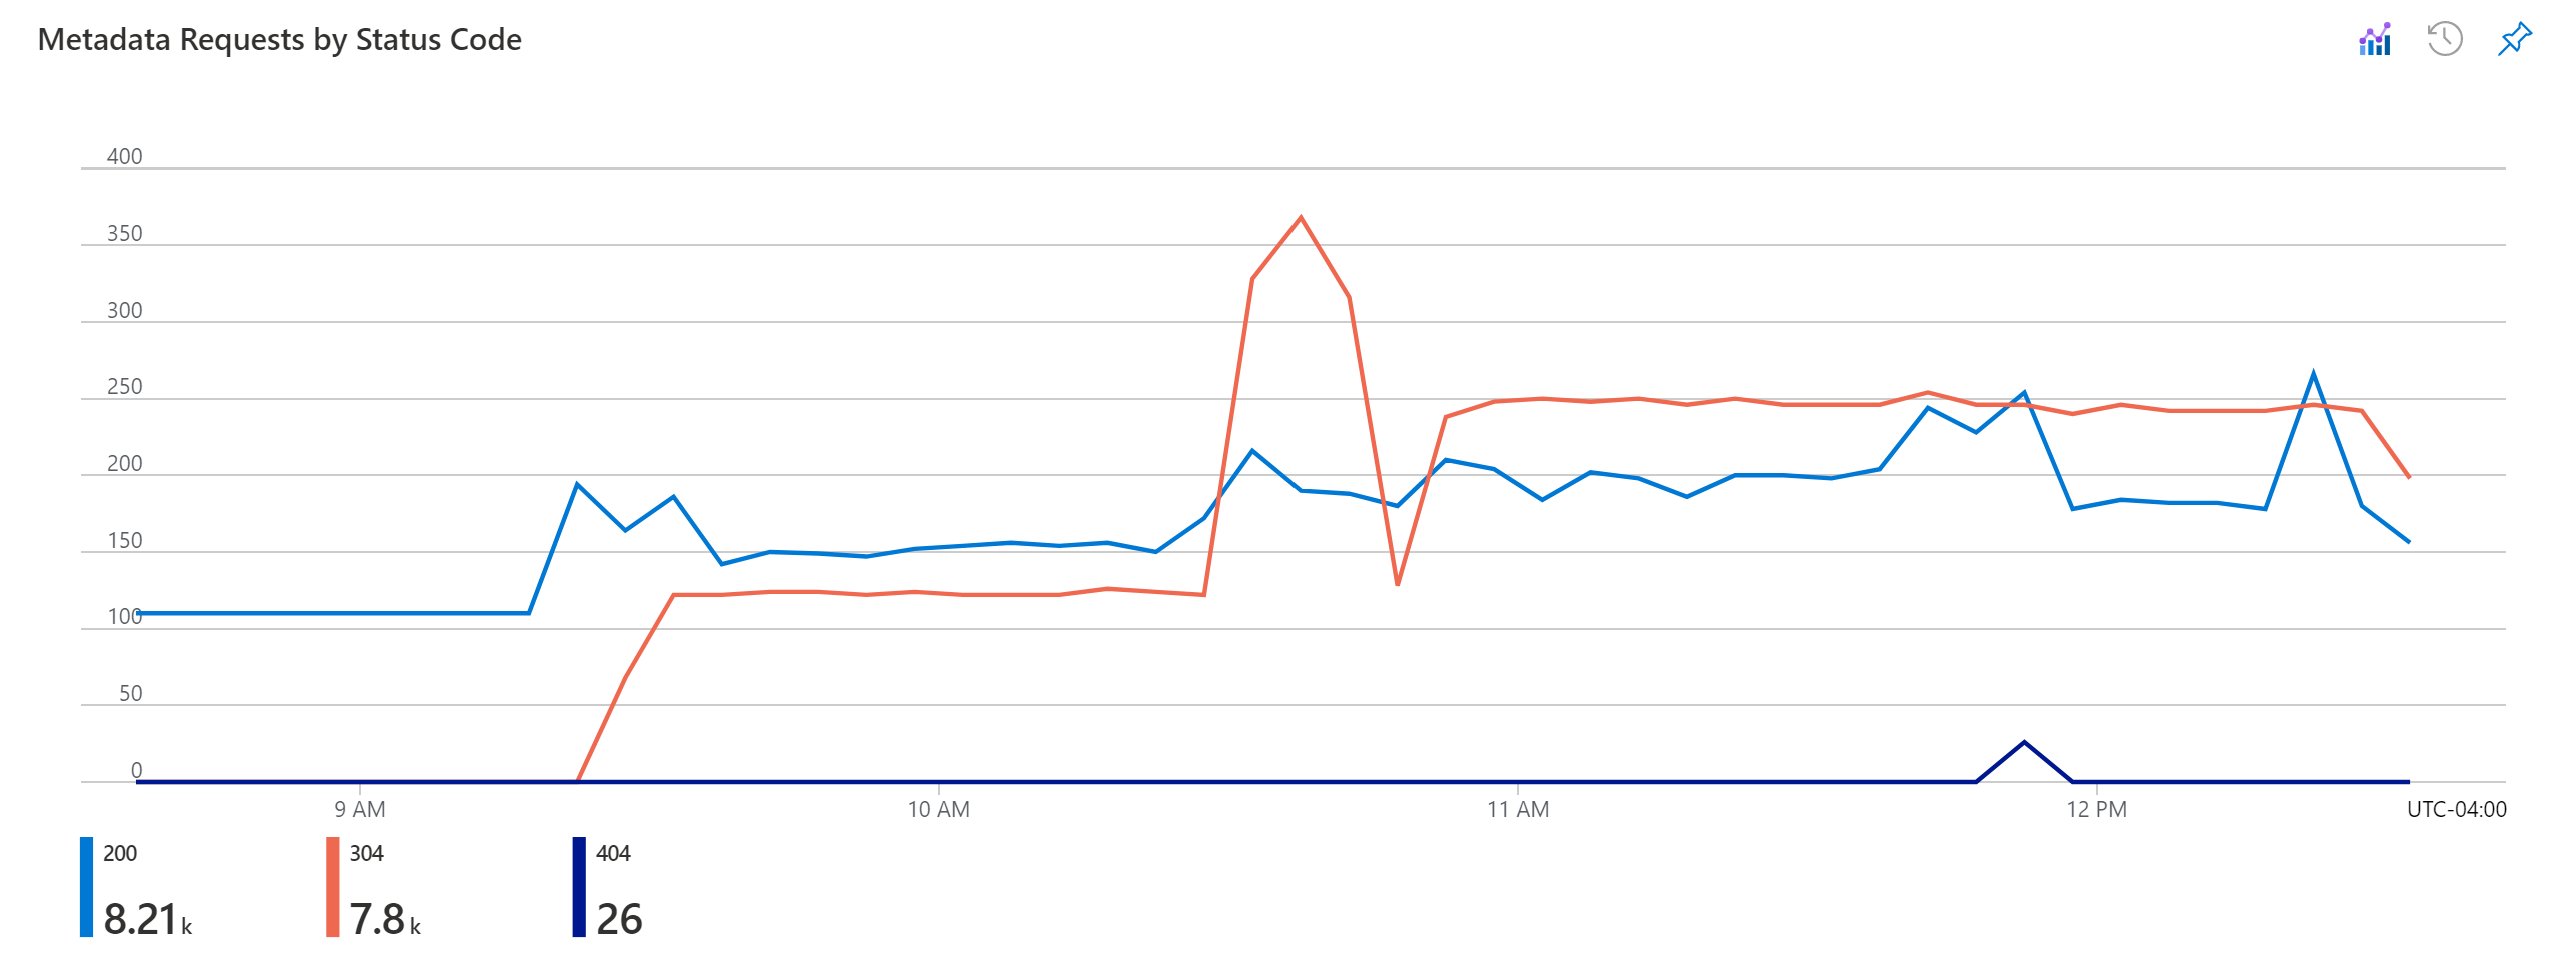
System and management operations
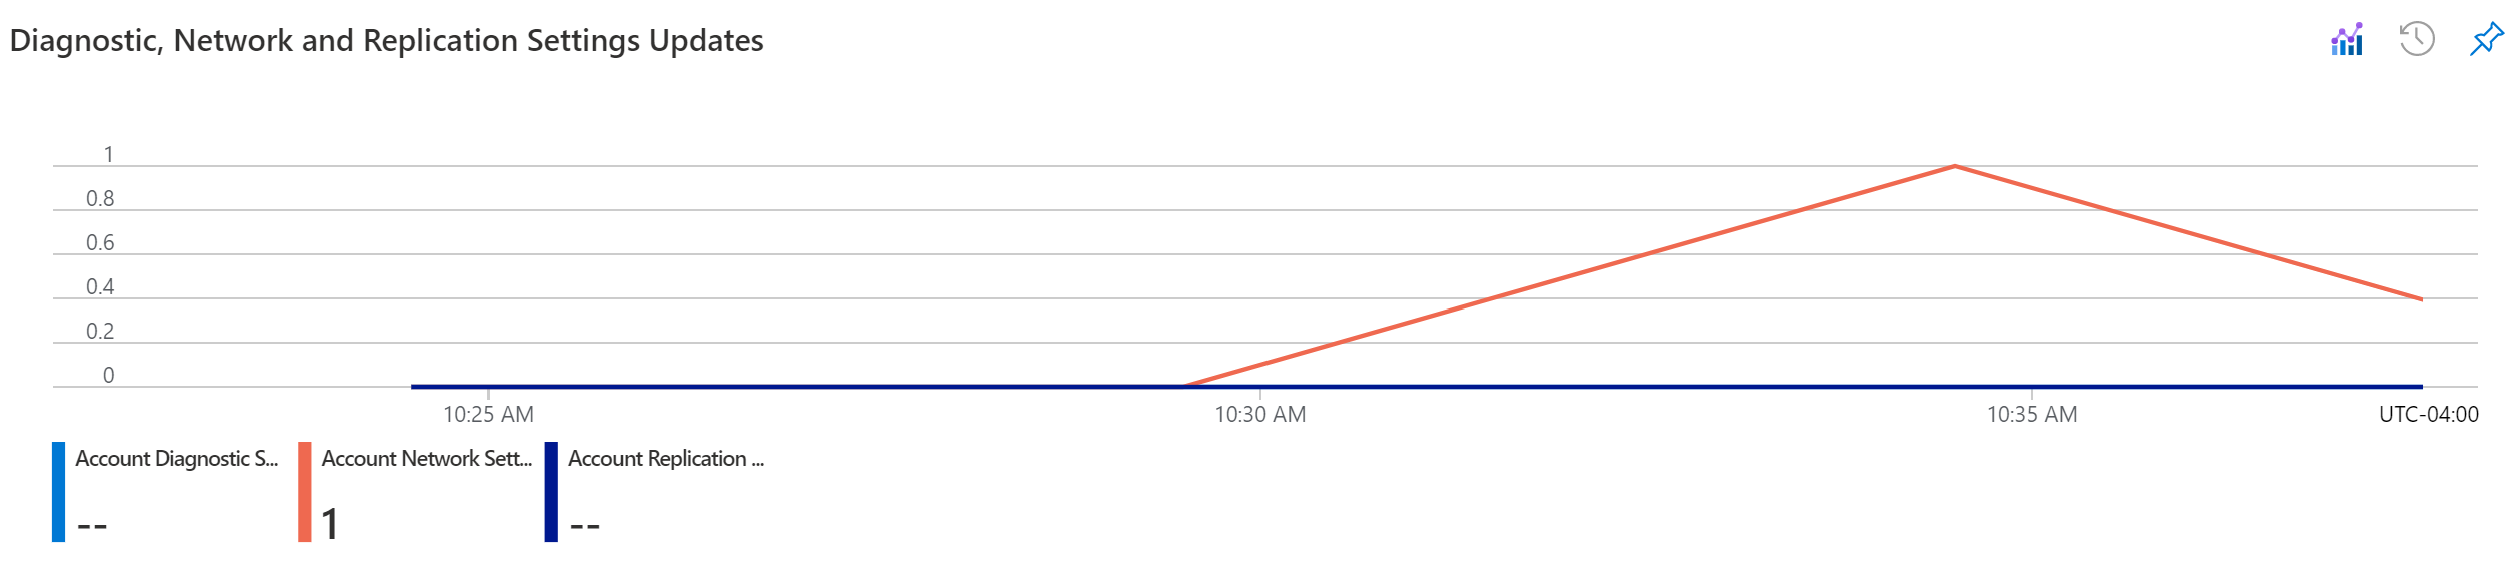
The system view helps show metadata requests count by primary partition. It also helps identify throttled requests. The management operation shows the account activities such as creation, deletion, key, network and replication settings. Request volume per status code over a time period.
- Metric chart for account diagnostic, network and replication settings over a specified period and filtered based on a Keyspace.
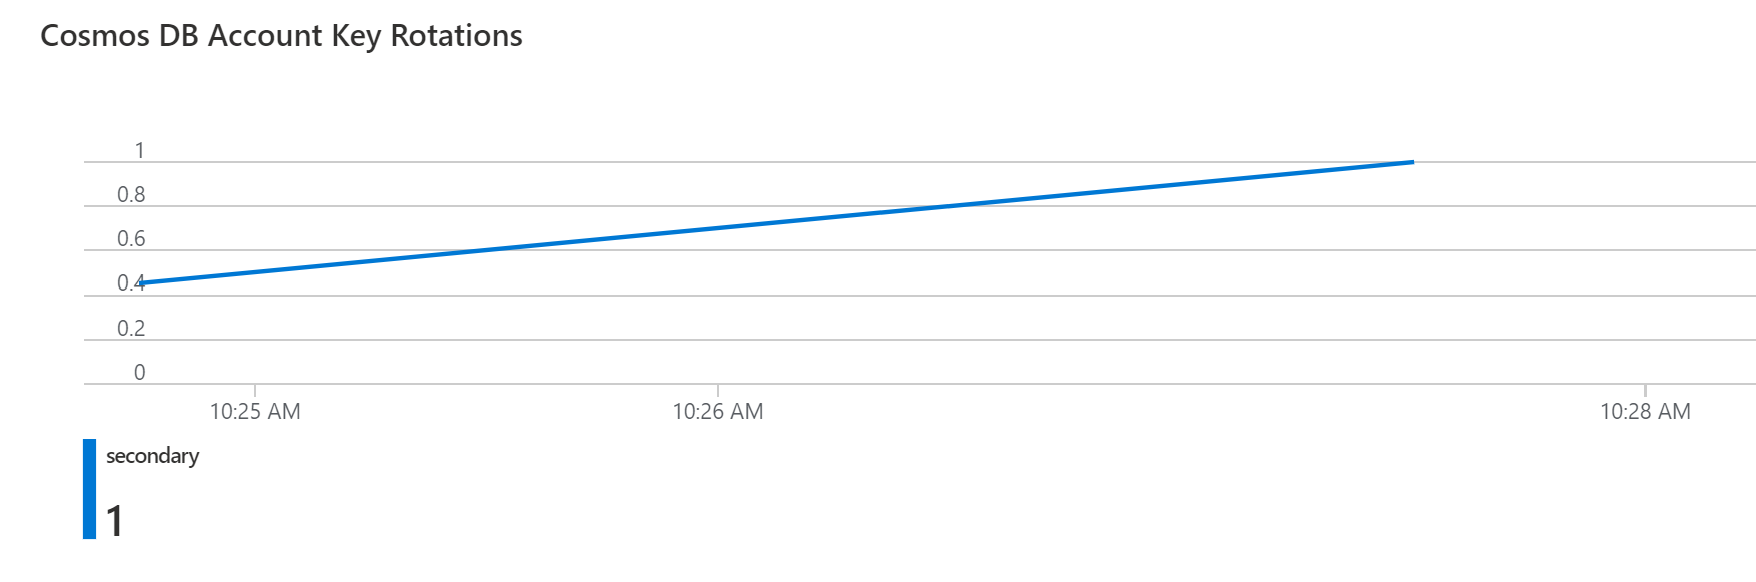
- Metric chart to view account key rotation.
You can view changes to primary or secondary password for your API for Cassandra account.
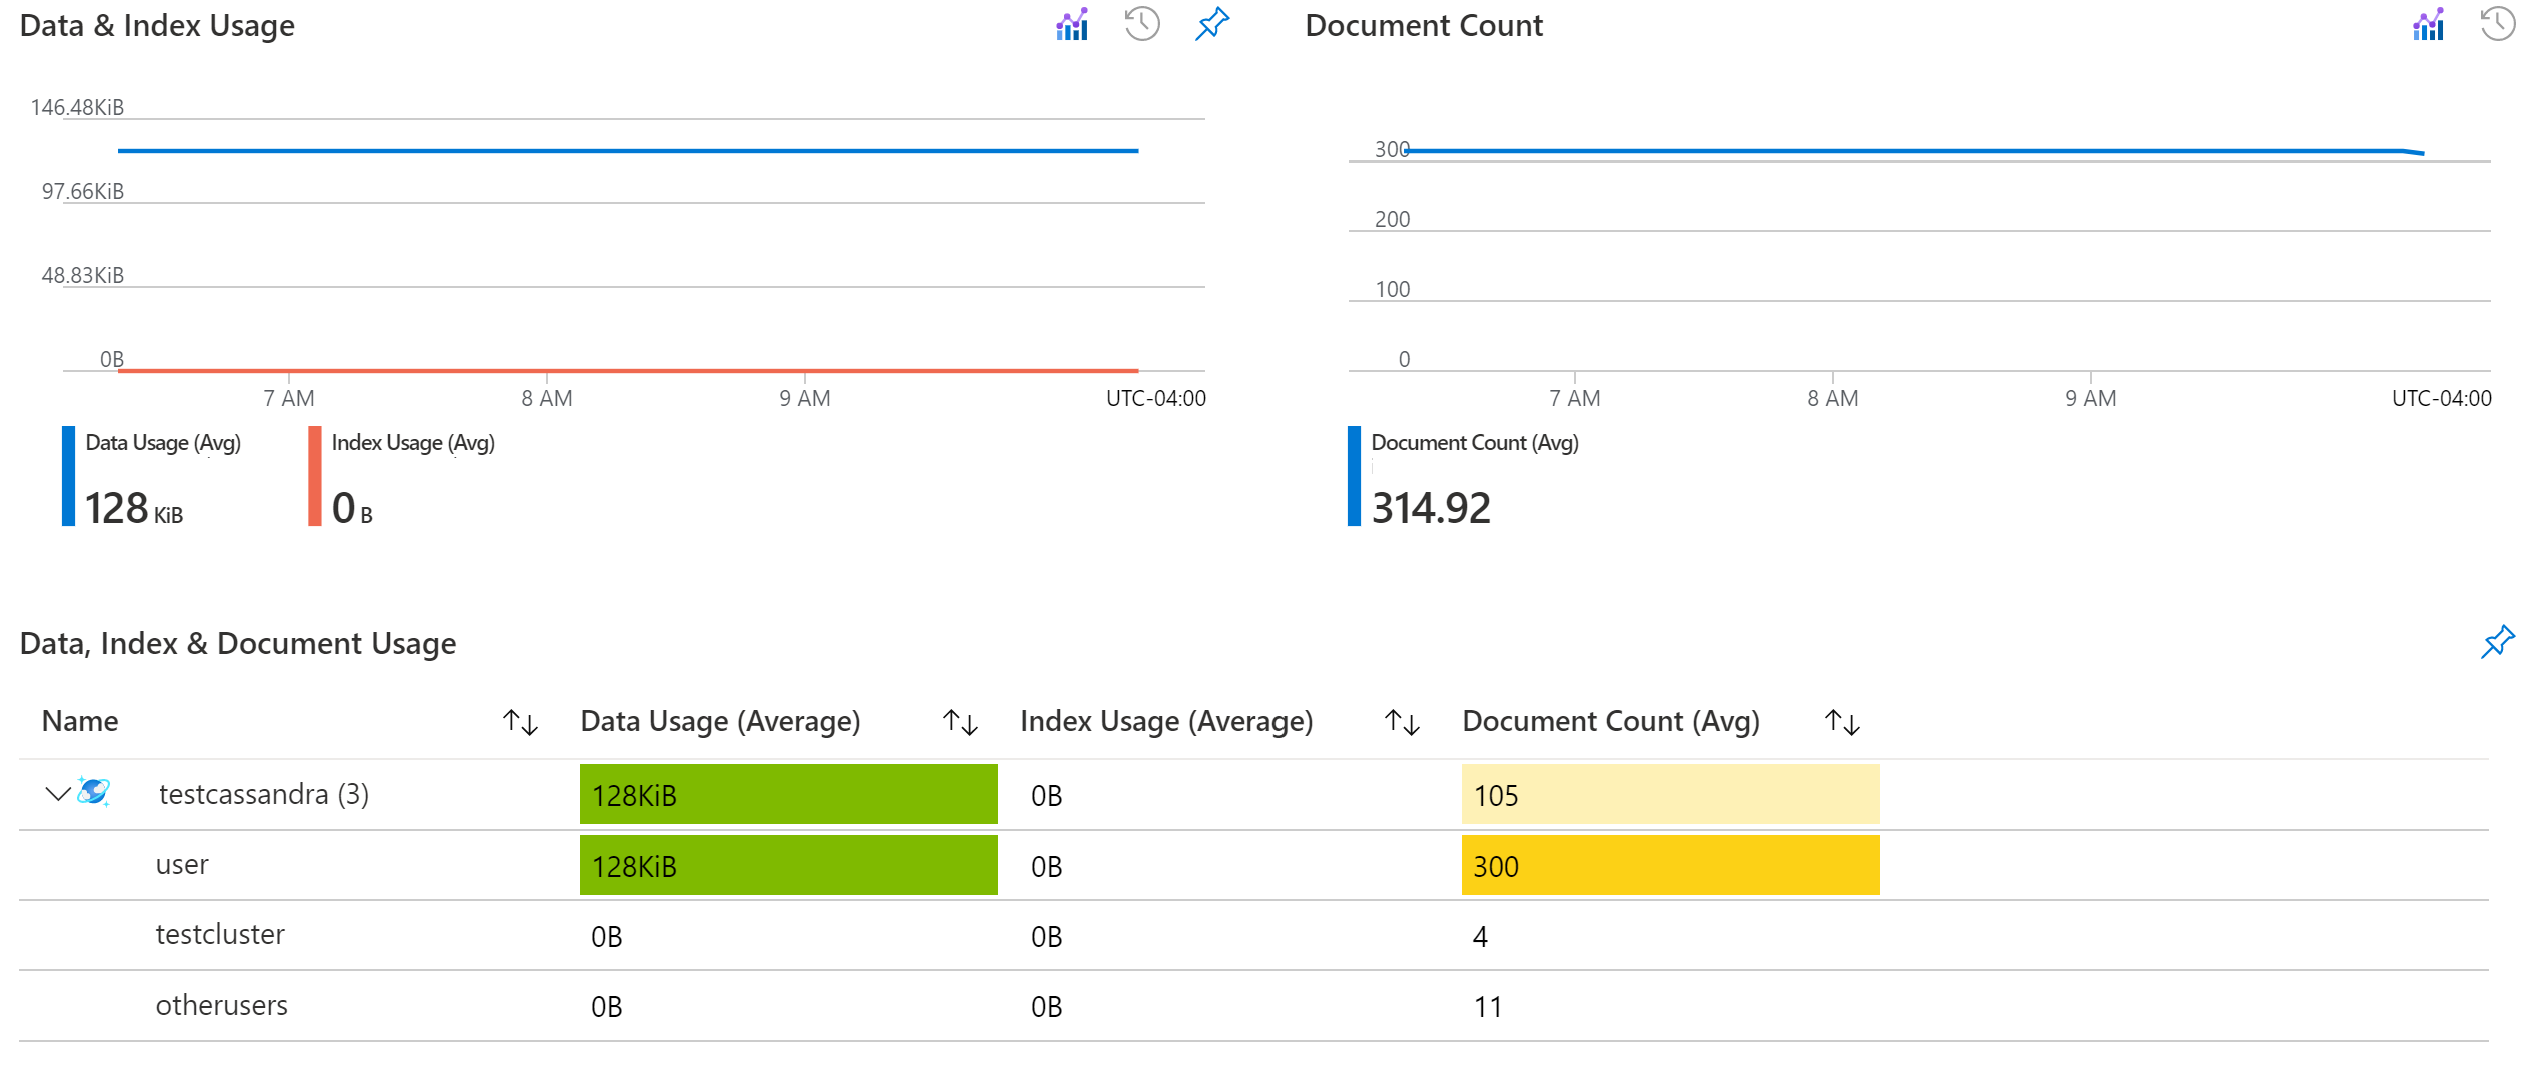
Storage
Storage distribution for raw and index storage. Also a count of documents in the API for Cassandra account.
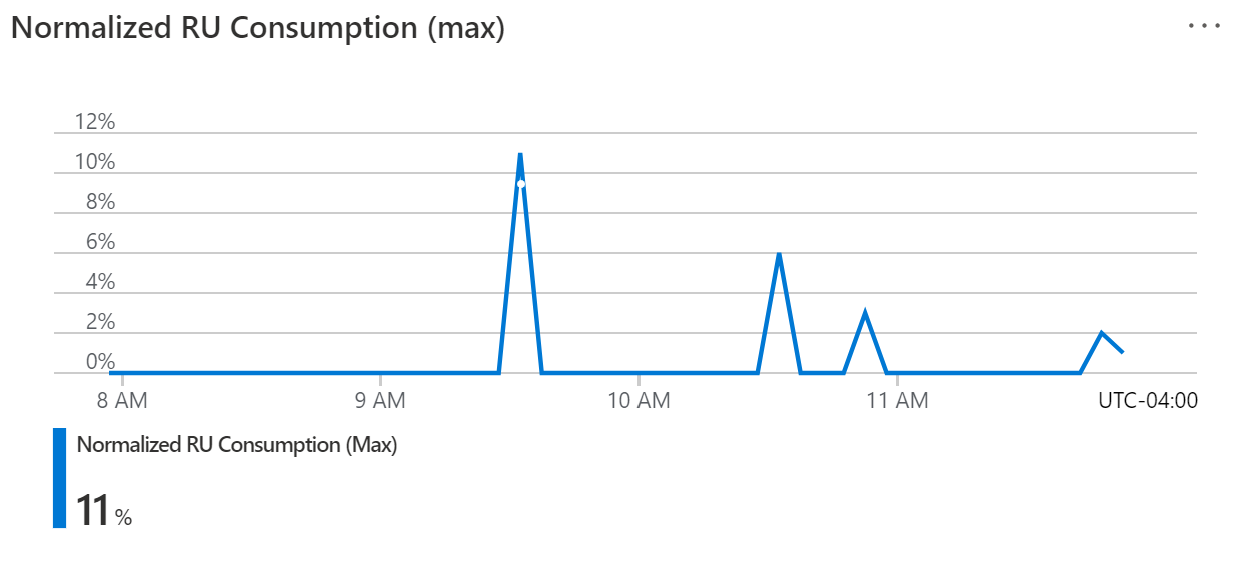
Maximum request units consumption for an account over a defined time period.
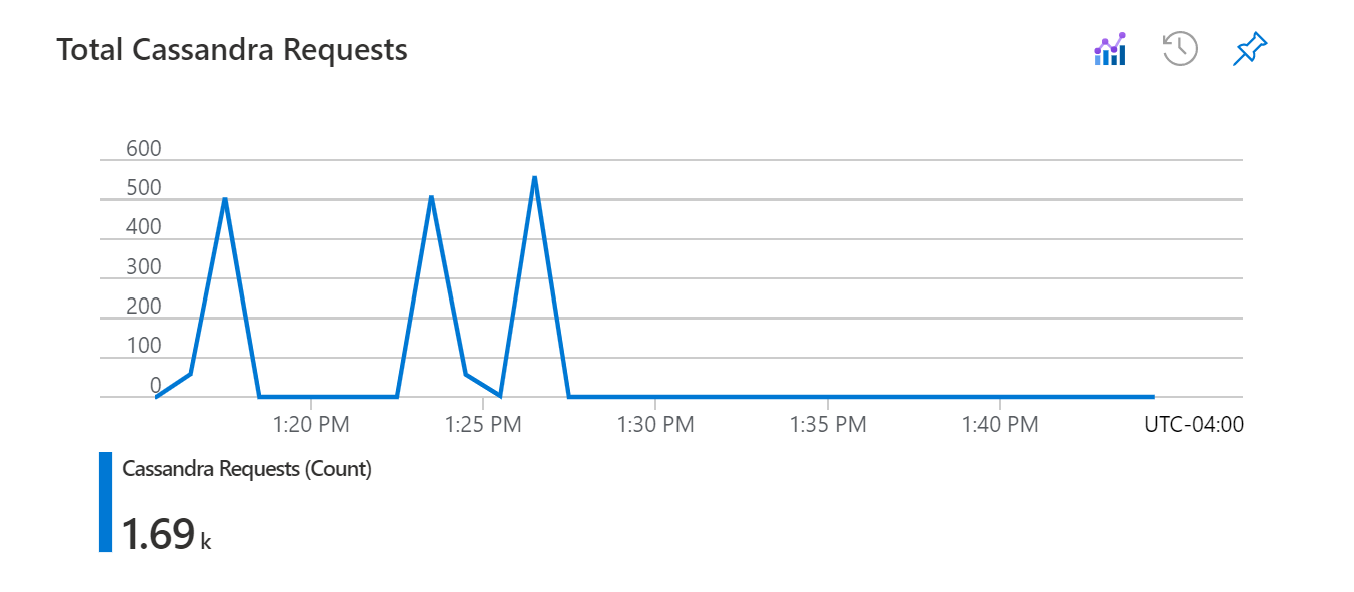
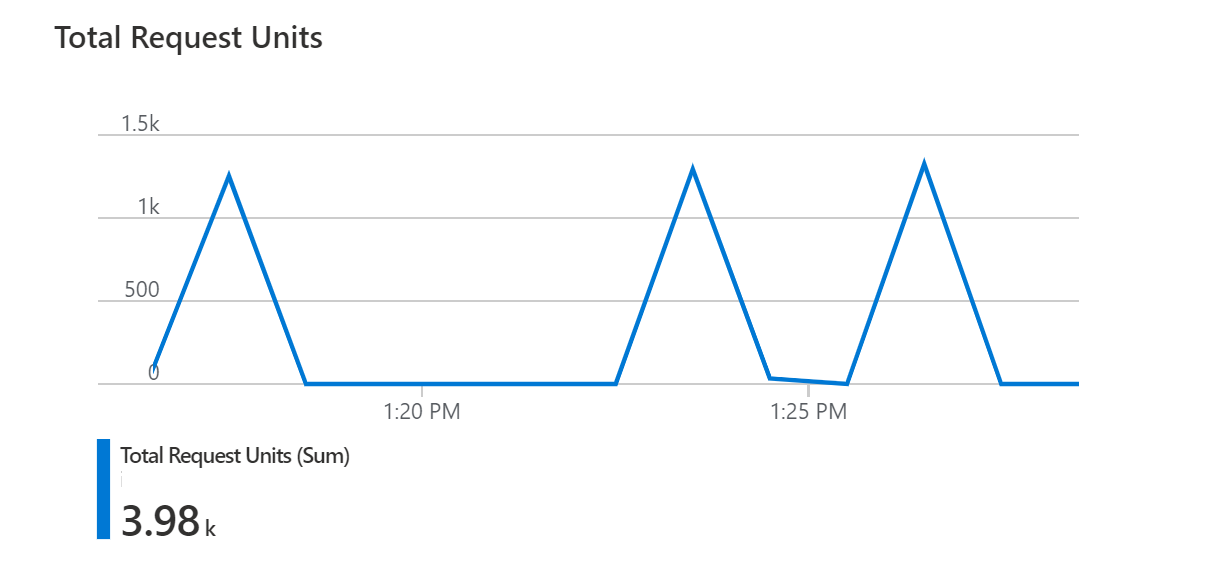
Throughput and requests
The Total Request Units metric displays the requests unit usage based on operation types.
These operations can be analyzed within a given time interval, defined keyspace or table.
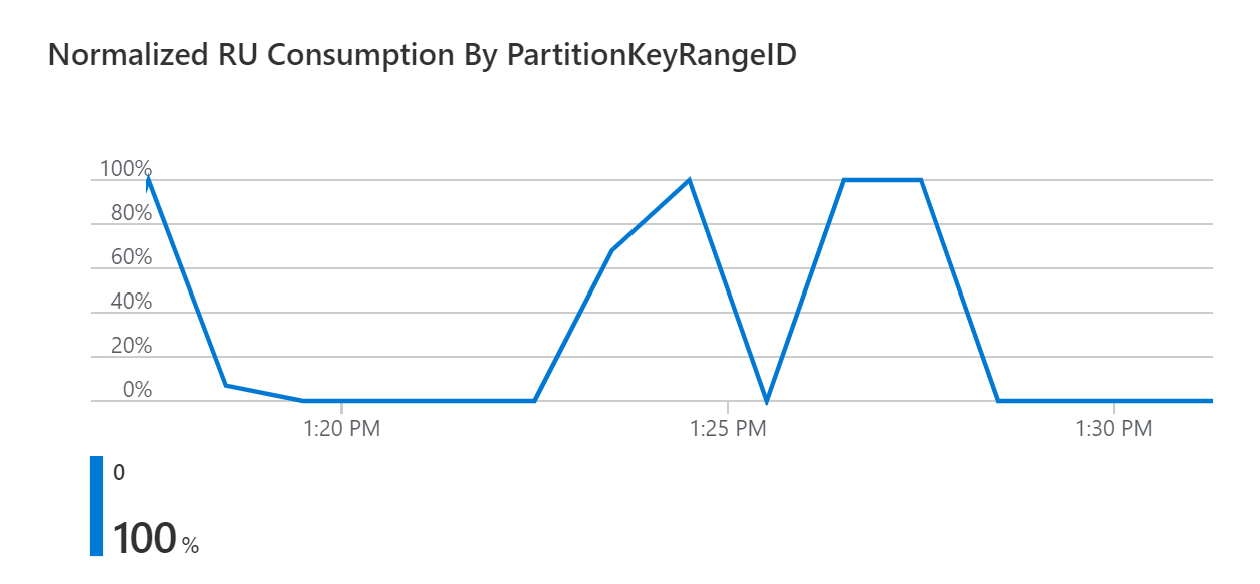
The Normalized RU Consumption metric is a metric between 0% to 100% that is used to help measure the utilization of provisioned throughput on a database or container. The metric can also be used to view the utilization of individual partition key ranges on a database or container. One of the main factors of a scalable application is having a good cardinality of partition keys. The chart below shows if your application’s high RU consumption is because of hot partition.
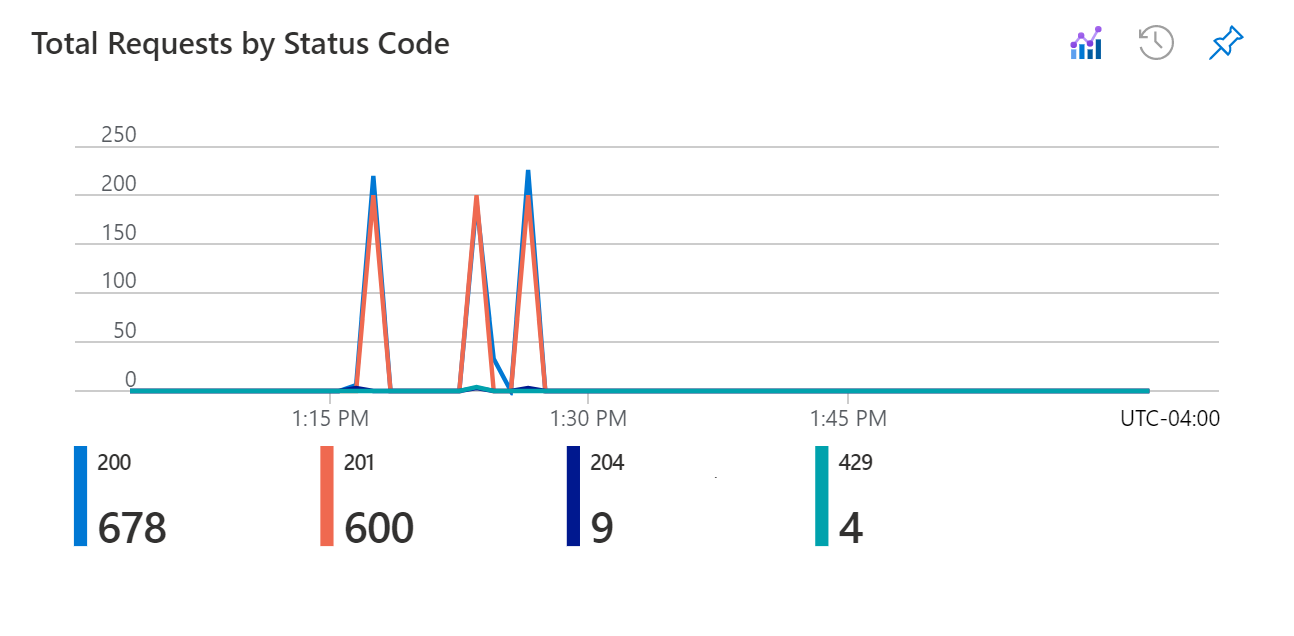
The chart below shows a breakdown of requests by different status code. Understand the meaning of the different codes for your API for Cassandra codes.
Next steps
Feedback
Coming soon: Throughout 2024 we will be phasing out GitHub Issues as the feedback mechanism for content and replacing it with a new feedback system. For more information see: https://aka.ms/ContentUserFeedback.
Submit and view feedback for