Use Azure Cosmos DB change feed to visualize real-time data analytics
APPLIES TO: ![]() NoSQL
NoSQL
The Azure Cosmos DB change feed is a mechanism to get a continuous and incremental feed of records from an Azure Cosmos DB container as those records are being created or modified. Change feed support works by listening to container for any changes. It then outputs the sorted list of documents that were changed in the order in which they were modified. To learn more about change feed, see working with change feed article.
This article describes how change feed can be used by an e-commerce company to understand user patterns, perform real-time data analysis and visualization. You will analyze events such as a user viewing an item, adding an item to their cart, or purchasing an item. When one of these events occurs, a new record is created, and the change feed logs that record. Change feed then triggers a series of steps resulting in visualization of metrics that analyze the company performance and activity. Sample metrics that you can visualize include revenue, unique site visitors, most popular items, and average price of the items that are viewed versus added to a cart versus purchased. These sample metrics can help an e-commerce company evaluate its site popularity, develop its advertising and pricing strategies, and make decisions regarding what inventory to invest in.
Solution components
The following diagram represents the data flow and components involved in the solution:
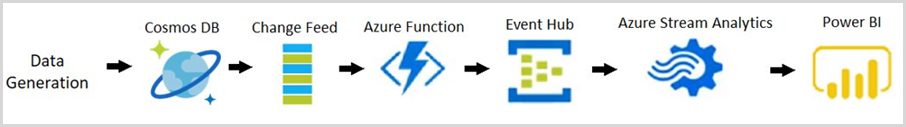
Data Generation: Data simulator is used to generate retail data that represents events such as a user viewing an item, adding an item to their cart, and purchasing an item. You can generate large set of sample data by using the data generator. The generated sample data contains documents in the following format:
{
  "CartID": 2486,
  "Action": "Viewed",
  "Item": "Women's Denim Jacket",
  "Price": 31.99
}
Azure Cosmos DB: The generated data is stored in an Azure Cosmos DB container.
Change Feed: The change feed will listen for changes to the Azure Cosmos DB container. Each time a new document is added into the collection (that is when an event occurs such a user viewing an item, adding an item to their cart, or purchasing an item), the change feed will trigger an Azure Function.
Azure Function: The Azure Function processes the new data and sends it to Azure Event Hubs.
Azure event hub: The event hub stores these events and sends them to Azure Stream Analytics to perform further analysis.
Azure Stream Analytics: Azure Stream Analytics defines queries to process the events and perform real-time data analysis. This data is then sent to Microsoft Power BI.
Power BI: Power BI is used to visualize the data sent by Azure Stream Analytics. You can build a dashboard to see how the metrics change in real time.
Prerequisites
Microsoft .NET Framework 4.7.1 or higher
Microsoft .NET Core 2.1 (or higher)
Visual Studio with Universal Windows Platform development, .NET desktop development, and ASP.NET and web development workloads
Microsoft Azure Subscription
Microsoft Power BI Account
Download the Azure Cosmos DB change feed lab from GitHub.
Create Azure resources
Create the Azure resources: Azure Cosmos DB, storage account, event hub, and Stream Analytics required by the solution. You will deploy these resources through an Azure Resource Manager template. Use the following steps to deploy these resources:
Set the Windows PowerShell execution policy to Unrestricted. To do so, open Windows PowerShell as an Administrator and run the following commands:
Get-ExecutionPolicy
Set-ExecutionPolicy Unrestricted
From the GitHub repository you downloaded in the previous step, navigate to the Azure Resource Manager folder, and open the file called parameters.json file.
Provide values for
cosmosdbaccount_name,eventhubnamespace_name,storageaccount_name, parameters as indicated in parameters.json file. You'll need to use the names that you give to each of your resources later.From Windows PowerShell, navigate to the Azure Resource Manager folder and run the following command:
.\deploy.ps1When prompted, enter your Azure Subscription ID, changefeedlab for the resource group name, and run1 for the deployment name. Once the resources begin to deploy, it may take up to 10 minutes for it to complete.
Create a database and the collection
You will now create a collection to hold e-commerce site events. When a user views an item, adds an item to their cart, or purchases an item, the collection will receive a record that includes the action ("viewed", "added", or "purchased"), the name of the item involved, the price of the item involved, and the ID number of the user cart involved.
Go to Azure portal and find the Azure Cosmos DB Account that's been created by the template deployment.
From the Data Explorer pane, select New Collection and fill the form with the following details:
- For the Database id field, select Create new, then enter changefeedlabdatabase. Leave the Provision database throughput box unchecked.
- For the Collection id field, enter changefeedlabcollection.
- For the Partition key field, enter /Item. This is case-sensitive, so make sure you enter it correctly.
- For the Throughput field, enter 10000.
- Select the OK button.
Next create another collection named leases for change feed processing. The leases collection coordinates processing the change feed across multiple workers. A separate collection is used to store the leases with one lease per partition.
Return to the Data Explorer pane and select New Collection and fill the form with the following details:
- For the Database id field, select Use existing, then enter changefeedlabdatabase.
- For the Collection id field, enter leases.
- For Storage capacity, select Fixed.
- Leave the Throughput field set to its default value.
- Select the OK button.
Get the connection string and keys
Get the Azure Cosmos DB connection string
Go to Azure portal and find the Azure Cosmos DB Account that's created by the template deployment.
Navigate to the Keys pane, copy the PRIMARY CONNECTION STRING and copy it to a notepad or another document that you will have access to throughout the lab. You should label it Azure Cosmos DB Connection String. You'll need to copy the string into your code later, so take a note and remember where you are storing it.
Get the storage account key and connection string
Azure Storage Accounts allow users to store data. In this lab, you will use a storage account to store data that is used by the Azure Function. The Azure Function is triggered when any modification is made to the collection.
Return to your resource group and open the storage account that you created earlier
Select Access keys from the menu on the left-hand side.
Copy the values under key 1 to a notepad or another document that you will have access to throughout the lab. You should label the Key as Storage Key and the Connection string as Storage Connection String. You'll need to copy these strings into your code later, so take a note and remember where you are storing them.
Get the event hub namespace connection string
An Azure event hub receives the event data, stores, processes, and forwards the data. In this lab, the event hub will receive a document every time a new event occurs (whenever an item is viewed by a user, added to a user's cart, or purchased by a user) and then will forward that document to Azure Stream Analytics.
Return to your resource group and open the Event Hubs Namespace that you created and named in the prelab.
Select Shared access policies from the menu on the left-hand side.
Select RootManageSharedAccessKey. Copy the Connection string-primary key to a notepad or another document that you will have access to throughout the lab. You should label it Event Hub Namespace connection string. You'll need to copy the string into your code later, so take a note and remember where you are storing it.
Set up Azure Function to read the change feed
When a new document is created, or a current document is modified in an Azure Cosmos DB container, the change feed automatically adds that modified document to its history of collection changes. You will now build and run an Azure Function that processes the change feed. When a document is created or modified in the collection you created, the Azure Function will be triggered by the change feed. Then the Azure Function will send the modified document to the event hub.
Return to the repository that you cloned on your device.
Right-click the file named ChangeFeedLabSolution.sln and select Open With Visual Studio.
Navigate to local.settings.json in Visual Studio. Then use the values you recorded earlier to fill in the blanks.
Navigate to ChangeFeedProcessor.cs. In the parameters for the Run function, perform the following actions:
- Replace the text YOUR COLLECTION NAME HERE with the name of your collection. If you followed earlier instructions, the name of your collection is changefeedlabcollection.
- Replace the text YOUR LEASES COLLECTION NAME HERE with the name of your leases collection. If you followed earlier instructions, the name of your leases collection is leases.
- At the top of Visual Studio, make sure that the Startup Project box on the left of the green arrow says ChangeFeedFunction.
- Select Start at the top of the page to run the program
- You can confirm that the function is running when the console app says "Job host started".
Insert data into Azure Cosmos DB
To see how change feed processes new actions on an e-commerce site, have to simulate data that represents users viewing items from the product catalog, adding those items to their carts, and purchasing the items in their carts. This data is arbitrary and used for replicating what data on an e-commerce site would look like.
Navigate back to the repository in File Explorer, and right-click ChangeFeedFunction.sln to open it again in a new Visual Studio window.
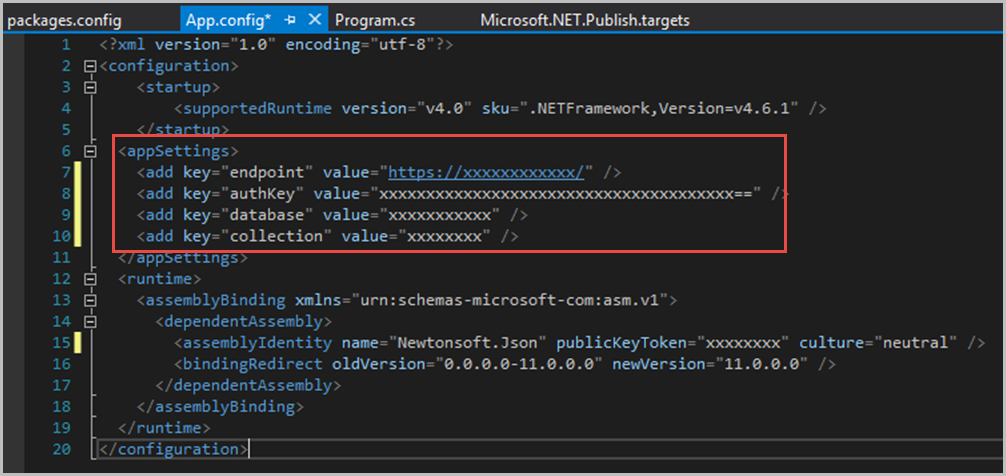
Navigate to the App.config file.Within the
<appSettings>block, add the endpoint and unique PRIMARY KEY that of your Azure Cosmos DB account that you retrieved earlier.Add in the collection and database names. (These names should be changefeedlabcollection and changefeedlabdatabase unless you choose to name yours differently.)
Save the changes on all the files edited.
At the top of Visual Studio, make sure that the Startup Project box on the left of the green arrow says DataGenerator. Then select Start at the top of the page to run the program.
Wait for the program to run. The stars mean that data is coming in! Keep the program running - it is important that lots of data is collected.
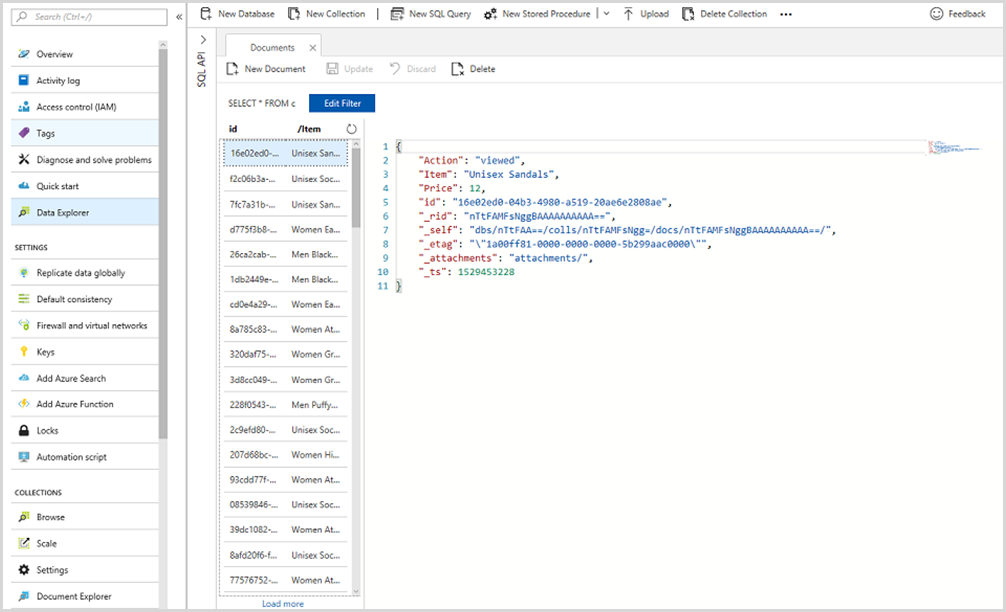
If you navigate to Azure portal , then to the Azure Cosmos DB account within your resource group, then to Data Explorer, you will see the randomized data imported in your changefeedlabcollection .
Set up a stream analytics job
Azure Stream Analytics is a fully managed cloud service for real-time processing of streaming data. In this lab, you will use stream analytics to process new events from the event hub (when an item is viewed, added to a cart, or purchased), incorporate those events into real-time data analysis, and send them into Power BI for visualization.
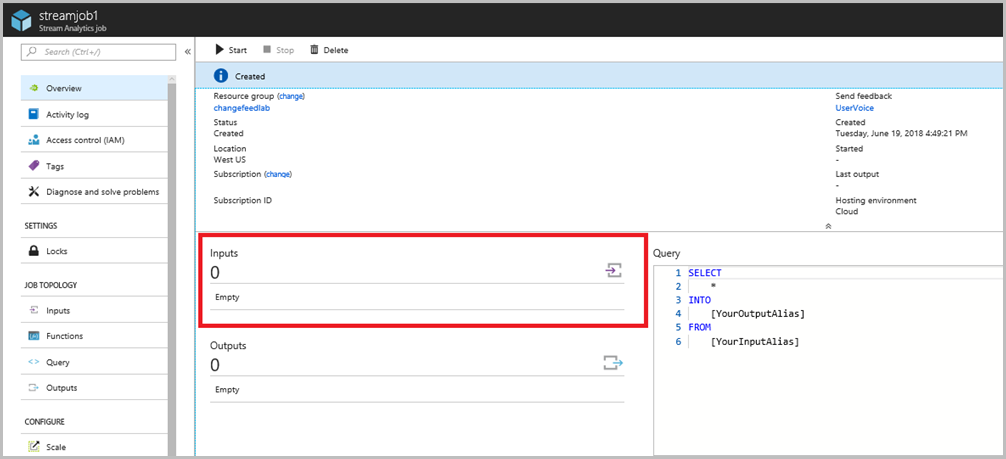
From the Azure portal, navigate to your resource group, then to streamjob1 (the stream analytics job that you created in the prelab).
Select Inputs as demonstrated below.
Select + Add stream input. Then select Event Hub from the drop-down menu.
Fill the new input form with the following details:
- In the Input alias field, enter input.
- Select the option for Select Event Hub from your subscriptions.
- Set the Subscription field to your subscription.
- In the Event Hubs namespace field, enter the name of your event hub namespace that you created during the prelab.
- In the Event Hub name field, select the option for Use existing and choose event-hub1 from the drop-down menu.
- Leave Event Hub policy name field set to its default value.
- Leave Event serialization format as JSON.
- Leave Encoding field set to UTF-8.
- Leave Event compression type field set to None.
- Select the Save button.
Navigate back to the stream analytics job page, and select Outputs.
Select + Add. Then select Power BI from the drop-down menu.
To create a new Power BI output to visualize average price, perform the following actions:
- In the Output alias field, enter averagePriceOutput.
- Leave the Group workspace field set to Authorize connection to load workspaces.
- In the Dataset name field, enter averagePrice.
- In the Table name field, enter averagePrice.
- Select the Authorize button, then follow the instructions to authorize the connection to Power BI.
- Select the Save button.
Then go back to streamjob1 and select Edit query.
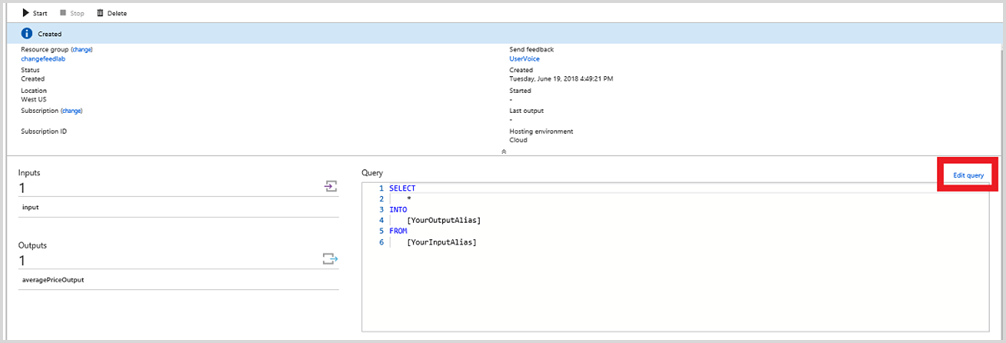
Paste the following query into the query window. The AVERAGE PRICE query calculates the average price of all items that are viewed by users, the average price of all items that are added to users' carts, and the average price of all items that are purchased by users. This metric can help e-commerce companies decide what prices to sell items at and what inventory to invest in. For example, if the average price of items viewed is much higher than the average price of items purchased, then a company might choose to add less expensive items to its inventory.
/*AVERAGE PRICE*/
SELECT System.TimeStamp AS Time, Action, AVG(Price)
 INTO averagePriceOutput
 FROM input
 GROUP BY Action, TumblingWindow(second,5)
Then select Save in the upper left-hand corner.
Now return to streamjob1 and select the Start button at the top of the page. Azure Stream Analytics can take a few minutes to start up, but eventually you will see it change from "Starting" to "Running".
Connect to Power BI
Power BI is a suite of business analytics tools to analyze data and share insights. It's a great example of how you can strategically visualize the analyzed data.
Sign in to Power BI and navigate to My Workspace by opening the menu on the left-hand side of the page.
Select + Create in the top right-hand corner and then select Dashboard to create a dashboard.
Select + Add tile in the top right-hand corner.
Select Custom Streaming Data, then select the Next button.
Select averagePrice from YOUR DATASETS, then select Next.
In the Visualization Type field, choose Clustered bar chart from the drop-down menu. Under Axis, add action. Skip Legend without adding anything. Then, under the next section called Value, add avg. Select Next, then title your chart, and select Apply. You should see a new chart on your dashboard!
Now, if you want to visualize more metrics, you can go back to streamjob1 and create three more outputs with the following fields.
a. Output alias: incomingRevenueOutput, Dataset name: incomingRevenue, Table name: incomingRevenue
b. Output alias: top5Output, Dataset name: top5, Table name: top5
c. Output alias: uniqueVisitorCountOutput, Dataset name: uniqueVisitorCount, Table name: uniqueVisitorCountThen select Edit query and paste the following queries above the one you already wrote.
 /*TOP 5*/
 WITH Counter AS
 (
 SELECT Item, Price, Action, COUNT(*) AS countEvents
 FROM input
 WHERE Action = 'Purchased'
 GROUP BY Item, Price, Action, TumblingWindow(second,30)
 ),
 top5 AS
 (
 SELECT DISTINCT
 CollectTop(5)  OVER (ORDER BY countEvents) AS topEvent
 FROM Counter
 GROUP BY TumblingWindow(second,30)
 ),
 arrayselect AS
 (
 SELECT arrayElement.ArrayValue
 FROM top5
 CROSS APPLY GetArrayElements(top5.topevent) AS arrayElement
 )
 SELECT arrayvalue.value.item, arrayvalue.value.price,   arrayvalue.value.countEvents
 INTO top5Output
 FROM arrayselect

 /*REVENUE*/
 SELECT System.TimeStamp AS Time, SUM(Price)
 INTO incomingRevenueOutput
 FROM input
 WHERE Action = 'Purchased'
 GROUP BY TumblingWindow(hour, 1)

 /*UNIQUE VISITORS*/
 SELECT System.TimeStamp AS Time, COUNT(DISTINCT CartID) as uniqueVisitors
 INTO uniqueVisitorCountOutput
 FROM input
 GROUP BY TumblingWindow(second, 5)
The TOP 5 query calculates the top five items, ranked by the number of times that they have been purchased. This metric can help e-commerce companies evaluate which items are most popular and can influence the company's advertising, pricing, and inventory decisions.
The REVENUE query calculates revenue by summing up the prices of all items purchased each minute. This metric can help e-commerce companies evaluate its financial performance and also understand what times of day contribute to most revenue. This can impact the overall company strategy, marketing in particular.
The UNIQUE VISITORS query calculates how many unique visitors are on the site every five seconds by detecting unique cart ID's. This metric can help e-commerce companies evaluate their site activity and strategize how to acquire more customers.
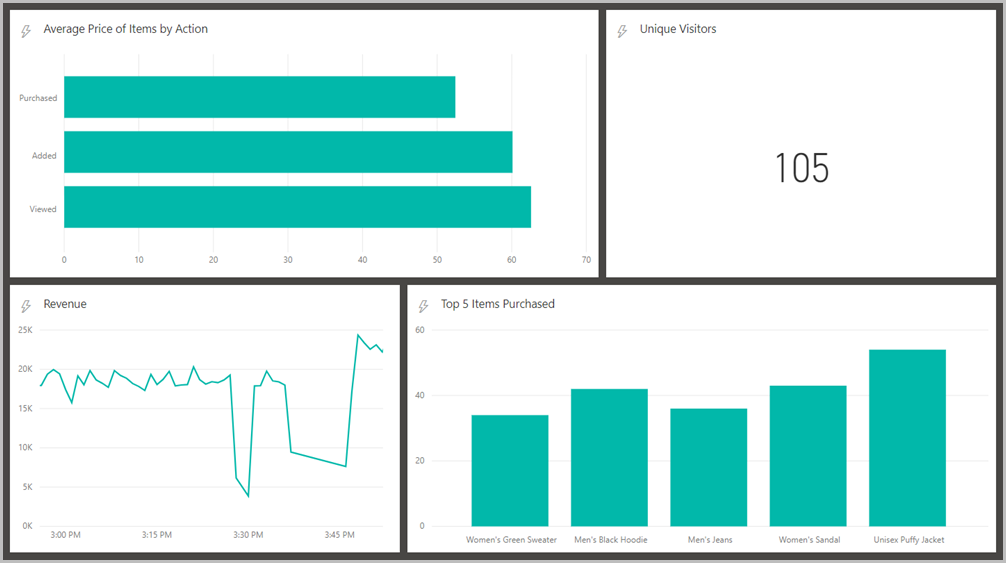
You can now add tiles for these datasets as well.
- For Top 5, it would make sense to do a clustered column chart with the items as the axis and the count as the value.
- For Revenue, it would make sense to do a line chart with time as the axis and the sum of the prices as the value. The time window to display should be the largest possible in order to deliver as much information as possible.
- For Unique Visitors, it would make sense to do a card visualization with the number of unique visitors as the value.
This is how a sample dashboard looks with these charts:
Optional: Visualize with an E-commerce site
You will now observe how you can use your new data analysis tool to connect with a real e-commerce site. In order to build the e-commerce site, use an Azure Cosmos DB database to store the list of product categories, the product catalog, and a list of the most popular items.
Navigate back to the Azure portal, then to your Azure Cosmos DB account, then to Data Explorer.
Add two collections under changefeedlabdatabase - products and categories with Fixed storage capacity.
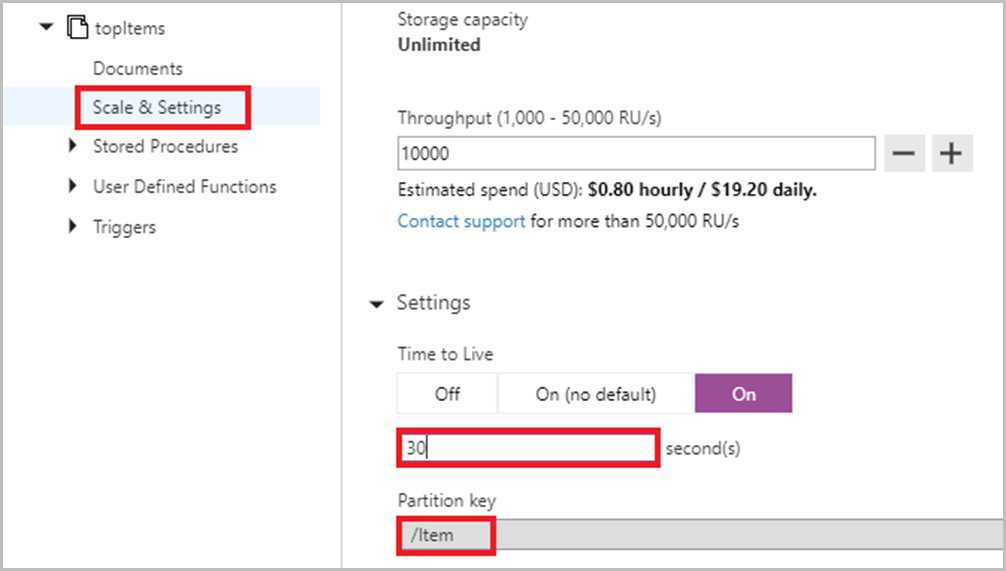
Add another collection under changefeedlabdatabase named topItems and /Item as the partition key.
Select the topItems collection, and under Scale and Settings set the Time to Live to be 30 seconds so that topItems updates every 30 seconds.
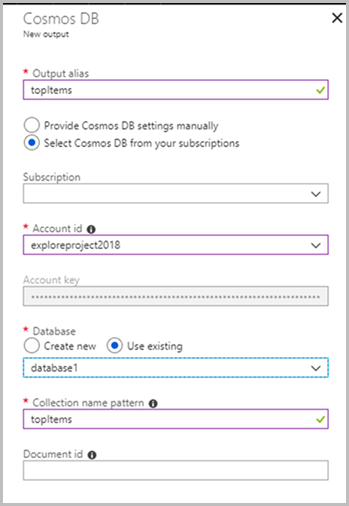
In order to populate the topItems collection with the most frequently purchased items, navigate back to streamjob1 and add a new Output. Select Azure Cosmos DB.
Fill in the required fields as pictured below.
If you added the optional TOP 5 query in the previous part of the lab, proceed to part 5a. If not, proceed to part 5b.
5a. In streamjob1, select Edit query and paste the following query in your Azure Stream Analytics query editor below the TOP 5 query but above the rest of the queries.
SELECT arrayvalue.value.item AS Item, arrayvalue.value.price, arrayvalue.value.countEvents
INTO topItems
FROM arrayselect
5b. In streamjob1, select Edit query and paste the following query in your Azure Stream Analytics query editor above all other queries.
/*TOP 5*/
WITH Counter AS
(
SELECT Item, Price, Action, COUNT(*) AS countEvents
FROM input
WHERE Action = 'Purchased'
GROUP BY Item, Price, Action, TumblingWindow(second,30)
),
top5 AS
(
SELECT DISTINCT
CollectTop(5)  OVER (ORDER BY countEvents) AS topEvent
FROM Counter
GROUP BY TumblingWindow(second,30)
),
arrayselect AS
(
SELECT arrayElement.ArrayValue
FROM top5
CROSS APPLY GetArrayElements(top5.topevent) AS arrayElement
)
SELECT arrayvalue.value.item AS Item, arrayvalue.value.price, arrayvalue.value.countEvents
INTO topItems
FROM arrayselect
Open EcommerceWebApp.sln and navigate to the Web.config file in the Solution Explorer.
Within the
<appSettings>block, add the URI and PRIMARY KEY that you saved earlier where it says your URI here and your primary key here. Then add in your database name and collection name as indicated. (These names should be changefeedlabdatabase and changefeedlabcollection unless you chose to name yours differently.)Fill in your products collection name, categories collection name, and top items collection name as indicated. (These names should be products, categories, and topItems unless you chose to name yours differently.)
Navigate to and open the Checkout folder within EcommerceWebApp.sln. Then open the Web.config file within that folder.
Within the
<appSettings>block, add the URI and PRIMARY KEY that you saved earlier, where indicated. Then, add in your database name and collection name as indicated. (These names should be changefeedlabdatabase and changefeedlabcollection unless you chose to name yours differently.)Press Start at the top of the page to run the program.
Now you can play around on the e-commerce site. When you view an item, add an item to your cart, change the quantity of an item in your cart, or purchase an item, these events will be passed through the Azure Cosmos DB change feed to event hub, Stream Analytics, and then Power BI. We recommend continuing to run DataGenerator to generate significant web traffic data and provide a realistic set of "Hot Products" on the e-commerce site.
Delete the resources
To delete the resources that you created during this lab, navigate to the resource group on Azure portal, then select Delete resource group from the menu at the top of the page and follow the instructions provided.
Next steps
- To learn more about change feed, see working with change feed support in Azure Cosmos DB
Feedback
Coming soon: Throughout 2024 we will be phasing out GitHub Issues as the feedback mechanism for content and replacing it with a new feedback system. For more information see: https://aka.ms/ContentUserFeedback.
Submit and view feedback for