Use the Azure portal to set up alerts on metrics for Azure Cosmos DB for PostgreSQL
APPLIES TO:
![]() Azure Cosmos DB for PostgreSQL (powered by the Citus database
extension to PostgreSQL)
Azure Cosmos DB for PostgreSQL (powered by the Citus database
extension to PostgreSQL)
This article shows you how to set up Azure Cosmos DB for PostgreSQL alerts by using the Azure portal. You can receive an alert based on monitoring metrics for your Azure services.
You'll set up an alert to trigger when the value of a specified metric crosses a threshold. The alert triggers when the condition is first met, and continues to trigger afterwards.
You can configure an alert to do the following actions when it triggers:
- Send email notifications to the service administrator and coadministrators.
- Send email to additional emails that you specify.
- Call a webhook.
You can configure and get information about alert rules using:
Create an alert rule on a metric from the Azure portal
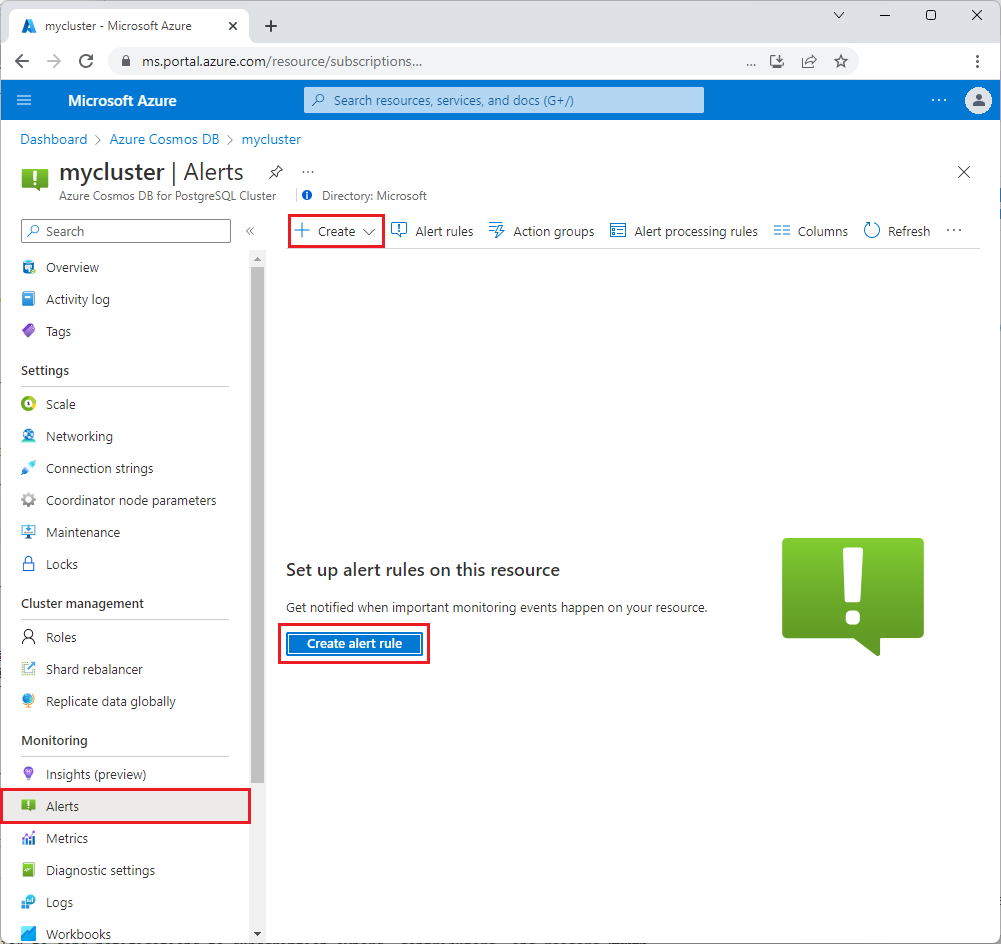
In the Azure portal, select the Azure Cosmos DB for PostgreSQL server you want to monitor.
Under the Monitoring section of the sidebar, select Alerts, and then select Create or Create alert rule.
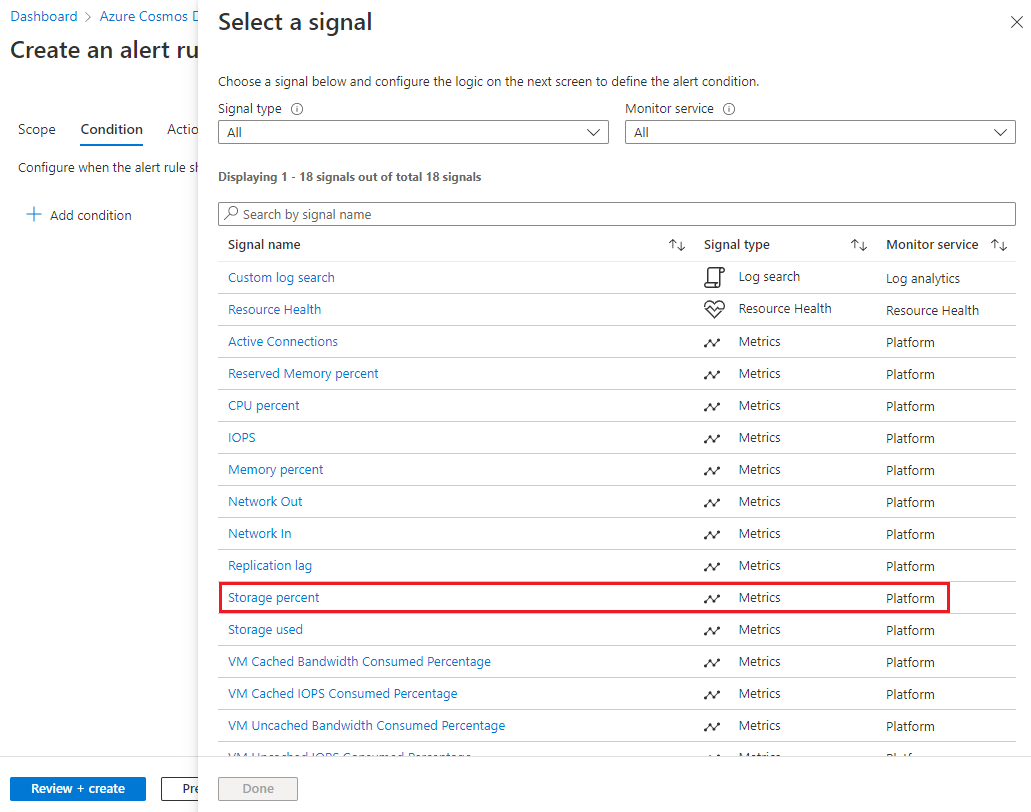
The Select a signal screen opens. Select a metric from the list of signals to be alerted on. For this example, select Storage percent.
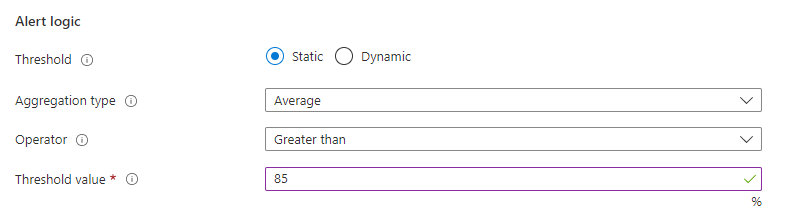
On the Condition tab of the Create an alert rule page, under Alert logic, complete the following items:
- For Threshold, select Static.
- For Aggregation type, select Average.
- For Operator, select Greater than.
- For Threshold value, enter 85.
Select the Actions tab, and then select Create action group to create a new group to receive notifications on the alert.
On the Create an action group form, select the Subscription, Resource group, and Region, and enter a name and display name for the group.
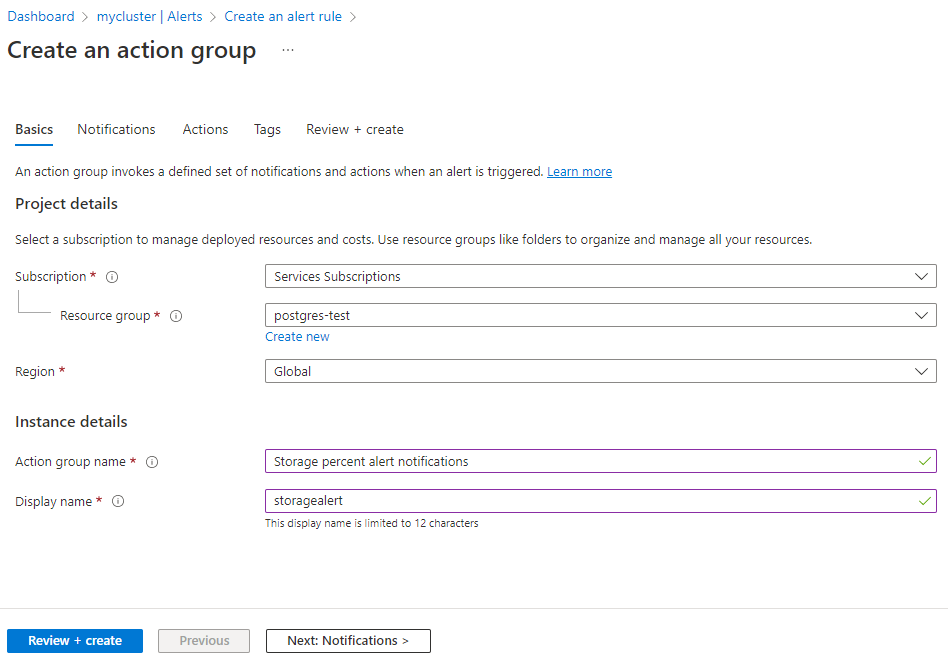
Select Next: Notifications at the bottom of the page.
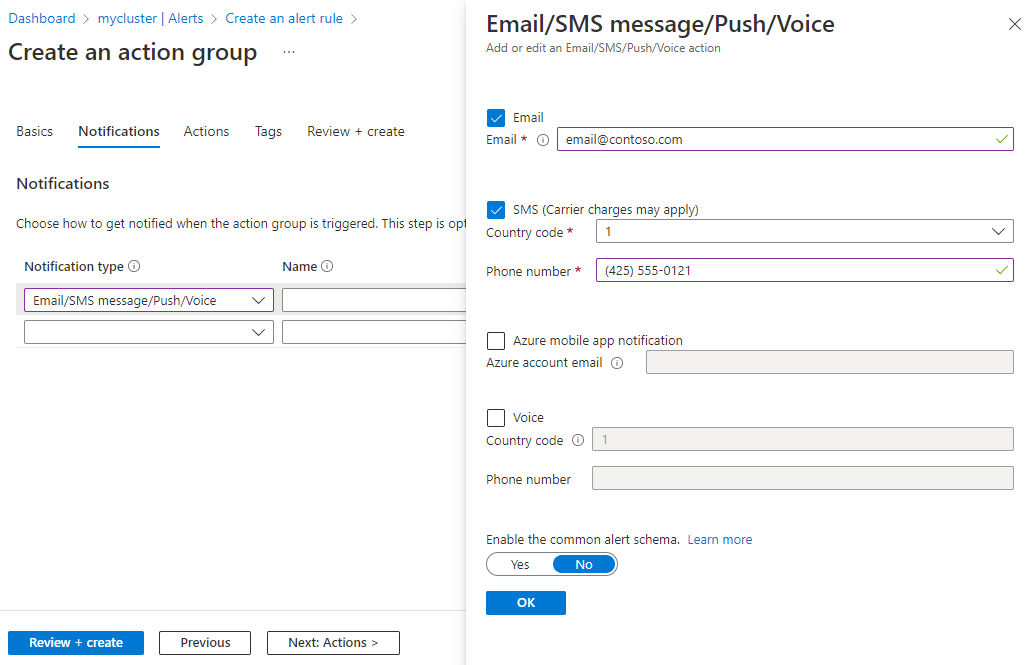
On the Notifications tab, under Notification type, select Email/SMS message/Push/Voice.
On the Email/SMS message/Push/Voice form, fill out email addresses and phone numbers for the notification types and recipients you want, and then select OK.
On the Create an action group form, enter a name for the new notification.
Select Review + create, and then select Create to create the action group. The new action group is created and appears under Action group name on the Actions tab of the Create an alert rule page.
Select Next: Details at the bottom of the page.
On the Details tab, select a severity for the rule. Give the rule an easily identifiable name, and add an optional description.
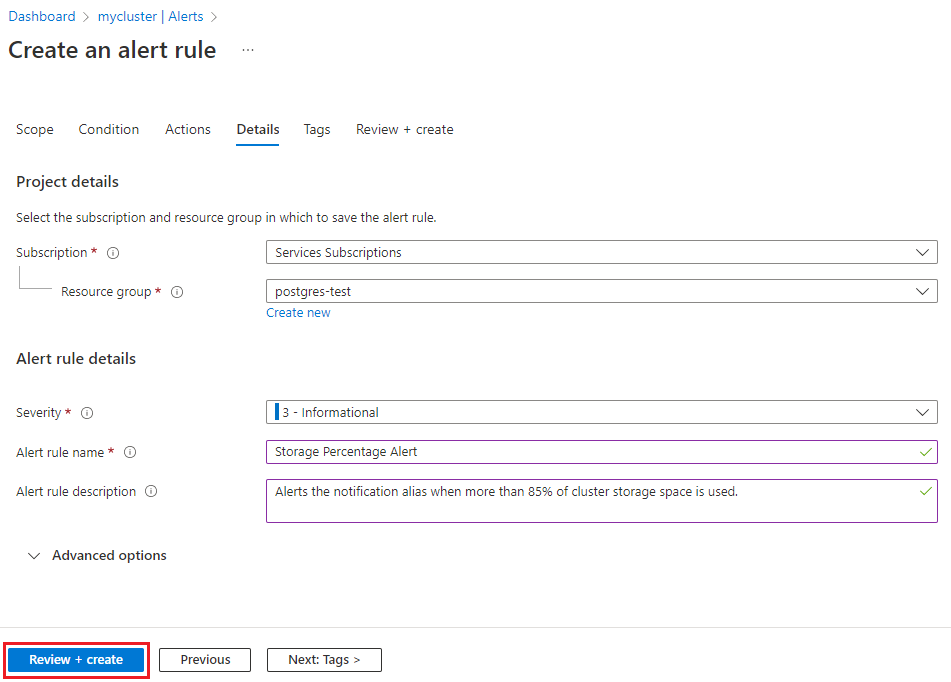
Select Review + create, and then select Create to create the alert. Within a few minutes, the alert is active and triggers as previously described.
Manage alerts
Once you've created an alert, you can select it and do the following actions:
- View a graph showing the metric threshold and the actual values from the previous day relevant to this alert.
- Edit or Delete the alert rule.
- Disable or Enable the alert, if you want to temporarily stop or resume receiving notifications.
Suggested alerts
Here are some examples of suggested alerts to set up.
Disk space
Monitoring and alerting is important for every production cluster. The underlying PostgreSQL database requires free disk space to operate correctly. If the disk becomes full, the database server node will go offline and refuse to start until space is available. At that point, it requires a Microsoft support request to fix the situation.
We recommend setting disk space alerts on every node in every cluster, even for non-production usage. Disk space usage alerts provide the advance warning needed to intervene and keep nodes healthy. For best results, try a series of alerts at 75%, 85%, and 95% usage. The percentages to choose depend on data ingestion speed, since fast data ingestion fills up the disk faster.
As the disk approaches its space limit, try these techniques to get more free space:
- Review data retention policy. Move older data to cold storage if feasible.
- Consider adding nodes to the cluster and rebalancing shards. Rebalancing distributes the data across more computers.
- Consider growing the capacity of worker nodes. Each worker can have up to 2 TiB of storage. However adding nodes should be attempted before resizing nodes because adding nodes completes faster.
CPU usage
Monitoring CPU usage is useful to establish a baseline for performance. For example, you may notice that CPU usage is usually around 40-60%. If CPU usage suddenly begins hovering around 95%, you can recognize an anomaly. The CPU usage may reflect organic growth, but it may also reveal a stray query. When creating a CPU alert, set a long aggregation granularity to catch prolonged increases and ignore momentary spikes.
Next steps
- Learn more about configuring webhooks in alerts.
- Get an overview of metrics collection to make sure your service is available and responsive.
Feedback
Coming soon: Throughout 2024 we will be phasing out GitHub Issues as the feedback mechanism for content and replacing it with a new feedback system. For more information see: https://aka.ms/ContentUserFeedback.
Submit and view feedback for