Accessing diagnostic logs for Azure Data Lake Analytics
Important
Azure Data Lake Analytics retired on 29 February 2024. Learn more with this announcement.
For data analytics, your organization can use Azure Synapse Analytics or Microsoft Fabric.
Diagnostic logging allows you to collect data access audit trails. These logs provide information such as:
- A list of users that accessed the data.
- How frequently the data is accessed.
- How much data is stored in the account.
Enable logging
Sign on to the Azure portal.
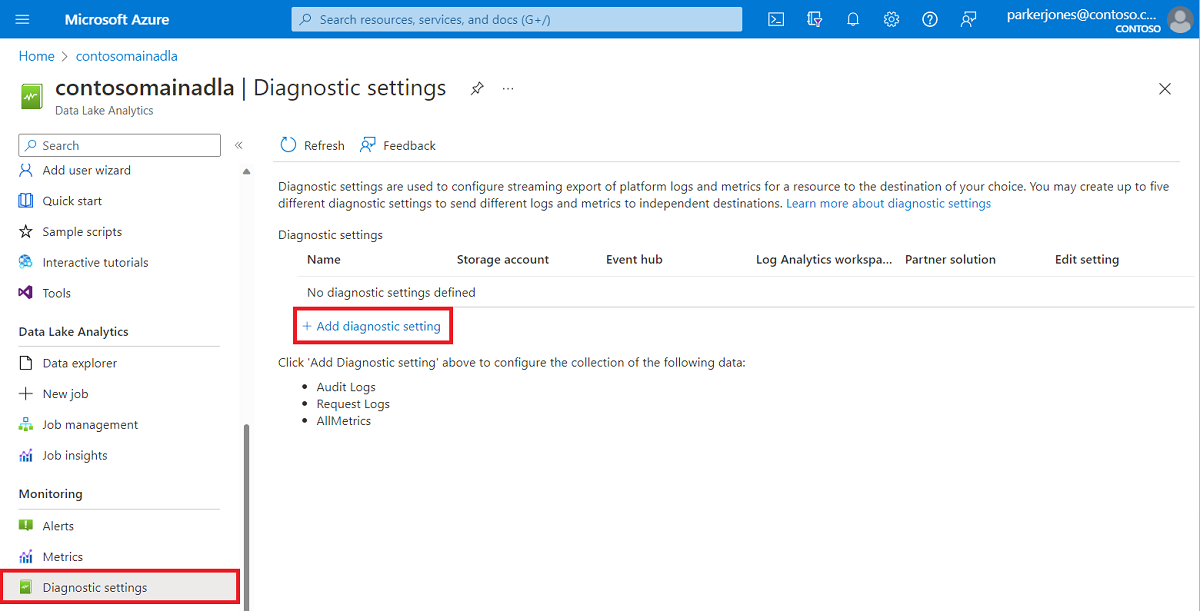
Open your Data Lake Analytics account and select Diagnostic settings from the Monitoring section. Next, select + Add diagnostic setting.
From Diagnostics setting, enter a name for this logging configuration and then select logging options.

You can choose to store/process the data in four different ways.
Select Archive to a storage account to store logs in an Azure storage account. Use this option if you want to archive the data. If you select this option, you must provide an Azure storage account to save the logs to.
Select Stream to an event hub to stream log data to an Azure Event Hubs. Use this option if you have a downstream processing pipeline that is analyzing incoming logs in real time. If you select this option, you must provide the details for the Azure Event Hubs you want to use.
Select Send to Log Analytics workspace to send the data to the Azure Monitor service. Use this option if you want to use Azure Monitor logs to gather and analyze logs.
Select send to partner solution if you want to use our partner integration. For more information, you can follow this link.
Specify whether you want to get audit logs or request logs or both. A request log captures every API request. An audit log records all operations that are triggered by that API request.
For Archive to a storage account, specify the number of days to retain the data.
Select Save.
Note
You must select either Archive to a storage account, Stream to an Event Hub, Send to Log Analytics workspace, or Send to partner solution before selecting the Save button.
Use the Azure Storage account that contains log data
To display the blob containers that hold logging data, open the Azure Storage account used for Data Lake Analytics for logging, and then select Containers.
- The container insights-logs-audit contains the audit logs.
- The container insights-logs-requests contains the request logs.
Within the containers, the logs are stored under the following file structure:
resourceId=/
  SUBSCRIPTIONS/
    <<SUBSCRIPTION_ID>>/
      RESOURCEGROUPS/
        <<RESOURCE_GRP_NAME>>/
          PROVIDERS/
            MICROSOFT.DATALAKEANALYTICS/
              ACCOUNTS/
                <DATA_LAKE_ANALYTICS_NAME>>/
                  y=####/
                    m=##/
                      d=##/
                        h=##/
                          m=00/
                            PT1H.json
Note
The
##entries in the path contain the year, month, day, and hour in which the log was created. Data Lake Analytics creates one file every hour, som=always contains a value of00.As an example, the complete path to an audit log could be:
https://adllogs.blob.core.windows.net/insights-logs-audit/resourceId=/SUBSCRIPTIONS/<sub-id>/RESOURCEGROUPS/myresourcegroup/PROVIDERS/MICROSOFT.DATALAKEANALYTICS/ACCOUNTS/mydatalakeanalytics/y=2016/m=07/d=18/h=04/m=00/PT1H.jsonSimilarly, the complete path to a request log could be:
https://adllogs.blob.core.windows.net/insights-logs-requests/resourceId=/SUBSCRIPTIONS/<sub-id>/RESOURCEGROUPS/myresourcegroup/PROVIDERS/MICROSOFT.DATALAKEANALYTICS/ACCOUNTS/mydatalakeanalytics/y=2016/m=07/d=18/h=14/m=00/PT1H.json
Process the log data
Azure Data Lake Analytics provides a sample on how to process and analyze the log data. You can find the sample at https://github.com/Azure/AzureDataLake/tree/master/Samples/AzureDiagnosticsSample.
Log structure
The audit and request logs are in a structured JSON format.
Request logs
Here's a sample entry in the JSON-formatted request log. Each blob has one root object called records that contains an array of log objects.
{
"records":
  [
    . . . .
    ,
    {
         "time": "2016-07-07T21:02:53.456Z",
         "resourceId": "/SUBSCRIPTIONS/<subscription_id>/RESOURCEGROUPS/<resource_group_name>/PROVIDERS/MICROSOFT.DATALAKEANALYTICS/ACCOUNTS/<data_lake_analytics_account_name>",
         "category": "Requests",
         "operationName": "GetAggregatedJobHistory",
         "resultType": "200",
         "callerIpAddress": "::ffff:1.1.1.1",
         "correlationId": "4a11c709-05f5-417c-a98d-6e81b3e29c58",
         "identity": "1808bd5f-62af-45f4-89d8-03c5e81bac30",
         "properties": {
             "HttpMethod":"POST",
             "Path":"/JobAggregatedHistory",
             "RequestContentLength":122,
             "ClientRequestId":"3b7adbd9-3519-4f28-a61c-bd89506163b8",
             "StartTime":"2016-07-07T21:02:52.472Z",
             "EndTime":"2016-07-07T21:02:53.456Z"
             }
    }
    ,
    . . . .
  ]
}
Request log schema
| Name | Type | Description |
|---|---|---|
| time | String | The timestamp (in UTC) of the log |
| resourceId | String | The identifier of the resource that operation took place on |
| category | String | The log category. For example, Requests. |
| operationName | String | Name of the operation that is logged. For example, GetAggregatedJobHistory. |
| resultType | String | The status of the operation, For example, 200. |
| callerIpAddress | String | The IP address of the client making the request |
| correlationId | String | The identifier of the log. This value can be used to group a set of related log entries. |
| identity | Object | The identity that generated the log |
| properties | JSON | See the next section (Request log properties schema) for details |
Request log properties schema
| Name | Type | Description |
|---|---|---|
| HttpMethod | String | The HTTP Method used for the operation. For example, GET. |
| Path | String | The path the operation was performed on |
| RequestContentLength | int | The content length of the HTTP request |
| ClientRequestId | String | The identifier that uniquely identifies this request |
| StartTime | String | The time when the server received the request |
| EndTime | String | The time when the server sent a response |
Audit logs
Here's a sample entry in the JSON-formatted audit log. Each blob has one root object called records that contains an array of log objects.
{
"records":
  [
    {
         "time": "2016-07-28T19:15:16.245Z",
         "resourceId": "/SUBSCRIPTIONS/<subscription_id>/RESOURCEGROUPS/<resource_group_name>/PROVIDERS/MICROSOFT.DATALAKEANALYTICS/ACCOUNTS/<data_lake_ANALYTICS_account_name>",
         "category": "Audit",
         "operationName": "JobSubmitted",
         "identity": "user@somewhere.com",
         "properties": {
             "JobId":"D74B928F-5194-4E6C-971F-C27026C290E6",
             "JobName": "New Job",
             "JobRuntimeName": "default",
             "SubmitTime": "7/28/2016 7:14:57 PM"
             }
    }
  ]
}
Audit log schema
| Name | Type | Description |
|---|---|---|
| time | String | The timestamp (in UTC) of the log |
| resourceId | String | The identifier of the resource that operation took place on |
| category | String | The log category. For example, Audit. |
| operationName | String | Name of the operation that is logged. For example, JobSubmitted. |
| resultType | String | A substatus for the job status (operationName). |
| resultSignature | String | Extra details on the job status (operationName). |
| identity | String | The user that requested the operation. For example, susan@contoso.com. |
| properties | JSON | See the next section (Audit log properties schema) for details |
Note
resultType and resultSignature provide information on the result of an operation, and only contain a value if an operation has completed. For example, they only contain a value when operationName contains a value of JobStarted or JobEnded.
Audit log properties schema
| Name | Type | Description |
|---|---|---|
| JobId | String | The ID assigned to the job |
| JobName | String | The name that was provided for the job |
| JobRunTime | String | The runtime used to process the job |
| SubmitTime | String | The time (in UTC) that the job was submitted |
| StartTime | String | The time the job started running after submission (in UTC) |
| EndTime | String | The time the job ended |
| Parallelism | String | The number of Data Lake Analytics units requested for this job during submission |
Note
SubmitTime, StartTime, EndTime, and Parallelism provide information on an operation. These entries only contain a value if that operation has started or completed. For example, SubmitTime only contains a value after operationName has the value JobSubmitted.