Connect OT network sensors to the on-premises management console (Legacy)
Important
Defender for IoT now recommends using Microsoft cloud services or existing IT infrastructure for central monitoring and sensor management, and plans to retire the on-premises management console on January 1st, 2025.
For more information, see Deploy hybrid or air-gapped OT sensor management.
This article is one in a series of articles describing the deployment path for a Microsoft Defender for IoT on-premises management console for air-gapped OT sensors.

After you've installed and configured your OT network sensors, you can connect them to your on-premises management console for central management and network monitoring.
Prerequisites
To perform the procedures in this article, make sure that you have:
An on-premises management console installed, activated, and configured
One or more OT sensors installed, configured, and activated. To assign your OT sensor to a site and zone, make sure that you have at least one site and zone configured.
Access to both your on-premises management console and OT sensors as an Admin user. For more information, see On-premises users and roles for OT monitoring with Defender for IoT.
To configure access to your OT sensors via proxy tunneling, make sure that you have access to the on-premises management console's CLI as a privileged user.
Connect OT sensors to the on-premises management console
To connect OT sensors to the on-premises management console, copy a connection string from the on-premises management console and paste it as needed in your OT sensor console.
On your on-premises management console:
Sign into your on-premises management console and select System Settings and scroll down to see the Sensor Setup - Connection String area. For example:
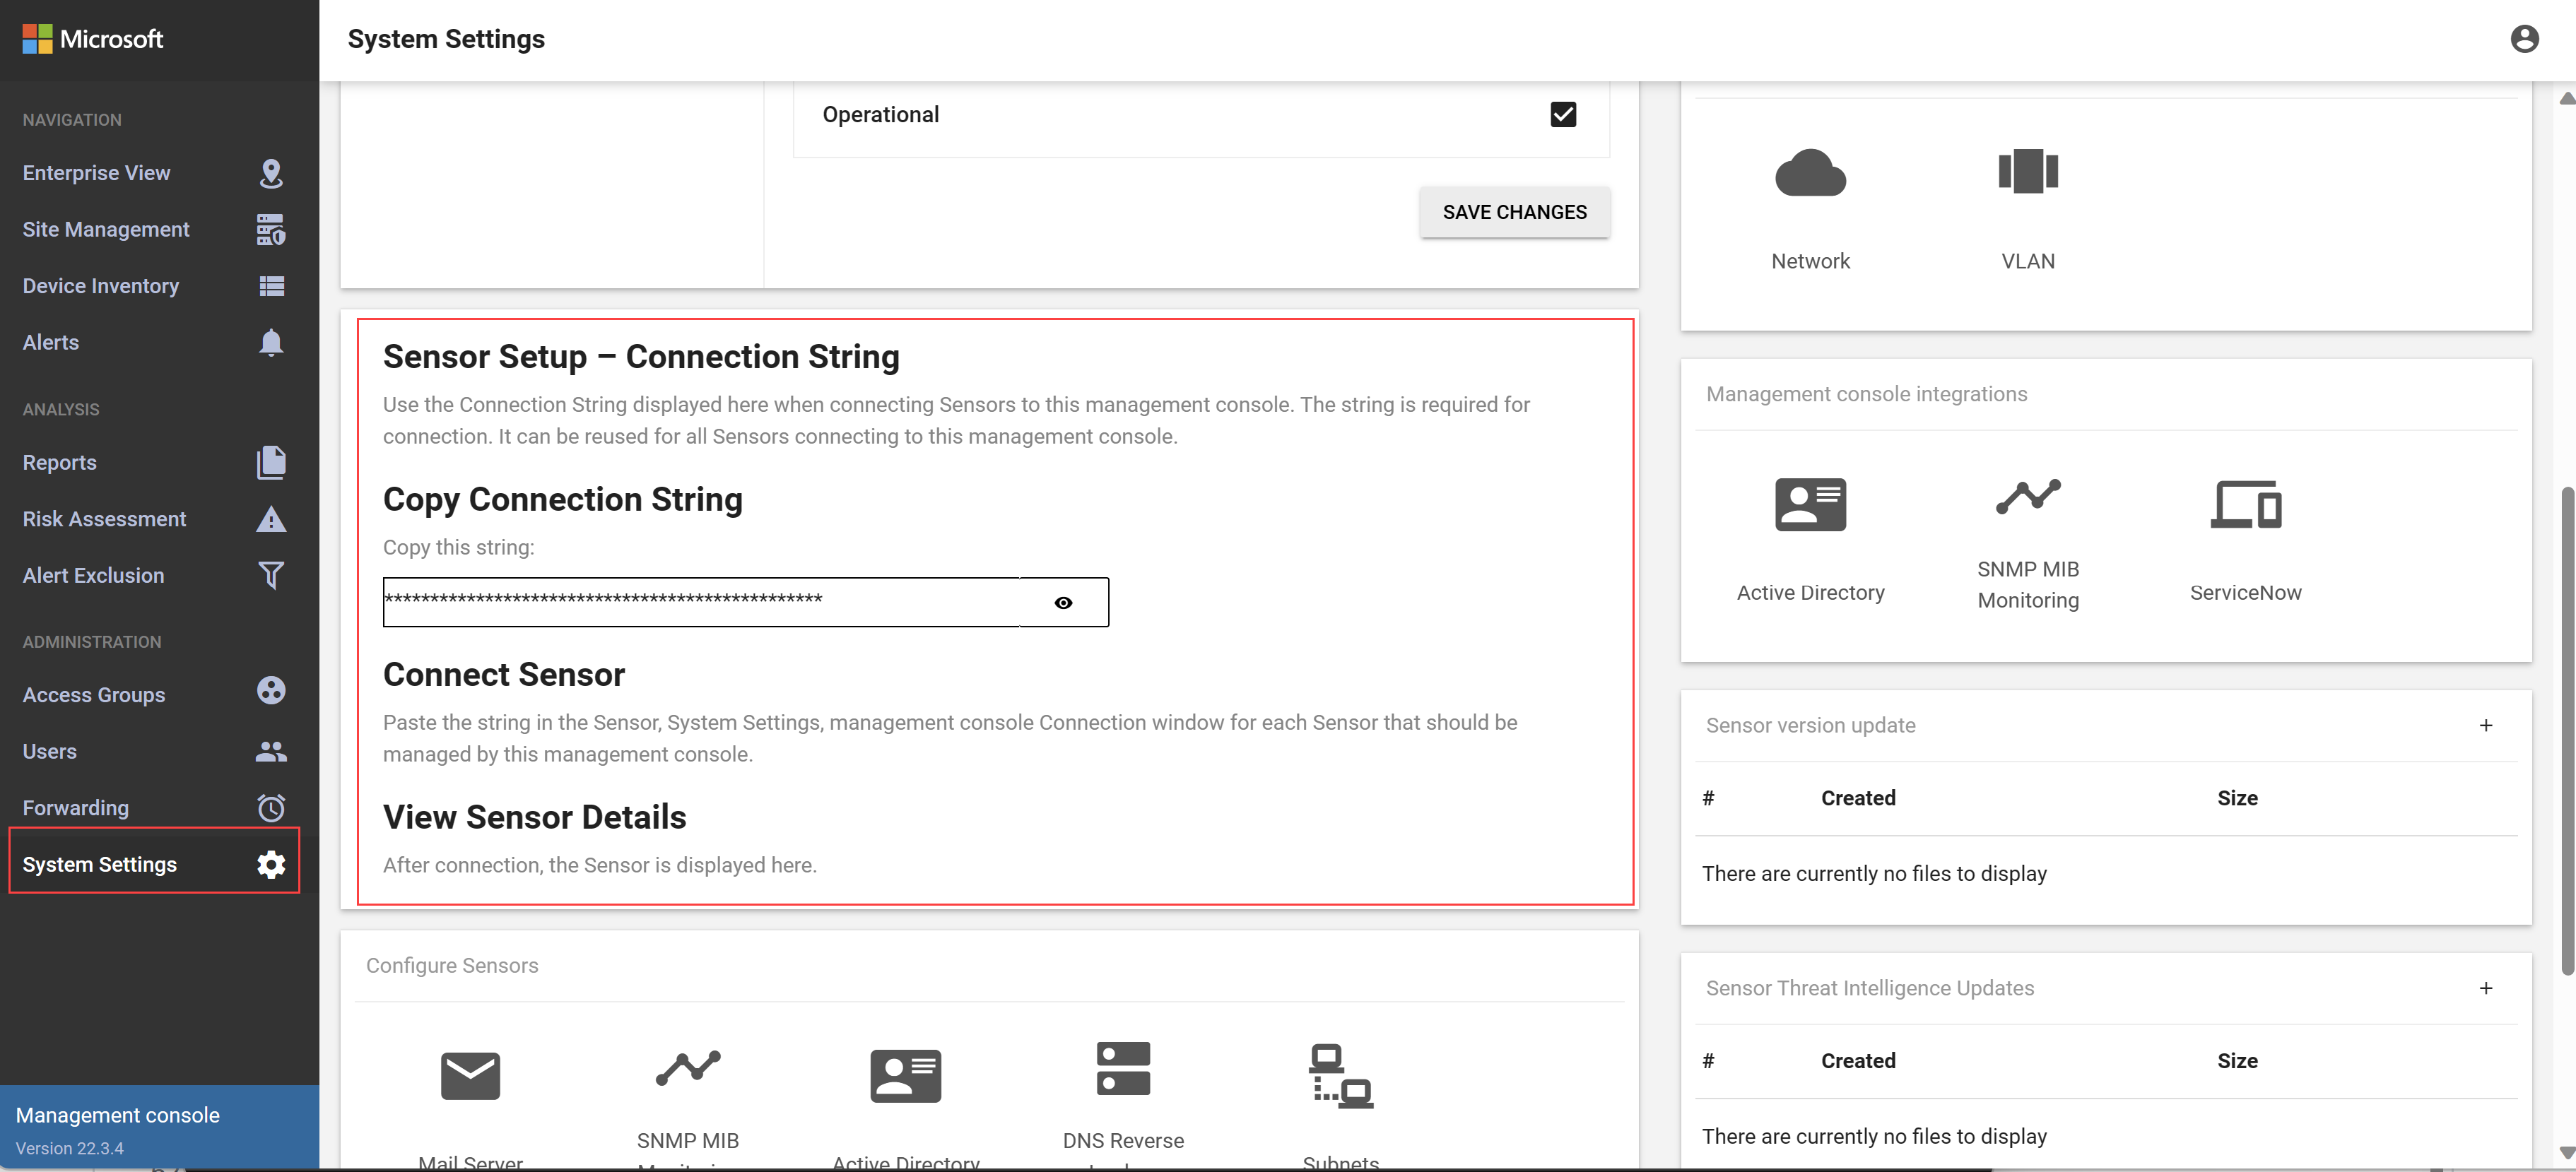
Copy the string in the Copy Connection String box to the clipboard.
On your OT sensor:
Sign into your OT sensor and select System settings > Basic > Sensor Setup > Connection to management console.
In the Connection String field, paste the connection string you'd copied from the on-premises management console, and select Connect.
After you've connected your OT sensors to your on-premises management console, you'll see those sensors listed on the on-premises management console's Site Management page as Unassigned sensors.
Tip
When you create sites and zones, assign each sensor to a zone to monitor detected data segmented separately.
Configure OT sensor access via tunneling
You might want to enhance your system security by preventing the on-premises management console to access OT sensors directly.
In such cases, configure proxy tunneling on your on-premises management console to allow users to connect to OT sensors via the on-premises management console. No configuration is needed on the sensor.
While the default port used to access OT sensors via proxy tunneling is 9000, modify this value to a different port as needed.
To configure OT sensor access via tunneling:
Sign into the on-premises management console's CLI via Telnet or SSH using a privileged user.
Run:
sudo cyberx-management-tunnel-enableAllow a few minutes for the connection to start.
When tunneling access is configured, the following URL syntax is used to access the sensor consoles: https://<on-premises management console address>/<sensor address>/<page URL>
To customize the port used with proxy tunneling:
Sign into the on-premises management console's CLI via Telnet or SSH using a privileged user.
Run:
sudo cyberx-management-tunnel-enable --port <port>Where
<port>is the value of the port you want to use for proxy tunneling.
To remove the proxy tunneling configuration:
Sign into the on-premises management console's CLI via Telnet or SSH using a privileged user.
Run:
cyberx-management-tunnel-disable
To access proxy tunneling log files:
Proxy tunneling log files are located in the following locations:
- On the on-premises management console: /var/log/apache2.log
- On the OT sensors: /var/cyberx/logs/tunnel.log
Next steps
Feedback
Coming soon: Throughout 2024 we will be phasing out GitHub Issues as the feedback mechanism for content and replacing it with a new feedback system. For more information see: https://aka.ms/ContentUserFeedback.
Submit and view feedback for