Improvements to Copy Dashboard
We are excited to announce some long awaited improvements to the Copy Dashboard preview. You can now copy a dashboard to a different team, the same team, or a different project - and team and query configuration is updated in the new dashboard. This further minimizes the work required to build similar dashboards from scratch for multiple teams.
Check out the following feature descriptions for details.
General
Azure Pipelines
- Automatic retries for a task
- Consume inputs from another task in a decorator
- Improvements to service connections usage history
- The default agent specification for Classic pipelines is now Windows-2019
Reporting
General
Assign Azure DevOps Administrator role to an Azure AD group
The Azure DevOps Administrator role, necessary to configure Azure AD tenant policies in Azure DevOps, can now be assigned to an Azure AD groups. Learn more about using Azure AD groups to manage role assignments in Azure AD.
Azure Pipelines
Automatic retries for a task
When you have a flaky task that fails intermittently in a pipeline, you may have to re-run the pipeline to have it succeed. In most cases, the best way to address a flaky task or script is by fixing the task or script itself. For instance, if your test task fails in a pipeline because of flaky tests, it is always a good idea to fix the flaky tests and make them more reliable. Similarly, if your script fails once in a while, it is better to fix the script, for instance by introducing retries within the script.
However, there are some cases, where you might want to retry the task. A common use case for this is a task that downloads a package (e.g., NuGet, npm, etc.). We have often observed that these tasks are susceptible to networking failures and to the transient failures on the package hosting servers. We heard your feedback that it would be better to automatically retry such failing tasks without having to restart the entire pipeline again.
Based on your feedback, we've added a feature to automatically retry a task in a pipeline when it fails. If you use YAML pipelines, then you can set this input as follows:
- task: <name of task>
   retryCountOnTaskFailure: <max number of retries>
   ...
When using classic build or release pipelines, you can set this property under the control options for the task.
Here are a few things to note when using retries:
- The failing task is retried immediately.
- There is no assumption about the idempotency of the task. If the task has side-effects (for instance, if it created an external resource partially), then it may fail the second time it is run.
- There is no information about the retry count made available to the task.
- A warning is added to the task logs indicating that it has failed before it is retried.
- All of the attempts to retry a task are shown in the UI as part of the same task node.
Note
Requires agent version 2.194.0 or later. Not supported for agentless tasks.
Consume inputs from another task in a decorator
We recently added a feature to inject a task automatically into a pipeline before another target task in that pipeline. We are now enhancing that feature by letting you customize that injected task using the input parameters of the target task. The syntax for writing a decorator to do this is as follows:
{
    "contributions": [
        {
            "id": <my-required-task>,
            "type": "ms.azure-pipelines.pipeline-decorator",
            "targets": [
                "ms.azure-pipelines-agent-job.pre-task-tasks",
                "ms.azure-pipelines-agent-job.post-task-tasks"
            ],
            "properties": {
                "template": "my-decorator.yml",
                "targettask": <target-task-id>,
                "targettaskinputs": ["<name of input>"]
            }
        }
    ],
    ...
}
This feature only works when you use pre-task-tasks or post-task-tasks as the target for injection and specify the targettask in the properties section of the contribution. You can then add an additional property called targettaskinputs and specify a list of input parameter names accepted by the target task. These inputs are now made available to the injected task.
A common use case that can be accomplished by such a scenario is as follows. Let's say you want to inject a task that will automatically log the name of the artifact being published by a build. The name of the artifact is an input to the PublishBuildArtifacts task. Your injected task can now get the same input parameter and use it for logging.
Improvements to service connections usage history
When a pipeline uses a service connection, that usage is logged in the connection's history. Administrators of the service connection can review the usage history by navigating to project settings and selecting the appropriate service connection. There were some issues with the usage history of service connections that have been fixed with this update. Fixes include the following:
- When a service connection is used in a deployment job (instead of a regular job), that usage was not being logged.
- If you used multiple service connections in multiple stages of a pipeline, all the service connections would show a record in their usage history even though some of the stages were skipped.
The default agent specification for Classic pipelines is now Windows-2019
In the last release notes, we announced a deprecation schedule for vs2017-win2016 hosted images. In preparation for that, we are now changing the default agent specification when creating new pipelines in Classic pipelines to windows-2019.

Reporting
Copy Dashboard improvements
We are excited to announce the phase 2 public preview of Copy Dashboard! Queries and configuration are now carried over with the copy operation. Thanks for your patience as it took a little longer than expected to work out some of the issues.
The preview is on by default with the Copy Dashboard Experience feature flag (under preview features).
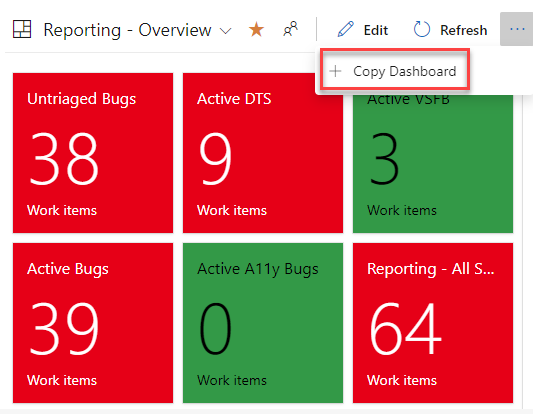
To copy a dashboard, first go to the dashboard you want to copy. Second, click the menu to bring up Copy Dashboard and then click on it.
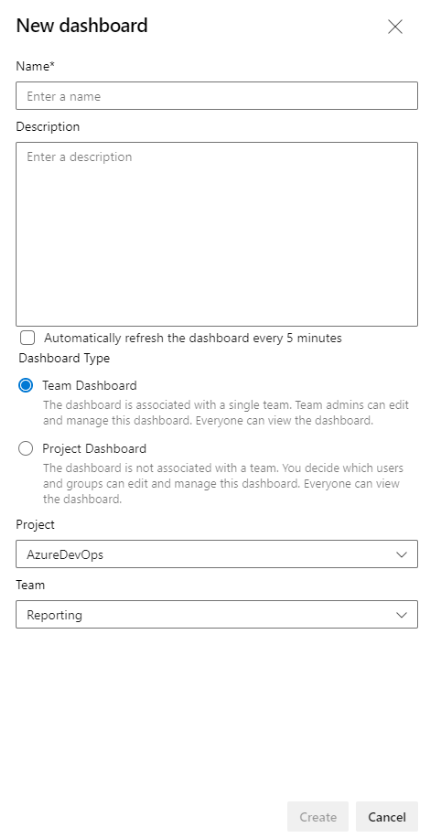
Next, provide the name and description of the new dashboard, and then select the dashboard type, Team or Project. When selecting a Team Dashboard, the new project and team are selected from the respective drop down boxes. For a Project dashboard, only the project is required.
You’ll be taken to the newly created dashboard after clicking the Create button. The widgets and layout remain the same.
Behind the scenes a folder with the name of the new dashboard is created in Shared Queries. All the queries for the new dashboard are copied to that folder. Query names remain the same. Widgets with a Team configuration are updated with the new team. Widgets with a Team configuration being copied from a Team dashboard to a Project Dashboard retain the original configuration.
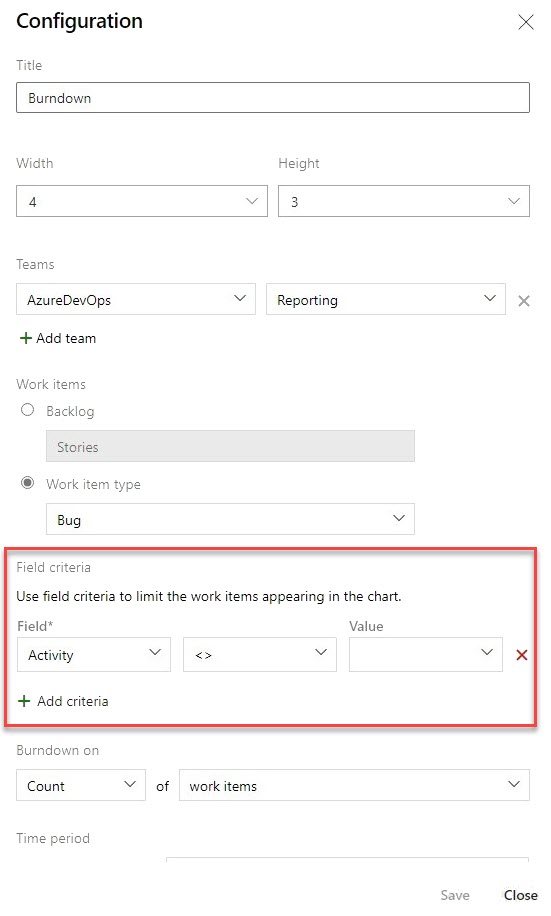
Filter on null values in burndown chart widget
You can now filter on a null value when using Field Criteria in the burndown chart widget. This behavior is now consistent with a query using the same field criteria.
Next steps
Note
These features will roll out over the next two to three weeks.
Head over to Azure DevOps and take a look.
How to provide feedback
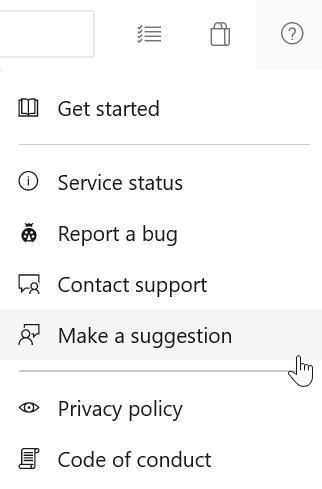
We would love to hear what you think about these features. Use the help menu to report a problem or provide a suggestion.
You can also get advice and your questions answered by the community on Stack Overflow.
Thanks,
Aaron Hallberg
Feedback
Coming soon: Throughout 2024 we will be phasing out GitHub Issues as the feedback mechanism for content and replacing it with a new feedback system. For more information see: https://aka.ms/ContentUserFeedback.
Submit and view feedback for