Monitoring Azure ExpressRoute
When you have critical applications and business processes relying on Azure resources, you want to monitor those resources for their availability, performance, and operation.
This article describes the monitoring data generated by Azure ExpressRoute. Azure ExpressRoute uses Azure Monitor. If you're unfamiliar with the features of Azure Monitor common to all Azure services that use it, read Monitoring Azure resources with Azure Monitor.
ExpressRoute insights
Some services in Azure have a special focused prebuilt monitoring dashboard in the Azure portal that provides a starting point for monitoring your service. These special dashboards are called insights.
ExpressRoute uses Network insights to provide a detailed topology mapping of all ExpressRoute components (peerings, connections, gateways) in relation with one another. Network insights for ExpressRoute also have preloaded metrics dashboard for availability, throughput, packet drops, and gateway metrics. For more information, see Azure ExpressRoute Insights using Networking Insights.
Monitoring data
Azure ExpressRoute collects the same kinds of monitoring data as other Azure resources that are described in Monitoring data from Azure resources.
See Monitoring Azure ExpressRoute data reference for detailed information on the metrics and logs metrics created by Azure ExpressRoute.
Collection and routing
Platform metrics and the Activity log are collected and stored automatically, but can be routed to other locations by using a diagnostic setting.
Resource Logs aren't collected and stored until you create a diagnostic setting and route them to one or more locations.
See Create diagnostic setting to collect platform logs and metrics in Azure for the detailed process for creating a diagnostic setting using the Azure portal, CLI, or PowerShell. When you create a diagnostic setting, you specify which categories of logs to collect. The categories for Azure ExpressRoute are listed in Azure ExpressRoute monitoring data reference.
Important
Enabling these settings requires additional Azure services (storage account, event hub, or Log Analytics), which may increase your cost. To calculate an estimated cost, visit the Azure pricing calculator.
The metrics and logs you can collect are discussed in the following sections.
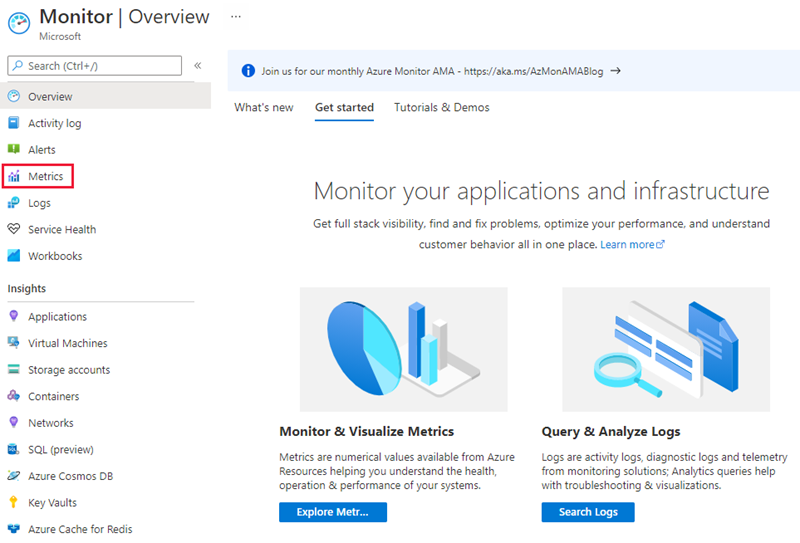
Analyzing metrics
You can analyze metrics for Azure ExpressRoute with metrics from other Azure services using metrics explorer by opening Metrics from the Azure Monitor menu. See Analyze metrics with Azure Monitor metrics explorer for details on using this tool.
For reference, you can see a list of all resource metrics supported in Azure Monitor.
- To view ExpressRoute metrics, filter by Resource Type ExpressRoute circuits.
- To view Global Reach metrics, filter by Resource Type ExpressRoute circuits and select an ExpressRoute circuit resource that has Global Reach enabled.
- To view ExpressRoute Direct metrics, filter Resource Type by ExpressRoute Ports.
Once a metric is selected, the default aggregation is applied. Optionally, you can apply splitting, which shows the metric with different dimensions.
Analyzing logs
Data in Azure Monitor Logs is stored in tables where each table has its own set of unique properties.
All resource logs in Azure Monitor have the same fields followed by service-specific fields. The common schema is outlined in Azure Monitor resource log schema. The schema for ExpressRoute resource logs is found in the Azure ExpressRoute Data Reference.
The Activity log is a platform logging that provides insight into subscription-level events. You can view it independently or route it to Azure Monitor Logs, where you can do much more complex queries using Log Analytics.
ExpressRoute stores data in the following tables.
| Table | Description |
|---|---|
| AzureDiagnostics | Common table used by multiple services to store Resource logs. Resource logs from ExpressRoute can be identified with MICROSOFT.NETWORK. |
| AzureMetrics | Metric data emitted by ExpressRoute that measure their health and performance. |
To view these tables, navigate to your ExpressRoute circuit resource and select Logs under Monitoring.
Note
Azure diagnostic logs, such as BGP route table log are updated every 24 hours.
Sample Kusto queries
Here are some queries that you can enter into the Log search bar to help you monitor your Azure ExpressRoute resources. These queries work with the new language.
To query for Border Gateway Protocol (BGP) route table learned over the last 12 hours.
AzureDiagnostics
| where TimeGenerated > ago(12h)
| where ResourceType == "EXPRESSROUTECIRCUITS"
| project TimeGenerated, ResourceType , network_s, path_s, OperationName
To query for BGP informational messages by level, resource type, and network.
AzureDiagnostics
| where Level == "Informational"
| where ResourceType == "EXPRESSROUTECIRCUITS"
| project TimeGenerated, ResourceId , Level, ResourceType , network_s, path_s
To query for Traffic graph BitInPerSeconds in the last one hour.
AzureMetrics
| where MetricName == "BitsInPerSecond"
| summarize by Average, bin(TimeGenerated, 1h), Resource
| render timechart
To query for Traffic graph BitOutPerSeconds in the last one hour.
AzureMetrics
| where MetricName == "BitsOutPerSecond"
| summarize by Average, bin(TimeGenerated, 1h), Resource
| render timechart
To query for graph of ArpAvailability in 5-minute intervals.
AzureMetrics
| where MetricName == "ArpAvailability"
| summarize by Average, bin(TimeGenerated, 5m), Resource
| render timechart
To query for graph of BGP availability in 5-minute intervals.
AzureMetrics
| where MetricName == "BGPAvailability"
| summarize by Average, bin(TimeGenerated, 5m), Resource
| render timechart
Alerts
Azure Monitor alerts proactively notify you when important conditions are found in your monitoring data. They allow you to identify and address issues in your system before your customers notice them. You can set alerts on metrics, logs, and the activity log. Different types of alerts have benefits and drawbacks.
The following table lists common and recommended alert rules for ExpressRoute.
| Alert type | Condition | Description |
|---|---|---|
| ARP availability down | Dimension name: Peering Type, Aggregation type: Avg, Operator: Less than, Threshold value: 100% | When ARP availability is down for a peering type. |
| BGP availability down | Dimension name: Peer, Aggregation type: Avg, Operator: Less than, Threshold value: 100% | When BGP availability is down for a peer. |
Note
During maintenance between the Microsoft edge and core network, BGP availability will appear down even if the BGP session between the customer edge and Microsoft edge remains up. For information about maintenance between the Microsoft edge and core network, make sure to have your maintenance alerts turned on and configured.
Alerts for ExpressRoute gateway connections
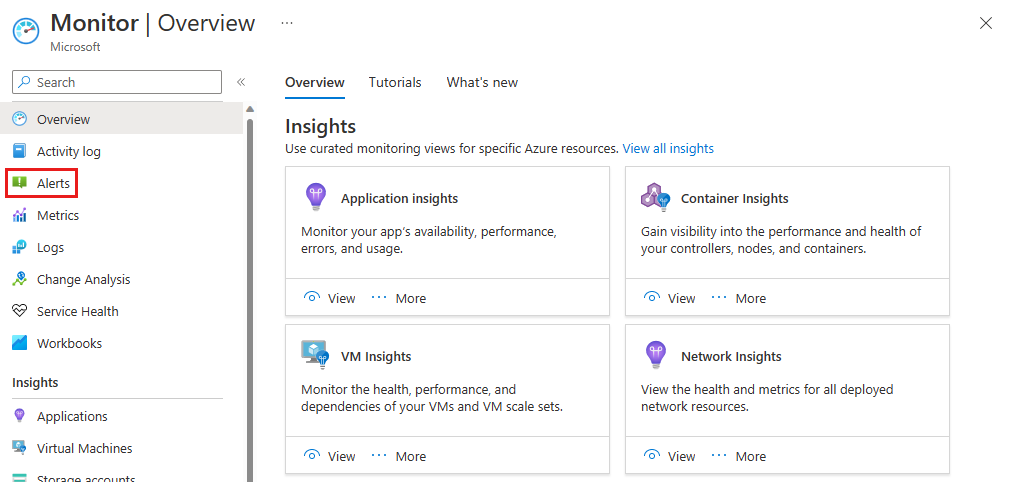
To configure alerts, navigate to Azure Monitor, then select Alerts.
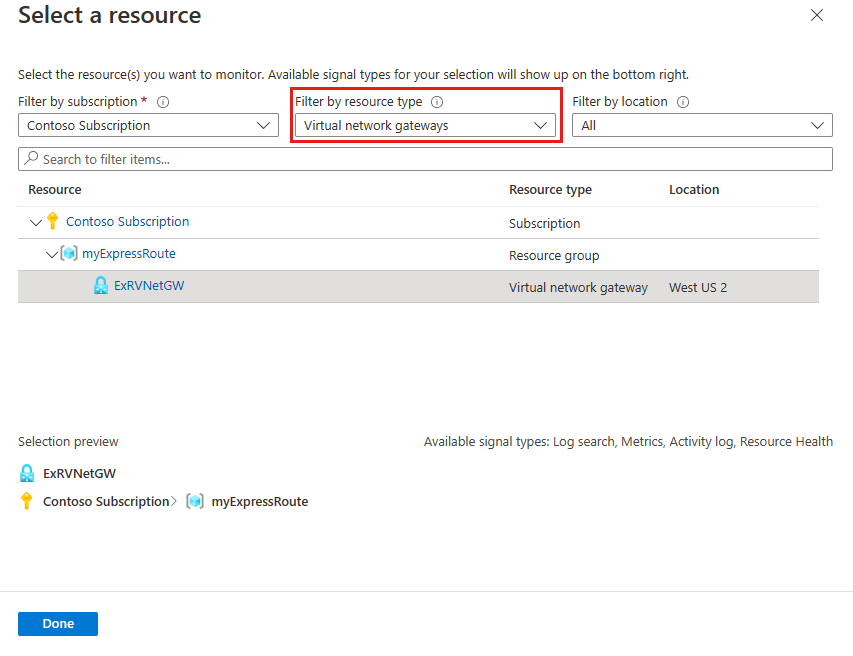
Select + Create > Alert rule and select the ExpressRoute gateway connection resource. Select Next: Condition > to configure the signal.
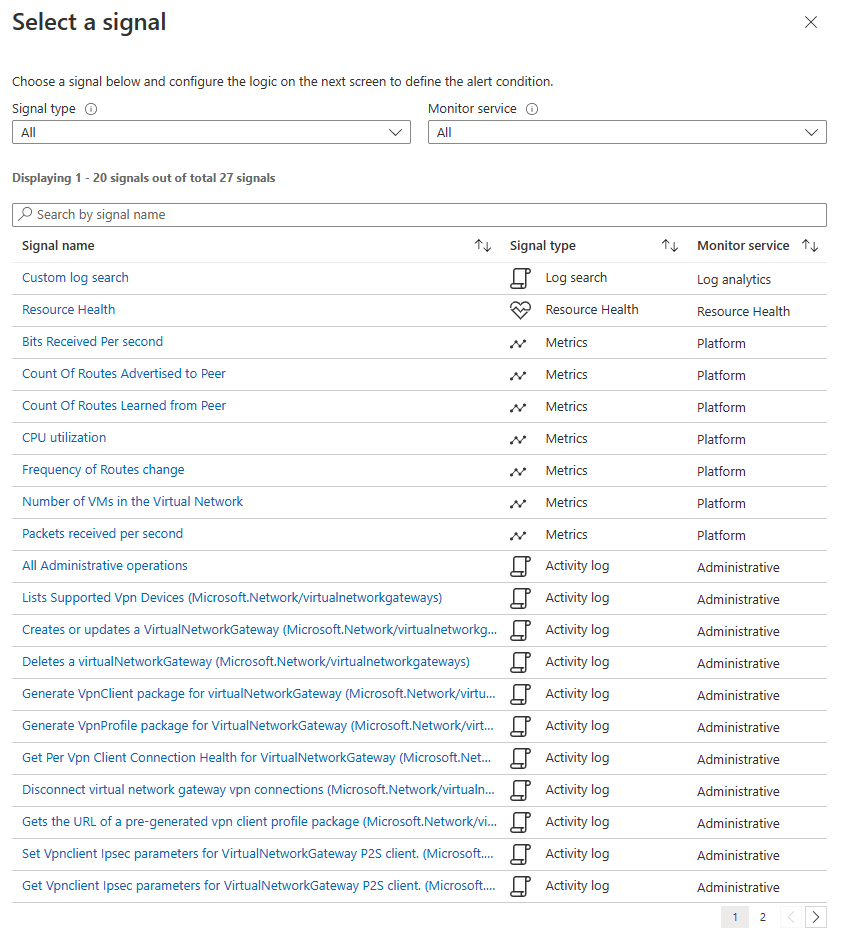
On the Select a signal page, select a metric, resource health, or activity log that you want to be alerted. Depending on the signal you select, you might need to enter additional information such as a threshold value. You can also combine multiple signals into a single alert. Select Next: Actions > to define who and how they get notify.
Select + Select action groups to choose an existing action group you previously created or select + Create action group to define a new one. In the action group, you determine how notifications get sent and who receives them.
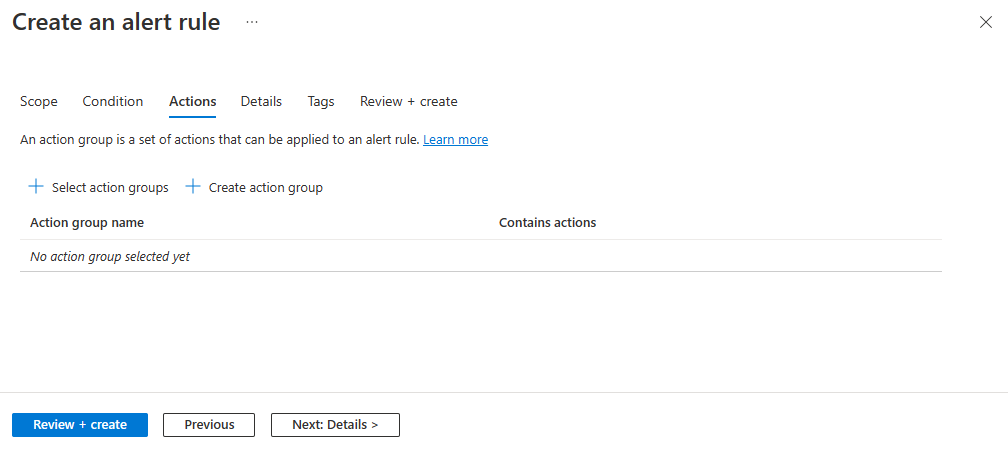
Select Review + create and then Create to deploy the alert into your subscription.
Next steps
- See Monitoring ExpressRoute data reference for a reference of the metrics, logs, and other important values created by ExpressRoute.
- See Monitoring Azure resources with Azure Monitor for details on monitoring Azure resources.
Feedback
Coming soon: Throughout 2024 we will be phasing out GitHub Issues as the feedback mechanism for content and replacing it with a new feedback system. For more information see: https://aka.ms/ContentUserFeedback.
Submit and view feedback for