Monitoring Azure IoT Hub
When you have critical applications and business processes relying on Azure resources, you want to monitor those resources for their availability, performance, and operation. This article describes the monitoring data generated by Azure IoT Hub and how you can use the features of Azure Monitor to analyze and alert on this data.
Monitor overview
The Overview page in the Azure portal for each IoT hub includes charts that provide some usage metrics, such as the number of messages used and the number of devices connected to the IoT hub.
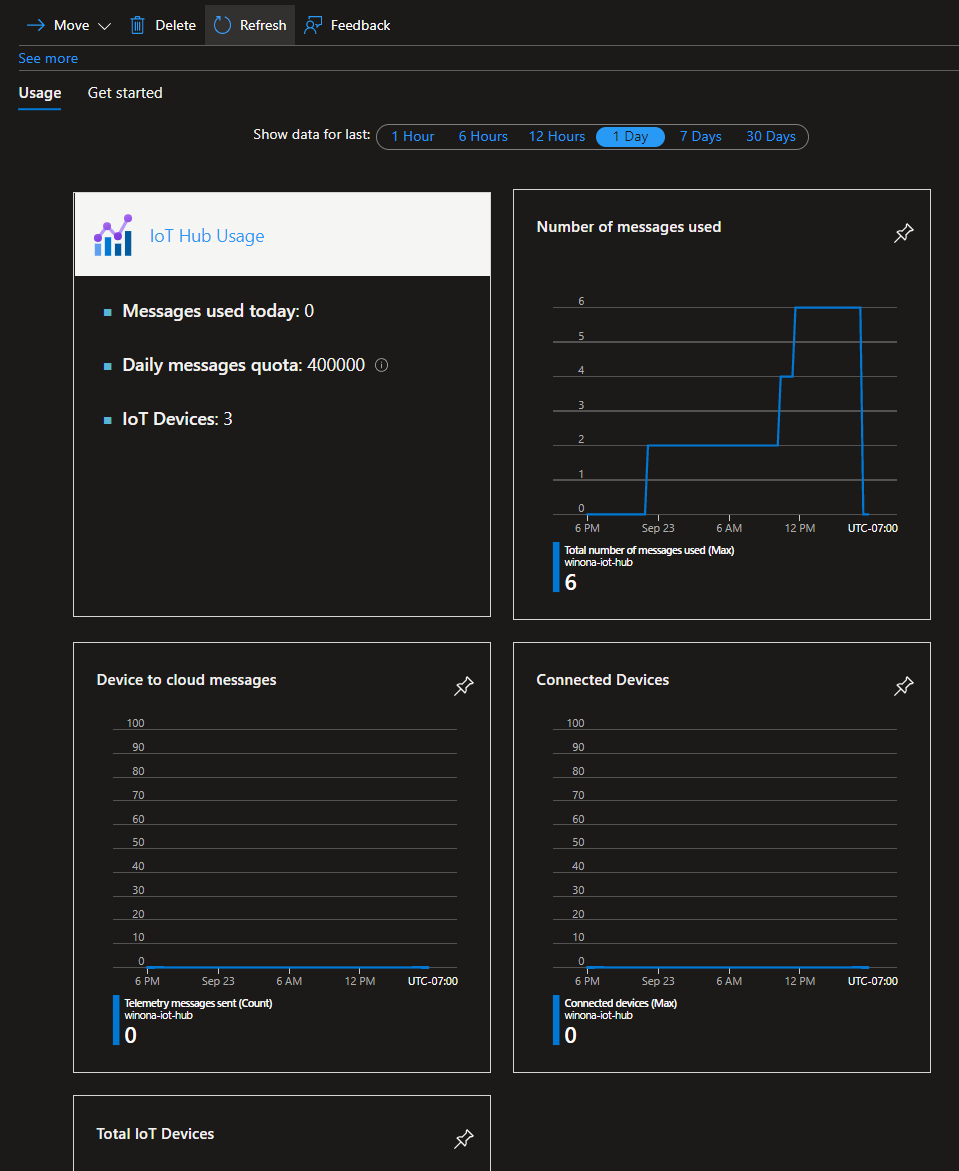
A correct message count value might be delayed by 1 minute. Due to the IoT Hub service infrastructure, the value can sometimes bounce between higher and lower values on refresh. This counter should be incorrect only for values accrued over the last minute.
The information presented on the Overview pane is useful, but represents only a small amount of monitoring data that's available for an IoT hub. Some monitoring data is collected automatically and available for analysis as soon as you create your IoT hub. You can enable other types of data collection with some configuration.
What is Azure Monitor?
Azure IoT Hub monitors data using Azure Monitor, a full stack monitoring service. Azure Monitor can monitor your Azure resources and other cloud or on-premises resources.
Start with the article Monitoring Azure resources with Azure Monitor, which describes the following concepts:
- What is Azure Monitor?
- Monitoring data collected in Azure
- Configuring data collection
- Metrics and logs
- Standard tools in Azure for analysis and insights
- Alerts fired when monitoring data
For more information on the metrics and logs created by Azure IoT Hub, see Monitoring Azure IoT Hub data reference.
Important
The events emitted by the IoT Hub service using Azure Monitor resource logs aren't guaranteed to be reliable or ordered. Some events might be lost or delivered out of order. Resource logs aren't intended to be real-time, so it may take several minutes for events to be logged to your choice of destination.
The rest of this article builds on the Monitoring Azure resources with Azure Monitor article by describing the specific data gathered for Azure IoT Hub. You'll see examples for configuring your data collection and how to analyze this data with Azure tools.
Collection and routing
Platform metrics, the Activity log, and resource logs have unique collection, storage, and routing specifications.
Platform metrics and the Activity log are collected and stored automatically, but can be routed to other locations by using a diagnostic setting.
Resource logs aren't collected and stored until you create a diagnostic setting and route them to one or more locations.
Metrics and logs can be routed to several locations including:
- The Azure Monitor Logs store via an associated Log Analytics workspace. There they can be analyzed using Log Analytics.
- Azure Storage for archiving and offline analysis
- An Event Hubs endpoint where they can be read by external applications, for example, third-party security information and event management (SIEM) tools.
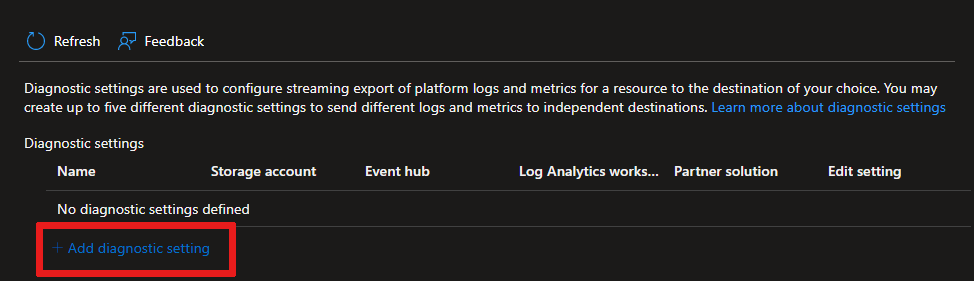
In the Azure portal from your IoT hub under Monitoring, you can select Diagnostic settings followed by Add diagnostic setting to create diagnostic settings scoped to the logs and platform metrics emitted by your IoT hub.
The following screenshot shows a diagnostic setting for routing the resource log type Connection Operations and all platform metrics to a Log Analytics workspace.

For more information on creating a diagnostic setting using the Azure portal, CLI, or PowerShell, see Create diagnostic setting to collect platform logs and metrics in Azure. When you create a diagnostic setting, you specify which categories of logs to collect. The categories for Azure IoT Hub are listed under Resource logs in the Monitoring Azure IoT Hub data reference. Events are emitted only for errors in some categories.
When routing IoT Hub platform metrics to other locations:
These platform metrics aren't exportable via diagnostic settings: Connected devices and Total devices.
Multi-dimensional metrics, for example some routing metrics, are currently exported as flattened single dimensional metrics aggregated across dimension values. For more information, see Exporting platform metrics to other locations.
Analyzing metrics
You can analyze metrics for Azure IoT Hub with metrics from other Azure services using metrics explorer. For more information on this tool, see Analyze metrics with Azure Monitor metrics explorer.
To open metrics explorer, go to the Azure portal and open your IoT hub, then select Metrics under Monitoring. This explorer is scoped, by default, to the platform metrics emitted by your IoT hub.

For a list of the platform metrics collected for Azure IoT Hub, see Metrics in the Monitoring Azure IoT Hub data reference. For a list of the platform metrics collected for all Azure services, see Supported metrics with Azure Monitor.
For IoT Hub platform metrics that are collected in units of count, some aggregations may not be available or usable. To learn more, see Supported aggregations in the Monitoring Azure IoT Hub data reference.
Some IoT Hub metrics, like routing metrics, are multi-dimensional. For these metrics, you can apply filters and splitting to your charts based on a dimension.
Analyzing logs
Data in Azure Monitor Logs is stored in tables where each table has its own set of unique properties. The data in these tables are associated with a Log Analytics workspace and can be queried in Log Analytics. To learn more about Azure Monitor Logs, see Azure Monitor Logs overview in the Azure Monitor documentation.
To route data to Azure Monitor Logs, you must create a diagnostic setting to send resource logs or platform metrics to a Log Analytics workspace. To learn more, see Collection and routing.
To perform Log Analytics, go to the Azure portal and open your IoT hub, then select Logs under Monitoring. These Log Analytics queries are scoped, by default, to the logs and metrics collected in Azure Monitor Logs for your IoT hub.

For a list of the tables used by Azure Monitor Logs and queryable by Log Analytics, see Azure Monitor Logs tables in the Monitoring Azure IoT Hub data reference.
All resource logs in Azure Monitor have the same fields followed by service-specific fields. The common schema is outlined in Azure Monitor resource log schema. You can find the schema and categories of resource logs collected for Azure IoT Hub in Resource logs in the Monitoring Azure IoT Hub data reference. Events are emitted only for errors in some categories.
The Activity log is a platform login Azure that provides insight into subscription-level events. You can view it independently or route it to Azure Monitor Logs, where you can do more complex queries using Log Analytics.
When routing IoT Hub platform metrics to Azure Monitor Logs:
The following platform metrics aren't exportable via diagnostic settings: Connected devices and Total devices.
Multi-dimensional metrics, for example some routing metrics, are currently exported as flattened single dimensional metrics aggregated across dimension values. For more detail, see Exporting platform metrics to other locations.
For common queries with IoT Hub, see Sample Kusto queries. For more information on using Log Analytics queries, see Overview of log queries in Azure Monitor.
SDK version in IoT Hub logs
Some operations in IoT Hub resource logs return an sdkVersion property in their properties object. For these operations, when a device or backend app is using one of the Azure IoT SDKs, this property contains information about the SDK being used, the SDK version, and the platform on which the SDK is running.
The following examples show the sdkVersion property emitted for a deviceConnect operation using:
- The Node.js device SDK:
"azure-iot-device/1.17.1 (node v10.16.0; Windows_NT 10.0.18363; x64)" - The .NET (C#) SDK:
".NET/1.21.2 (.NET Framework 4.8.4200.0; Microsoft Windows 10.0.17763 WindowsProduct:0x00000004; X86)".
The following table shows the SDK name used for different Azure IoT SDKs:
| SDK name in sdkVersion property | Language |
|---|---|
| .NET | .NET (C#) |
| microsoft.azure.devices | .NET (C#) service SDK |
| microsoft.azure.devices.client | .NET (C#) device SDK |
| iothubclient | C or Python v1 (deprecated) device SDK |
| iothubserviceclient | C or Python v1 (deprecated) service SDK |
| azure-iot-device-iothub-py | Python device SDK |
| azure-iot-device | Node.js device SDK |
| azure-iothub | Node.js service SDK |
| com.microsoft.azure.iothub-java-client | Java device SDK |
| com.microsoft.azure.iothub.service.sdk | Java service SDK |
| com.microsoft.azure.sdk.iot.iot-device-client | Java device SDK |
| com.microsoft.azure.sdk.iot.iot-service-client | Java service SDK |
| C | Embedded C |
| C + (OSSimplified = Eclipse ThreadX) | Eclipse ThreadX |
You can extract the SDK version property when you perform queries against IoT Hub resource logs. For example, the following query extracts the SDK version property (and device ID) from the properties returned by Connections operations. These two properties are written to the results along with the time of the operation and the resource ID of the IoT hub that the device is connecting to.
// SDK version of devices
// List of devices and their SDK versions that connect to IoT Hub
AzureDiagnostics
| where ResourceProvider == "MICROSOFT.DEVICES" and ResourceType == "IOTHUBS"
| where Category == "Connections"
| extend parsed_json = parse_json(properties_s)
| extend SDKVersion = tostring(parsed_json.sdkVersion) , DeviceId = tostring(parsed_json.deviceId)
| distinct DeviceId, SDKVersion, TimeGenerated, _ResourceId
Sample Kusto queries
Use the following Kusto queries to help you monitor your IoT hub.
Important
Selecting Logs from the IoT Hub menu opens Log Analytics and includes data solely from your IoT hub resource. For queries that include data from other IoT hubs or Azure services, select Logs from the Azure Monitor menu. For more information, see Log query scope and time range in Azure Monitor Log Analytics.
Connectivity Errors: Identify device connection errors.
AzureDiagnostics
| where ResourceProvider == "MICROSOFT.DEVICES" and ResourceType == "IOTHUBS"
| where Category == "Connections" and Level == "Error"
Throttling Errors: Identify devices that made the most requests resulting in throttling errors.
AzureDiagnostics
| where ResourceProvider == "MICROSOFT.DEVICES" and ResourceType == "IOTHUBS"
| where ResultType == "429001"
| extend DeviceId = tostring(parse_json(properties_s).deviceId)
| summarize count() by DeviceId, Category, _ResourceId
| order by count_ desc
Dead Endpoints: Identify dead or unhealthy endpoints by the number of times the issue was reported and know the reason why.
AzureDiagnostics
| where ResourceProvider == "MICROSOFT.DEVICES" and ResourceType == "IOTHUBS"
| where Category == "Routes" and OperationName in ("endpointDead", "endpointUnhealthy")
| extend parsed_json = parse_json(properties_s)
| extend Endpoint = tostring(parsed_json.endpointName), Reason = tostring(parsed_json.details)
| summarize count() by Endpoint, OperationName, Reason, _ResourceId
| order by count_ desc
Error summary: Count of errors across all operations by type.
AzureDiagnostics
| where ResourceProvider == "MICROSOFT.DEVICES" and ResourceType == "IOTHUBS"
| where Level == "Error"
| summarize count() by ResultType, ResultDescription, Category, _ResourceId
Recently connected devices: List of devices that IoT Hub saw connect in the specified time period.
AzureDiagnostics
| where ResourceProvider == "MICROSOFT.DEVICES" and ResourceType == "IOTHUBS"
| where Category == "Connections" and OperationName == "deviceConnect"
| extend DeviceId = tostring(parse_json(properties_s).deviceId)
| summarize max(TimeGenerated) by DeviceId, _ResourceId
Connection events for a specific device: All connection events logged for a specific device (test-device).
AzureDiagnostics
| where ResourceProvider == "MICROSOFT.DEVICES" and ResourceType == "IOTHUBS"
| where Category == "Connections"
| extend DeviceId = tostring(parse_json(properties_s).deviceId)
| where DeviceId == "test-device"
SDK version of devices: List of devices and their SDK versions for device connections or device to cloud twin operations.
AzureDiagnostics
| where ResourceProvider == "MICROSOFT.DEVICES" and ResourceType == "IOTHUBS"
| where Category == "Connections" or Category == "D2CTwinOperations"
| extend parsed_json = parse_json(properties_s)
| extend SDKVersion = tostring(parsed_json.sdkVersion) , DeviceId = tostring(parsed_json.deviceId)
| distinct DeviceId, SDKVersion, TimeGenerated, _ResourceId
Read logs from Azure Event Hubs
After you set up event logging through diagnostics settings, you can create applications that read out the logs so that you can take action based on the information in them. The following sample code retrieves logs from an event hub.
class Program
{
    static string connectionString = "{your AMS eventhub endpoint connection string}";
    static string monitoringEndpointName = "{your AMS event hub endpoint name}";
    static EventHubClient eventHubClient;
    //This is the Diagnostic Settings schema
    class AzureMonitorDiagnosticLog
    {
        string time { get; set; }
        string resourceId { get; set; }
        string operationName { get; set; }
        string category { get; set; }
        string level { get; set; }
        string resultType { get; set; }
        string resultDescription { get; set; }
        string durationMs { get; set; }
        string callerIpAddress { get; set; }
        string correlationId { get; set; }
        string identity { get; set; }
        string location { get; set; }
        Dictionary<string, string> properties { get; set; }
    };

    static void Main(string[] args)
    {
        Console.WriteLine("Monitoring. Press Enter key to exit.\n");
        eventHubClient = EventHubClient.CreateFromConnectionString(connectionString, monitoringEndpointName);
        var d2cPartitions = eventHubClient.GetRuntimeInformationAsync().PartitionIds;
        CancellationTokenSource cts = new CancellationTokenSource();
        var tasks = new List<Task>();
        foreach (string partition in d2cPartitions)
        {
            tasks.Add(ReceiveMessagesFromDeviceAsync(partition, cts.Token));
        }
        Console.ReadLine();
        Console.WriteLine("Exiting...");
        cts.Cancel();
        Task.WaitAll(tasks.ToArray());
    }

    private static async Task ReceiveMessagesFromDeviceAsync(string partition, CancellationToken ct)
    {
        var eventHubReceiver = eventHubClient.GetDefaultConsumerGroup().CreateReceiver(partition, DateTime.UtcNow);
        while (true)
        {
            if (ct.IsCancellationRequested)
            {
                await eventHubReceiver.CloseAsync();
                break;
            }
            EventData eventData = await eventHubReceiver.ReceiveAsync(new TimeSpan(0,0,10));
            if (eventData != null)
            {
                string data = Encoding.UTF8.GetString(eventData.GetBytes());
                Console.WriteLine("Message received. Partition: {0} Data: '{1}'", partition, data);
                var deserializer = new JavaScriptSerializer();
                //deserialize json data to azure monitor object
                AzureMonitorDiagnosticLog message = new JavaScriptSerializer().Deserialize<AzureMonitorDiagnosticLog>(result);
            }
        }
    }
}
Alerts
Azure Monitor alerts proactively notify you when important conditions are found in your monitoring data. They allow you to identify and address issues in your system before your customers notice them. You can set alerts on metrics, logs, and the activity log. Different types of alerts have benefits and drawbacks.
When you create an alert rule based on platform metrics (collected in units of count), some aggregations may not be available or usable. For more information, see Supported aggregations in Monitoring Azure IoT Hub data reference.
Monitor per-device disconnects with Event Grid
Azure Monitor provides a metric, Connected devices, that you can use to monitor the number of devices connected to your IoT Hub. This metric triggers an alert when the number of connected devices drops below a threshold value. Azure Monitor also emits events in the connections category that you can use to monitor device connects, disconnects, and connection errors. While these events may be sufficient for some scenarios, Azure Event Grid provides a low-latency, per-device monitoring solution that you can use to track device connections for critical devices and infrastructure.
With Event Grid, you can subscribe to the IoT Hub DeviceConnected and DeviceDisconnected events to trigger alerts and monitor device connection state. Event Grid provides a much lower event latency than Azure Monitor, so you can monitor on a per-device basis rather than for all connected devices. These factors make Event Grid the preferred method for monitoring connections for critical devices and infrastructure. We highly recommend using Event Grid to monitor device connections in production environments.
For more information about monitoring device connectivity with Event Grid and Azure Monitor, see Monitor, diagnose, and troubleshoot device connectivity to Azure IoT Hub.
Next steps
Monitoring Azure IoT Hub data reference: a reference of the metrics, logs, and other important values created by IoT Hub.
Monitoring Azure resources with Azure Monitor: monitoring Azure resources.
Monitor, diagnose, and troubleshoot device connectivity to Azure IoT Hub: monitoring device connectivity.
Feedback
Coming soon: Throughout 2024 we will be phasing out GitHub Issues as the feedback mechanism for content and replacing it with a new feedback system. For more information see: https://aka.ms/ContentUserFeedback.
Submit and view feedback for