Enable and view enhanced telemetry in Application Insights for Standard workflows in Azure Logic Apps
Applies to: Azure Logic Apps (Standard)
This how-to guide shows how to turn on enhanced telemetry collection in Application Insights for your Standard logic app resource and then view the collected data after your workflow finishes a run.
Prerequisites
An Azure account and subscription. If you don't have a subscription, sign up for a free Azure account.
An Application Insights instance. You create this resource in advance, when you create your Standard logic app, or after logic app deployment.
A Standard logic app and workflow, either in the Azure portal or in Visual Studio Code.
Your logic app resource or project must use the Azure Functions v4 runtime, which is enabled by default.
Your logic app must have enabled Application Insights for diagnostics logging and tracing. You can do so either when you create your logic app or after deployment.
Enable enhanced telemetry in Application Insights
In the Azure portal, open your Standard logic app resource.
On the logic app menu, under Development Tools, select Advanced Tools. On the Advanced Tools page, select Go, which opens the Kudu tools.
On the Kudu page, from the Debug console menu, select CMD. In the folder directory table, browse to the following file and select Edit: site/wwwroot/host.json
In the host.json file, add the following JSON code:
{
   "version": "2.0",
   "extensionBundle": {
      "id": "Microsoft.Azure.Functions.ExtensionBundle.Workflows",
      "version": "[1, 2.00]"
   },
   "extensions": {
      "workflow": {
         "Settings": {
            "Runtime.ApplicationInsightTelemetryVersion": "v2"
         }
      }
   }
}
This configuration enables the default level of verbosity. For other options, see Apply filtering at the source.
Open Application Insights
After your workflow finishes a run and a few minutes pass, open your Application Insights resource.
In the Azure portal, on your logic app menu, under Settings, select Application Insights.
On the Application Insights resource menu, under Monitoring, select Logs.
View enhanced logs in Application Insights
The following sections describe the tables in Application Insights where you can find and view the enhanced telemetry generated from your workflow run.
| Table name | Description |
|---|---|
| Requests | Details about the following events in workflow runs: - Trigger and action events - Retry attempts - Connector usage |
| Traces | Details about the following events in workflow runs: - Workflow start and end events - Batch send and batch receive events |
| Exceptions | Details about exception events in workflow runs |
| Dependencies | Details about dependency events in workflow runs |
Requests table
The Requests table contains fields that track data about the following events in Standard workflow runs:
- Trigger and action events
- Retry attempts
- Connector usage
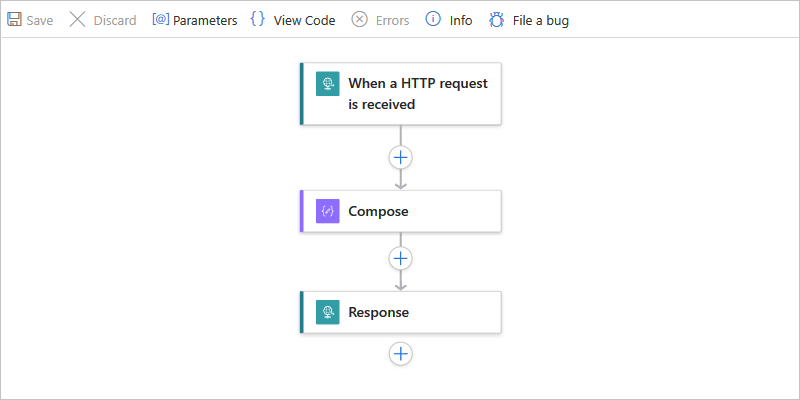
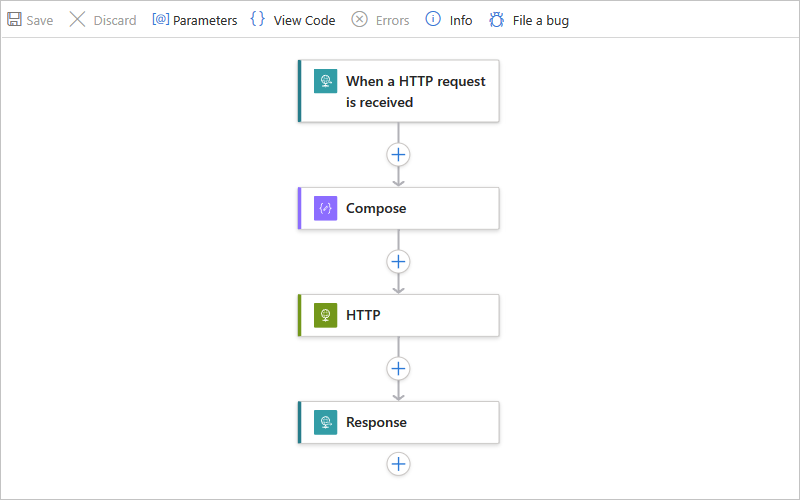
To show how data gets into these fields, suppose you have the following example Standard workflow that starts with the Request trigger followed by the Compose action and the Response action.
The trigger's settings has a parameter named Custom Tracking Id. The parameter value is set to an expression that pulls the orderId property value from the body of an incoming message:
![]()
Next, the workflow's Compose action settings has an added tracked property named solutionName. The property value is set to the name of the logic app resource.
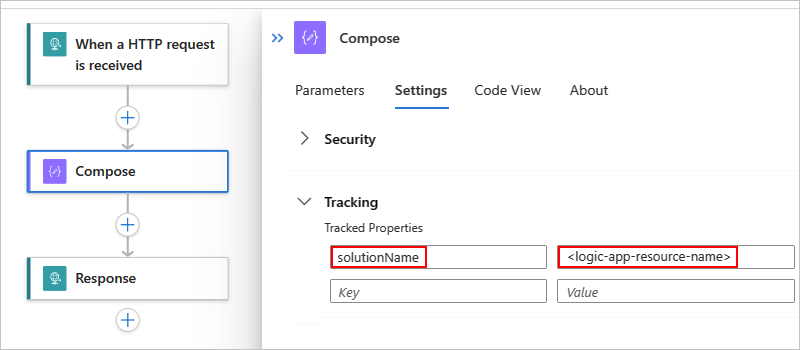
The Compose action is followed by a Response action that returns a response to the caller.
The following list has example queries that you can create and run against the Requests table:
| Task | Steps |
|---|---|
| View all trigger and action events | Query for all trigger and action events |
| View only trigger events or action events | Query for only trigger or action events |
| View trigger or action events with a specific operation type | Query trigger or action events by operation type |
| View trigger and action events with a specific workflow run ID | Query trigger and action events by workflow run ID |
| View trigger and action events with a specific client tracking ID | Query trigger and action events by client tracking ID |
| View trigger and action events with a specific solution name | Query trigger and action events by solution name |
| View trigger and action events with retry attempts | Query trigger and action events for retry attempts |
| View trigger and action events with connector usage | Query for trigger and action events for connector usage |
Query for all trigger and action events
After the workflow runs and a few minutes pass, you can create a query against the Requests table to view all the operation events.
If necessary, select the time range that you want to review. By default, this value is the last 24 hours.
To view all trigger and action events, create and run the following query:
requests
| sort by timestamp desc
| take 10
The following example shows the Results tab with the noted columns and data in each row:

Column Description Example name Workflow operation name For this example, the rows show manual (Request trigger), Compose, and Response. success Operation execution status For this example, all the rows show True for a successful execution. If an error happened, the value is False. resultCode Operation execution status code For this example, all the rows show Succeeded (200). duration Operation execution duration Varies for each operation. To view the details for a specific operation, expand the row for the trigger or action:
The following example shows the expanded details for the Request trigger:

Property Description Example Category Operation category, which is always either Workflow.Operations.Triggers or Workflow.Operations.Actions, based on the operation Workflow.Operations.Triggers. clientTrackingId Custom tracking ID, if specified 123456 runId ID for the workflow run instance 08585358375819913417237801890CU00 triggerName Trigger name manual workflowId ID for the workflow that ran the trigger c7711d107e6647179c2e15fe2c2720ce workflowName Name for the workflow that ran the trigger Request-Response-Workflow operation_Name Name for the operation that ran the trigger. In this case, this name is the same as the workflow name. Request-Response-Workflow operation_Id ID for the component or workflow that just ran. This ID is the same as the runId value for the workflow run instance. If exceptions or dependencies exist, this value transcends tables so you can link this trigger record to those exceptions or dependencies. 08585358375819913417237801890CU00 operation_ParentId Linkable ID for the workflow that called the trigger f95138daff8ab129 The following example shows the expanded details for the Compose action:

Property Description Example Category Operation category, which is always either Workflow.Operations.Triggers or Workflow.Operations.Actions, based on the operation Workflow.Operations.Actions clientTrackingId Custom tracking ID, if specified 123456 actionName Action name Compose runId ID for the workflow run instance 08585358375819913417237801890CU00 workflowId ID for the workflow that ran the action c7711d107e6647179c2e15fe2c2720ce workflowName Name for the workflow that ran the action Request-Response-Workflow solutionName Tracked property name, if specified LA-AppInsights operation_Name Name for the operation that ran the action. In this case, this name is the same as the workflow name. Request-Response-Workflow operation_Id ID for the component or workflow that just ran. This ID is the same as the runId value for the workflow run instance. If exceptions or dependencies exist, this value transcends tables so you can link this action record to those exceptions or dependencies. 08585358375819913417237801890CU00 operation_ParentId Linkable ID for the workflow that called the action f95138daff8ab129


Query for only trigger or action events
You can create a query against the Requests table to view a subset of operation events, based on operation category and the workflow name.
If necessary, select the time range that you want to review. By default, this value is the last 24 hours.
To view all trigger events in a specific workflow, create and run a query with the customDimensions.Category property value set to Workflow.Operations.Triggers and operation_Name set to the workflow name, for example:
requests
| where customDimensions.Category == "Workflow.Operations.Triggers" and operation_Name == "Request-Response-Workflow"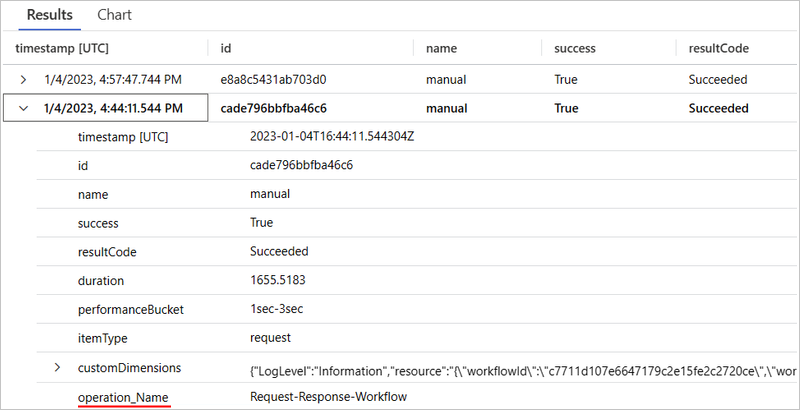
To view all action events in a specific workflow, create a query with the customDimensions.Category property value set to Workflow.Operations.Actions and operation_Name set to the workflow name, for example:
requests
| where customDimensions.Category == "Workflow.Operations.Actions" and operation_Name == "Request-Response-Workflow"
Query trigger or action events by operation type
You can create a query against the Requests table to view events for a specific trigger or action type.
If necessary, select the time range that you want to review. By default, this value is the last 24 hours.
To view all operation events with a specific trigger type, create and run a query with the customDimensions.triggerType value set to the trigger type you want, for example:
requests
| where customDimensions.triggerType == "Request"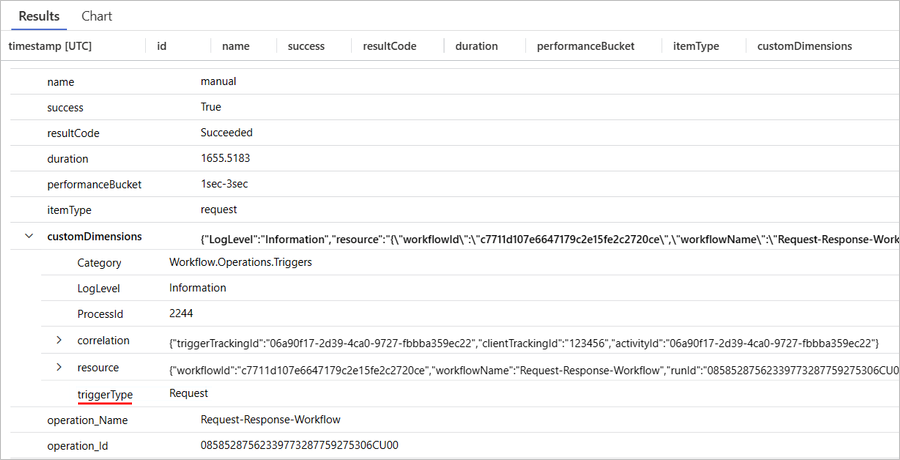
To view all operation events with a specific action type, create and run a query with the customDimensions.actionType value set to the action type you want, for example:
requests
| where customDimensions.actionType == "Compose"
Query trigger and action events by workflow run ID
You can create a query against the Requests table to view a subset of operation events, based on the workflow run ID. This workflow run ID is the same ID that you can find in the workflow's run history.
If necessary, select the time range that you want to review. By default, this value is the last 24 hours.
To view all operation events with a specific workflow run ID, create and run a query with the operation_Id value set to the workflow run ID, for example:
requests
| where operation_Id == "08585287554177334956853859655CU00"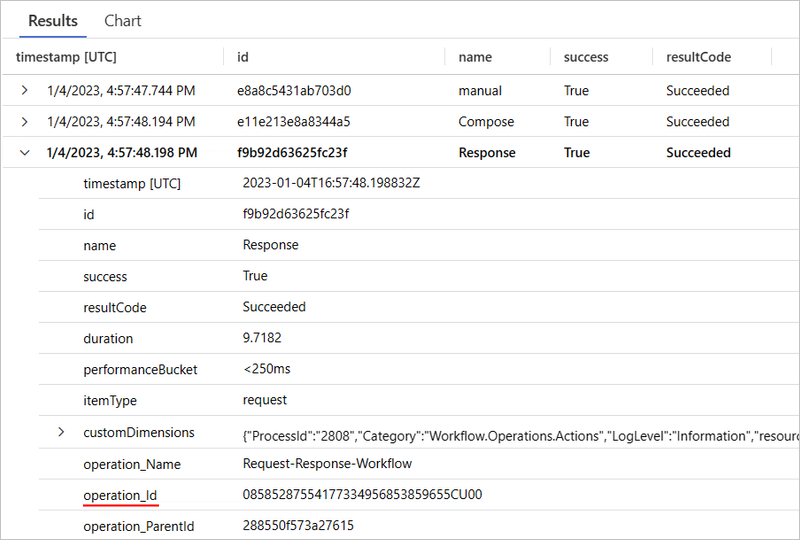
Query trigger and action events by client tracking ID
You can create a query against the Requests table to view a subset of operation events, based on the workflow name and client tracking ID.
If necessary, select the time range that you want to review. By default, this value is the last 24 hours.
To view all operation events with a specific client tracking ID in a specific workflow, create and run a query with the operation_Name value set to the workflow name and the clientTrackingId property value set to the value you want, for example:
requests
| where operation_Name == "Request-Response-Workflow"
| extend correlation = todynamic(tostring(customDimensions.correlation))
| where correlation.clientTrackingId == "123456"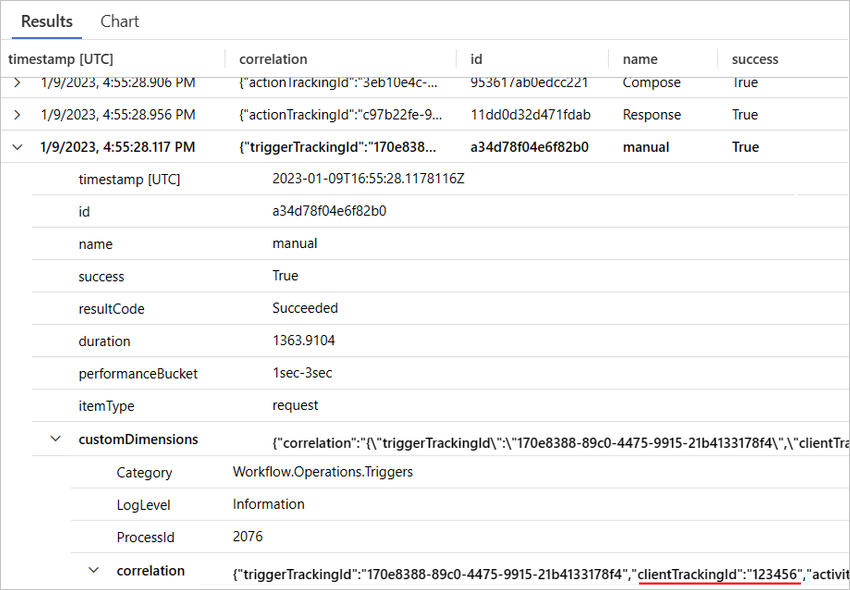
Query trigger and action events by solution name
You can create a query against the Requests table to view a subset of operation events, based on the workflow name and solution name.
If necessary, select the time range that you want to review. By default, this value is the last 24 hours.
To view all operation events with a specific client tracking ID in a specific workflow, create and run a query with the operation_Name value set to the workflow name and the solutionName property value set to the value you want, for example:
requests
| where operation_Name == "Request-Response-Workflow" and customDimensions has "trackedProperties"
| extend trackedProperties = todynamic(tostring(customDimensions.trackedProperties))
| where trackedProperties.solutionName == "LA-AppInsights"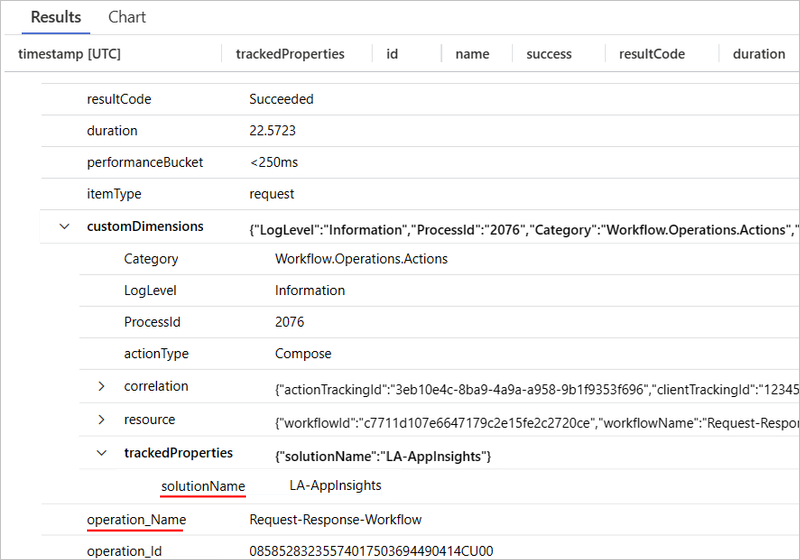
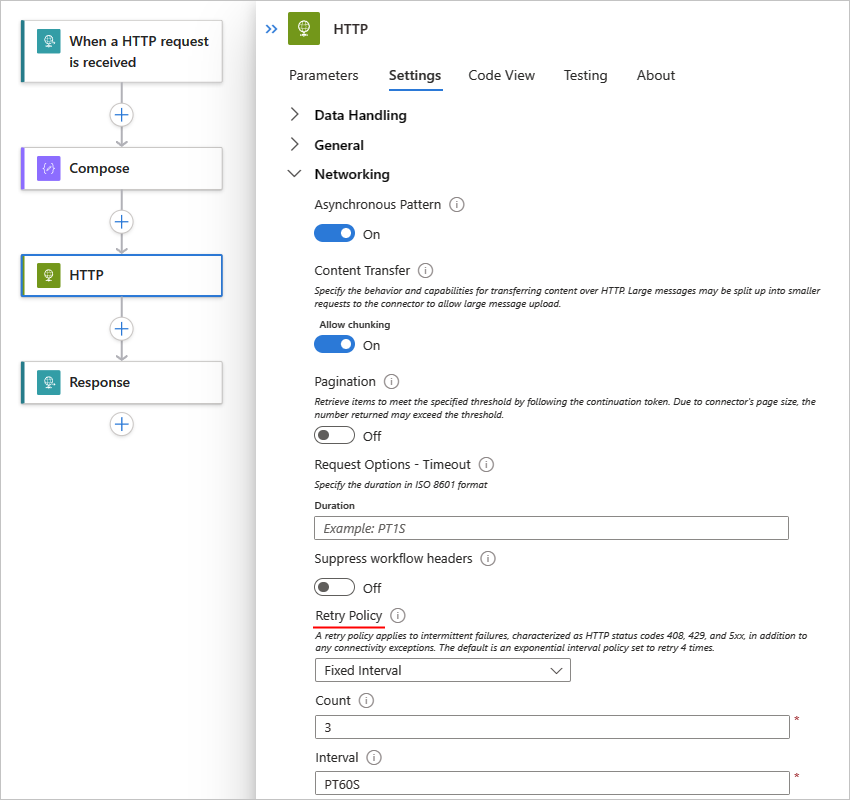
Retry attempts
To show how this data gets into the Requests table, the following example Standard workflow uses an HTTP action that calls a URL, which doesn't resolve. The workflow also has a retry policy that is set to a fixed interval that retries three times, once every 60 seconds.
Query trigger and action events for retry attempts
You can create a query against the Requests table to view a subset of operation events with retry attempts.
If necessary, select the time range that you want to review. By default, this value is the last 24 hours.
To view only trigger and action events with retry history, create and run the following query in Application Insights:
requests
| extend retryHistory = tostring(tostring(customDimensions.retryHistory))
| where isnotempty(retryHistory)
To view the retry attempts for a specific operation with a retry policy, expand the row for that operation.
The following example shows the expanded details for the HTTP action:

The success and resultCode property values indicate that the HTTP action failed. Along with the properties described in Query the Requests table for all trigger and action events, the record contains the following information, which include three retry attempts:
Property Description Example retryHistory History details for one or more retry attempts code Error type for a specific retry attempt error Details about the specific error that happened

Query trigger and action events for connector usage
You can create a query against the Requests table to view a subset of operation events, based on specific connector usage.
If necessary, select the time range that you want to review. By default, this value is the last 24 hours.
To view all trigger events using a specific connector type, create and run a query with the following properties and values:
requests
| where customDimensions.Category == "Workflow.Operations.Triggers" and customDimensions.triggerType =="ApiConnectionWebhook" and customDimensions.apiName =="commondataservice"
Property Example value customDimensions.Category Workflow.Operations.Triggers customDimensions.triggerType The operation type, for example, ApiConnectionWebhook customDimensions.apiName The connector's API name in JSON format, for example, commondataservice for the Microsoft Dataverse connector 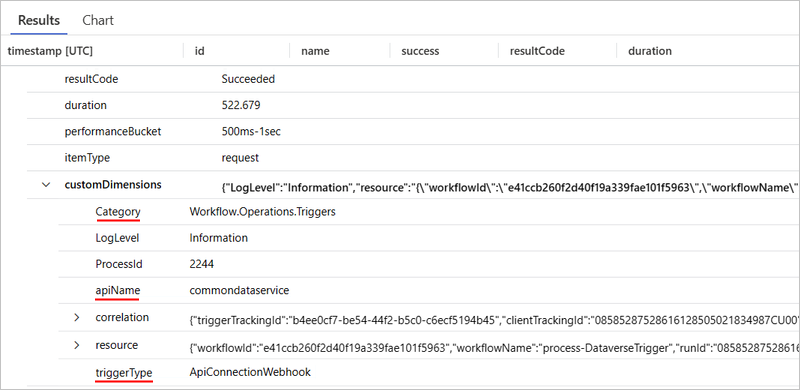
To view all action events with specific connector usage, create and run a query with the customDimensions.Category value set to Workflow.Operations.Actions, the customDimensions.triggerType value set to the operation type, and the customDimensions.apiName set to the connector's API name in JSON format, for example:
Property Example value customDimensions.Category Workflow.Operations.Actions customDimensions.triggerType The operation type, for example, ApiConnection customDimensions.apiName The connector's API name in JSON format, for example, office365 for the Microsoft Office 365 Outlook connector requests | where customDimensions.Category == "Workflow.Operations.Actions" and customDimensions.actionType == "ApiConnection" and customDimensions.apiName == "office365"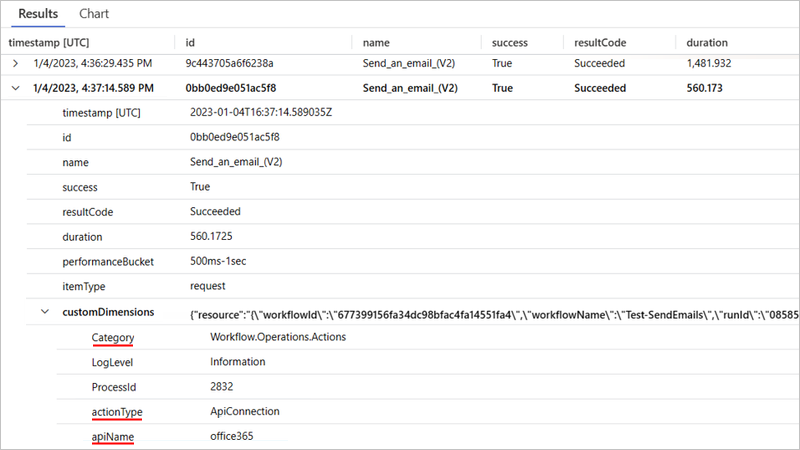
For both triggers and actions, Application Insights differentiates between the types of connections that exist. You might see different values in the actionType and triggerType fields based on whether the connection has ApiConnection, ApiConnectionWebhook, the built-in basic type such as Request, or the built-in service provider-based ServiceProvider type.
Traces table
The Traces table contains fields that track data about the following events in Standard workflow runs:
Workflow start and end events
This information is represented as two distinct events due to the potential for long-running workflow executions.
Batch send and receive events
For more information, see Using Built-In Batch Operations in Azure Logic Apps (Standard)
The following list has example queries that you can create and run against the Traces table:
| Task | Steps |
|---|---|
| View start and end events in all workflow runs | Query for start and end events in all workflow runs |
| View start and end events in a specific workflow run | Query for start and end events in a workflow run |
| View batch send and receive events in all workflow runs | Query for batch send and batch receive events in all workflow runs |
Query for start and end events in all workflow runs
You can create a query against the Traces table to view all the start and end events for all workflow runs.
If necessary, select the time range that you want to review. By default, this value is the last 24 hours.
Create and run a query with the customDimensions.Category value set to Workflow.Operations.Runs, for example:
traces
| where customDimensions.Category == "Workflow.Operations.Runs"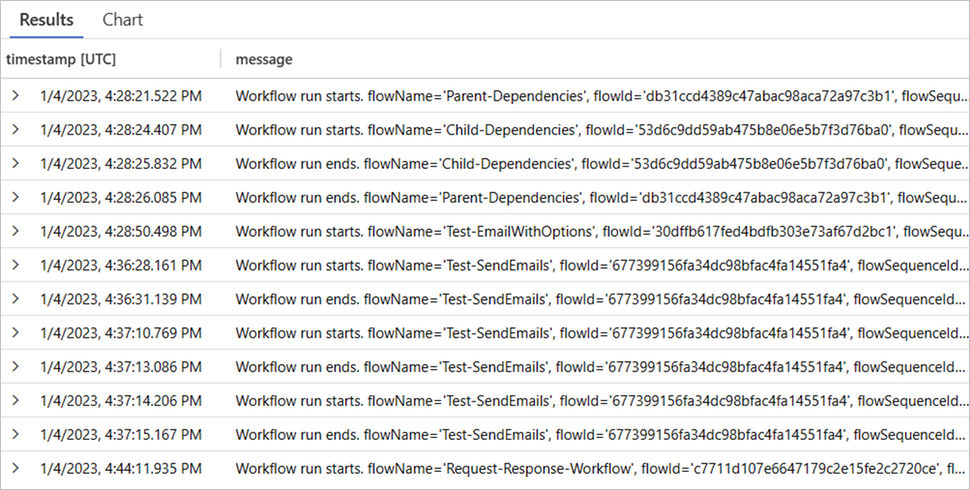
Query for start and end events in a specific workflow run
You can create a query against the Traces table to view the start and end events for a specific workflow run.
If necessary, select the time range that you want to review. By default, this value is the last 24 hours.
Create and run a query with the customDimensions.Category value set to Workflow.Operations.Runs and the operation_Id value set to the workflow run ID, for example:
traces
| where customDimensions.Category == "Workflow.Operations.Runs"
| and operation_Id == "08585287571846573488078100997CU00"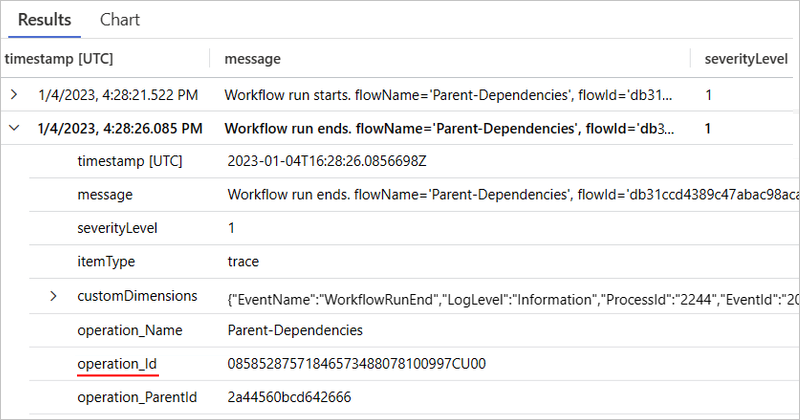
Query for batch send and batch receive events in all workflow runs
You can create a query against the Traces table to view the batch send and batch receive events in all workflow runs.
If necessary, select the time range that you want to review. By default, this value is the last 24 hours.
Create and run a query with the customDimensions.Category value set to Workflow.Operations.Runs and the operation_Id value set to the workflow run ID, for example:
traces
| where customDimensions.Category == "Workflow.Operations.Batch"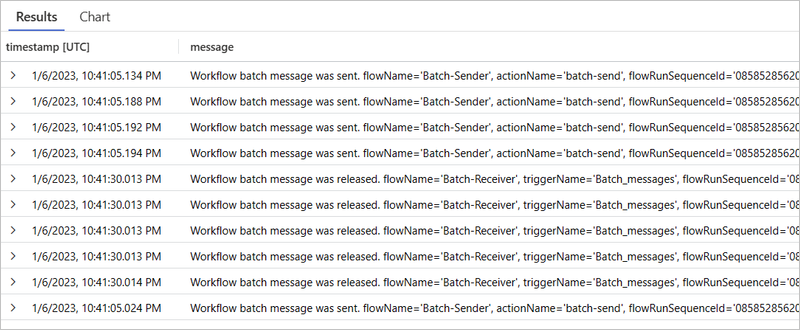
Exceptions table
The Exceptions table contains fields that track data about exception events in Standard workflow runs. To show how data gets into these fields, suppose you have the following example Standard workflow that starts with the Request trigger followed by the Compose action and the Response action. The Compose action uses an expression that divides a value by zero, which generates an exception:

Query for exception events in all workflow runs
You can create a query against the Exceptions table to view the exception events in all workflow runs.
If necessary, select the time range that you want to review. By default, this value is the last 24 hours.
To view all exception events, create and run the following query in Application Insights:
exceptions
| sort by timestamp desc
To view the details for a specific exception, expand the row for that exception:
The following example shows the expanded exception for the Compose action and details about the exception:

Property Description problemId Exception type, or a short description about the exception that happened outerMessage More detailed description about the exception details Verbose and most complete information about the exception clientTrackingId Client tracking ID, if specified workflowId ID for the workflow that experienced the exception workflowName Name for the workflow that experienced the exception runId ID for the workflow run instance actionName Name for the action that failed with the exception operation_Name Name for the workflow that experienced the exception operation_Id ID for the component or workflow that just ran. This ID is the same as the runId value for the workflow run instance. This value transcends tables so you can link this exception record with the workflow run instance. operation_ParentId ID for the workflow that called the action, which you can link to the action's ID in the Requests table To view the exceptions for a specific workflow, create and run the following query:
exceptions
| where operation_Name contains "Request-Response-Workflow-Exception"

Dependencies table
The Dependencies table contains fields that track data about dependency events in Standard workflow runs. These events are emitted when one resource calls another resource and when both resources use Application Insights. Examples for Azure Logic Apps include a service calling another service over HTTP, a database, or file system. Application Insights measures the duration of dependency calls and whether those calls succeed or fail, along with information, such as the dependency name. You can investigate specific dependency calls and correlate them to requests and exceptions.
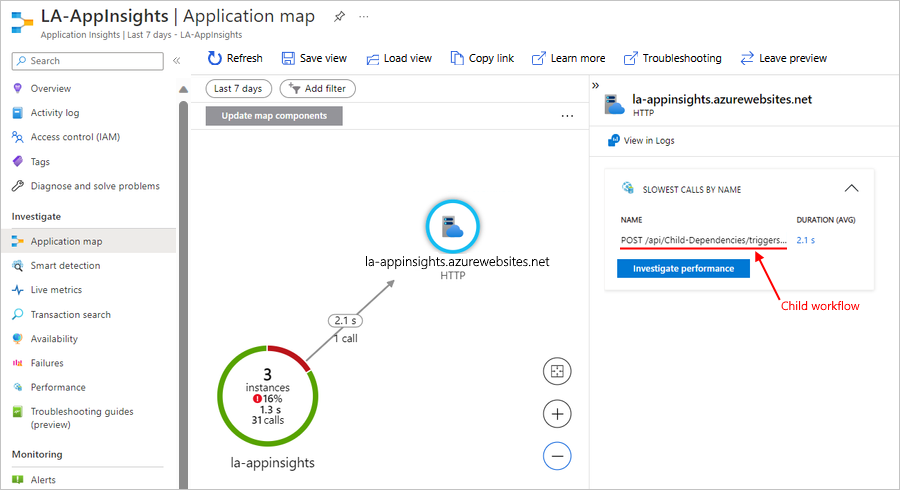
To show how data gets into these fields, suppose you have the following example Standard parent workflow that calls a child workflow over HTTP using the HTTP action:
Query for dependency events in a specific workflow
You can create a query against the Dependencies table to view the dependency events in a specific workflow run.
If necessary, select the time range that you want to review. By default, this value is the last 24 hours.
To view dependency events between the parent workflow and the child workflow, create and run the following query:
union requests, dependencies
| where operation_Id contains "<runId>"
This query uses the union operator to return records from the Requests table and Dependencies table. The query also uses the operation_Id property value to provide the link between records by specifying the workflow runId value you want, for example:
union requests, dependencies
| where operation_Id contains "08585355753671110236506928546CU00"
The following example shows a dependency event for the specified workflow, including records for the operation events in the parent workflow from the Requests table and then a dependency record from the Dependencies table:

For the operation event records, the itemType column shows their record types as request. For the dependency record, the itemType column indicates the record type as dependency.
Property Description runId ID for the workflow run instance actionName Name for the action where the dependency event happens operation_Id ID for the specified workflow. This ID is the same as the runId value for the workflow run instance. This value transcends tables so you can link this dependency record with the workflow run instance. operation_ParentId ID for the action where the dependency event happens, which also links the operation event record and dependency event record together

With your query, you can also visualize the dependency call from a parent workflow to a child workflow when you use the application map in Application Insights. The operation_Id value in your query provides the link that makes this visualization possible.
To open the application map, on the Application Insights resource menu, under Investigate, select Application map.
Filter events
In Application Insights, you can filter events in the following ways:
Create and run queries as described in earlier sections.
Filter at the source by specifying criteria to evaluate before emitting events.
By applying filters at the source, you can reduce the amount of necessary storage and as a result, operating costs.
Apply filtering at the source
In the Requests table or Traces table, a record has a node named customDimensions, which contains a Category property. For example, in the Requests table, the request record for a Batch trigger event looks similar to the following sample:
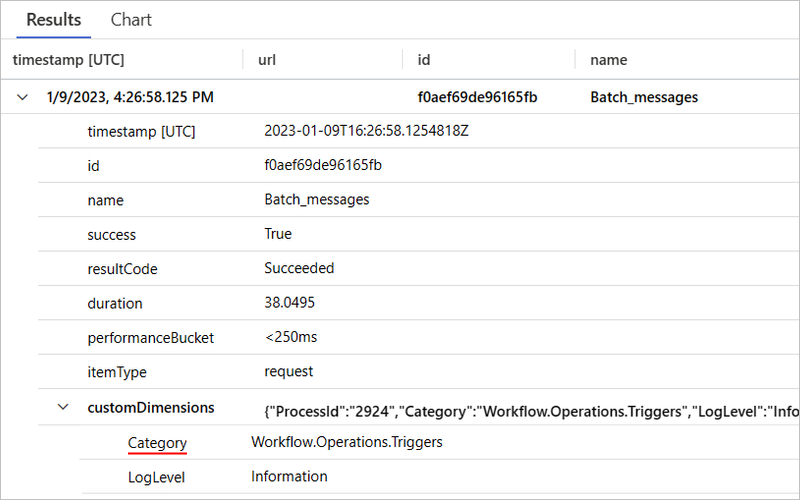
In the Requests table, the following Category property values can help you differentiate and associate different verbosity levels:
| Category value | Description |
|---|---|
| Workflow.Operations.Triggers | Identifies a request record for a trigger event |
| Workflow.Operations.Actions | Identifies a request record for an action event |
For each Category value, you can independently set the verbosity level in the host.json file for your logic app resource or project. For example, to return only the records for trigger or action events that have errors, in the host.json file, you can add the following logging JSON object, which contains a logLevel JSON object with the verbosity levels you want:
{
   "logging": {
      "logLevel": {
         "Workflow.Operations.Actions": "Error",
         "Workflow.Operations.Triggers": "Error"
      }
   }
}
For Traces table records, the following examples show ways that you can change the verbosity level for events:
{
   "logging": {
      "logLevel": {
         "Workflow.Host": "Warning",
         "Workflow.Jobs": "Warning",
         "Workflow.Runtime": "Warning"
      }
   }
}
The following example sets the log's default verbosity level to Warning, but keeps the verbosity level at Information for trigger, action, and workflow run events:
{
   "logging": {
      "logLevel": {
         "default": "Warning",
         "Workflow.Operations.Actions": "Information",
         "Workflow.Operations.Runs": "Information",
         "Workflow.Operations.Triggers": "Information"
      }
   }
}
If you don't specify any logLevel values, the default verbosity level is Information. For more information, see Configure log levels.
In the Azure portal, open your Standard logic app resource.
On the logic app menu, under Development Tools, select Advanced Tools. On the Advanced Tools page, select Go, which opens the Kudu tools.
On the Kudu page, from the Debug console menu, select CMD. In the folder directory table, browse to the following file and select Edit: site/wwwroot/host.json
In the host.json file, add the logging JSON object with the logLevel values set to the verbosity levels that you want:
{
   "logging": {
      "logLevel": {
         "Workflow.Operations.Actions": "<verbosity-level>",
         "Workflow.Operations.Triggers": "<verbosity-level>"
      }
   }
}
View workflow metrics in Application Insights
With the telemetry enhancements in Application Insights, you also get workflow insights in the Metrics dashboard.
Open the Metrics dashboard and set up basic filters
In the Azure portal, open your Application Insights resource, if not opened already.
On your Application Insights resource menu, under Monitoring, select Metrics.
From the Scope list, select your Application Insights instance.
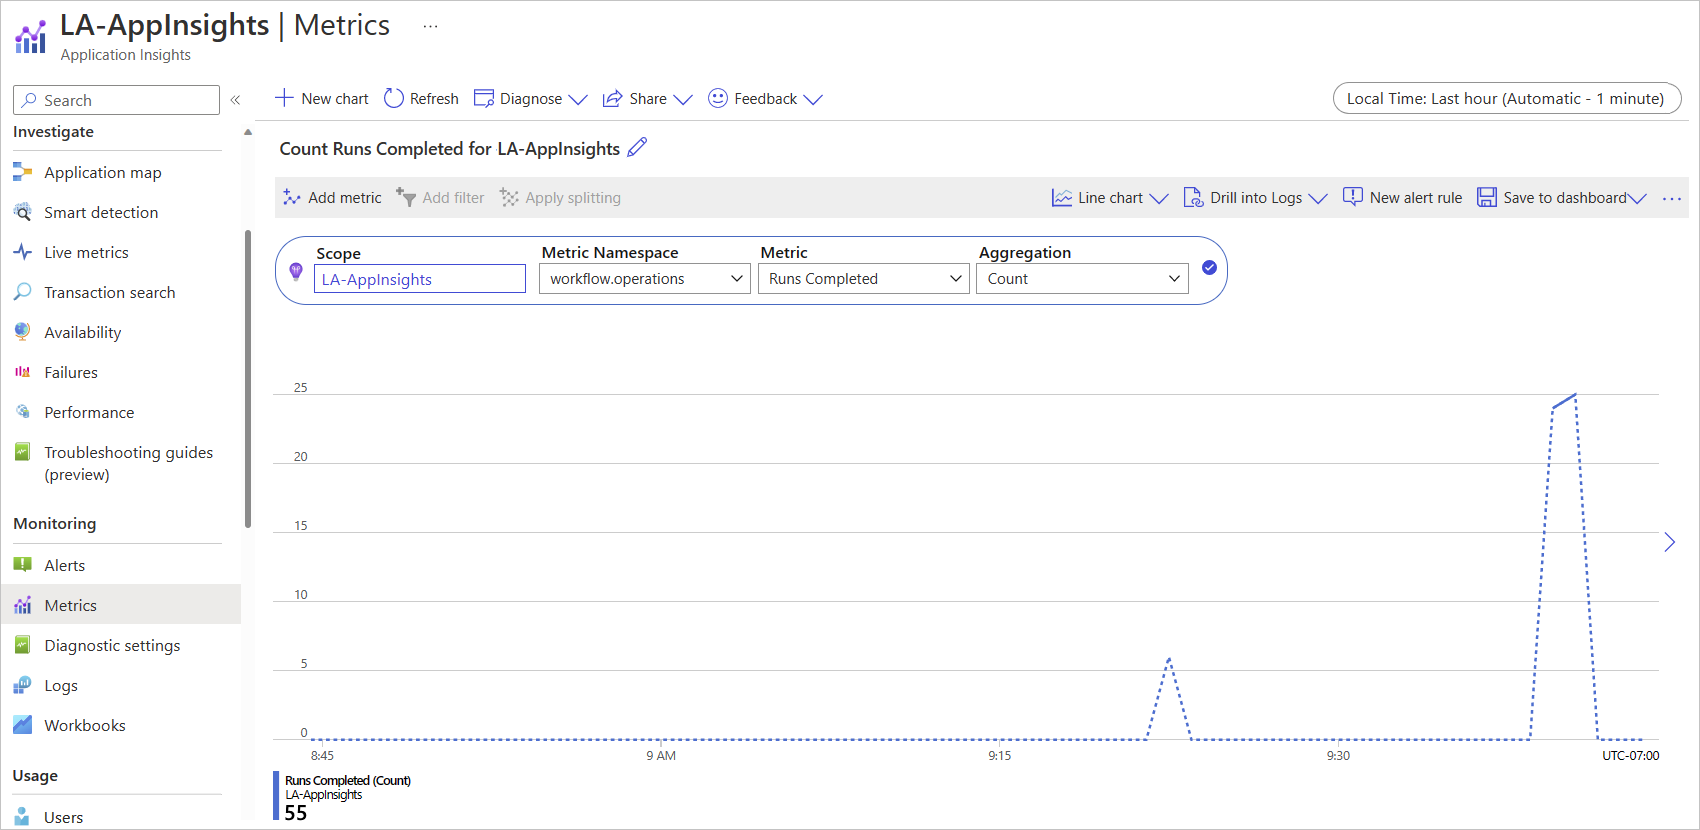
From the Metric Namespace list, select workflow.operations.
From the Metric list, select a metric, for example, Runs Completed.
From the Aggregation list, select a type, for example, Count or Avg.
When you're done, the Metrics dashboard shows a chart with your finished workflow executions.

Filter based on a specific workflow
When you enable multidimensional metrics in the Metrics dashboard, you can target a subset of the overall events captured in Application Insights and filter events based on a specific workflow.
On your Application Insights resource, enable multidimensional metrics.
In Application Insights, open the Metrics dashboard.
On the chart toolbar, select Add filter.
From the Property list, select Workflow.
From the Operator list, select the equal sign (=).
From the Values list, select the workflows you want.


View "live" log data and metrics
With Application Insights enhanced telemetry enabled, you can view near real-time log data and other metrics from your Application Insights instance in the Azure portal. You can use this visualization to plot inbound requests, outbound requests, and overall health. You also get a table for trace level diagnostics.
In the Azure portal, open your Application Insights resource, if not opened already.
On your Application Insights resource menu, under Investigate, select Live metrics.
The Live metrics page shows the log data and other metrics, for example:


For more information, see Live Metrics: Monitor and diagnose with 1-second latency.
Note
As Standard logic app workflows are based on Azure Functions, Live Metrics supports these logic app workflows.
Stream and view debug output from application log files
With Application Insights enhanced telemetry enabled, you can stream verbose debugging information in the Azure portal for your application's log files. This information is equivalent to the output generated from debugging your workflow in your local Visual Studio Code environment.
In the Azure portal, open your Standard logic app resource.
On your logic app resource menu, under Monitoring, select Log stream.
The Log stream page connects to your Application Insights instance and shows the debugging output. For example, the following output includes request and response calls among other information:


Next steps
Feedback
Coming soon: Throughout 2024 we will be phasing out GitHub Issues as the feedback mechanism for content and replacing it with a new feedback system. For more information see: https://aka.ms/ContentUserFeedback.
Submit and view feedback for