Log & view metrics and log files v1
APPLIES TO:  Python SDK azureml v1
Log real-time information using both the default Python logging package and Azure Machine Learning Python SDK-specific functionality. You can log locally and send logs to your workspace in the portal.
Logs can help you diagnose errors and warnings, or track performance metrics like parameters and model performance. In this article, you learn how to enable logging in the following scenarios:
- Log run metrics
- Interactive training sessions
- Submitting training jobs using ScriptRunConfig
- Python native
loggingsettings - Logging from additional sources
Tip
This article shows you how to monitor the model training process. If you're interested in monitoring resource usage and events from Azure Machine Learning, such as quotas, completed training runs, or completed model deployments, see Monitoring Azure Machine Learning.
Data types
You can log multiple data types including scalar values, lists, tables, images, directories, and more. For more information, and Python code examples for different data types, see the Run class reference page.
Logging run metrics
Use the following methods in the logging APIs to influence the metrics visualizations. Note the service limits for these logged metrics.
| Logged Value | Example code | Format in portal |
|---|---|---|
| Log an array of numeric values | run.log_list(name='Fibonacci', value=[0, 1, 1, 2, 3, 5, 8, 13, 21, 34, 55, 89]) |
single-variable line chart |
| Log a single numeric value with the same metric name repeatedly used (like from within a for loop) | for i in tqdm(range(-10, 10)): run.log(name='Sigmoid', value=1 / (1 + np.exp(-i))) angle = i / 2.0 |
Single-variable line chart |
| Log a row with 2 numerical columns repeatedly | run.log_row(name='Cosine Wave', angle=angle, cos=np.cos(angle)) sines['angle'].append(angle) sines['sine'].append(np.sin(angle)) |
Two-variable line chart |
| Log table with 2 numerical columns | run.log_table(name='Sine Wave', value=sines) |
Two-variable line chart |
| Log image | run.log_image(name='food', path='./breadpudding.jpg', plot=None, description='desert') |
Use this method to log an image file or a matplotlib plot to the run. These images will be visible and comparable in the run record |
Logging with MLflow
We recommend logging your models, metrics and artifacts with MLflow as it's open source and it supports local mode to cloud portability. The following table and code examples show how to use MLflow to log metrics and artifacts from your training runs. Learn more about MLflow's logging methods and design patterns.
Be sure to install the mlflow and azureml-mlflow pip packages to your workspace.
pip install mlflow
pip install azureml-mlflow
Set the MLflow tracking URI to point at the Azure Machine Learning backend to ensure that your metrics and artifacts are logged to your workspace.
from azureml.core import Workspace
import mlflow
from mlflow.tracking import MlflowClient

ws = Workspace.from_config()
mlflow.set_tracking_uri(ws.get_mlflow_tracking_uri())

mlflow.create_experiment("mlflow-experiment")
mlflow.set_experiment("mlflow-experiment")
mlflow_run = mlflow.start_run()
| Logged Value | Example code | Notes |
|---|---|---|
| Log a numeric value (int or float) | mlflow.log_metric('my_metric', 1) |
|
| Log a boolean value | mlflow.log_metric('my_metric', 0) |
0 = True, 1 = False |
| Log a string | mlflow.log_text('foo', 'my_string') |
Logged as an artifact |
| Log numpy metrics or PIL image objects | mlflow.log_image(img, 'figure.png') |
|
| Log matlotlib plot or image file | mlflow.log_figure(fig, "figure.png") |
View run metrics via the SDK
You can view the metrics of a trained model using run.get_metrics().
from azureml.core import Run
run = Run.get_context()
run.log('metric-name', metric_value)

metrics = run.get_metrics()
# metrics is of type Dict[str, List[float]] mapping metric names
# to a list of the values for that metric in the given run.

metrics.get('metric-name')
# list of metrics in the order they were recorded
You can also access run information using MLflow through the run object's data and info properties. See the MLflow.entities.Run object documentation for more information.
After the run completes, you can retrieve it using the MlFlowClient().
from mlflow.tracking import MlflowClient

# Use MlFlow to retrieve the run that was just completed
client = MlflowClient()
finished_mlflow_run = MlflowClient().get_run(mlflow_run.info.run_id)
You can view the metrics, parameters, and tags for the run in the data field of the run object.
metrics = finished_mlflow_run.data.metrics
tags = finished_mlflow_run.data.tags
params = finished_mlflow_run.data.params
Note
The metrics dictionary under mlflow.entities.Run.data.metrics only returns the most recently logged value for a given metric name. For example, if you log, in order, 1, then 2, then 3, then 4 to a metric called sample_metric, only 4 is present in the metrics dictionary for sample_metric.
To get all metrics logged for a particular metric name, you can use MlFlowClient.get_metric_history().
View run metrics in the studio UI
You can browse completed run records, including logged metrics, in the Azure Machine Learning studio.
Navigate to the Experiments tab. To view all your runs in your Workspace across Experiments, select the All runs tab. You can drill down on runs for specific Experiments by applying the Experiment filter in the top menu bar.
For the individual Experiment view, select the All experiments tab. On the experiment run dashboard, you can see tracked metrics and logs for each run.
You can also edit the run list table to select multiple runs and display either the last, minimum, or maximum logged value for your runs. Customize your charts to compare the logged metrics values and aggregates across multiple runs. You can plot multiple metrics on the y-axis of your chart and customize your x-axis to plot your logged metrics.
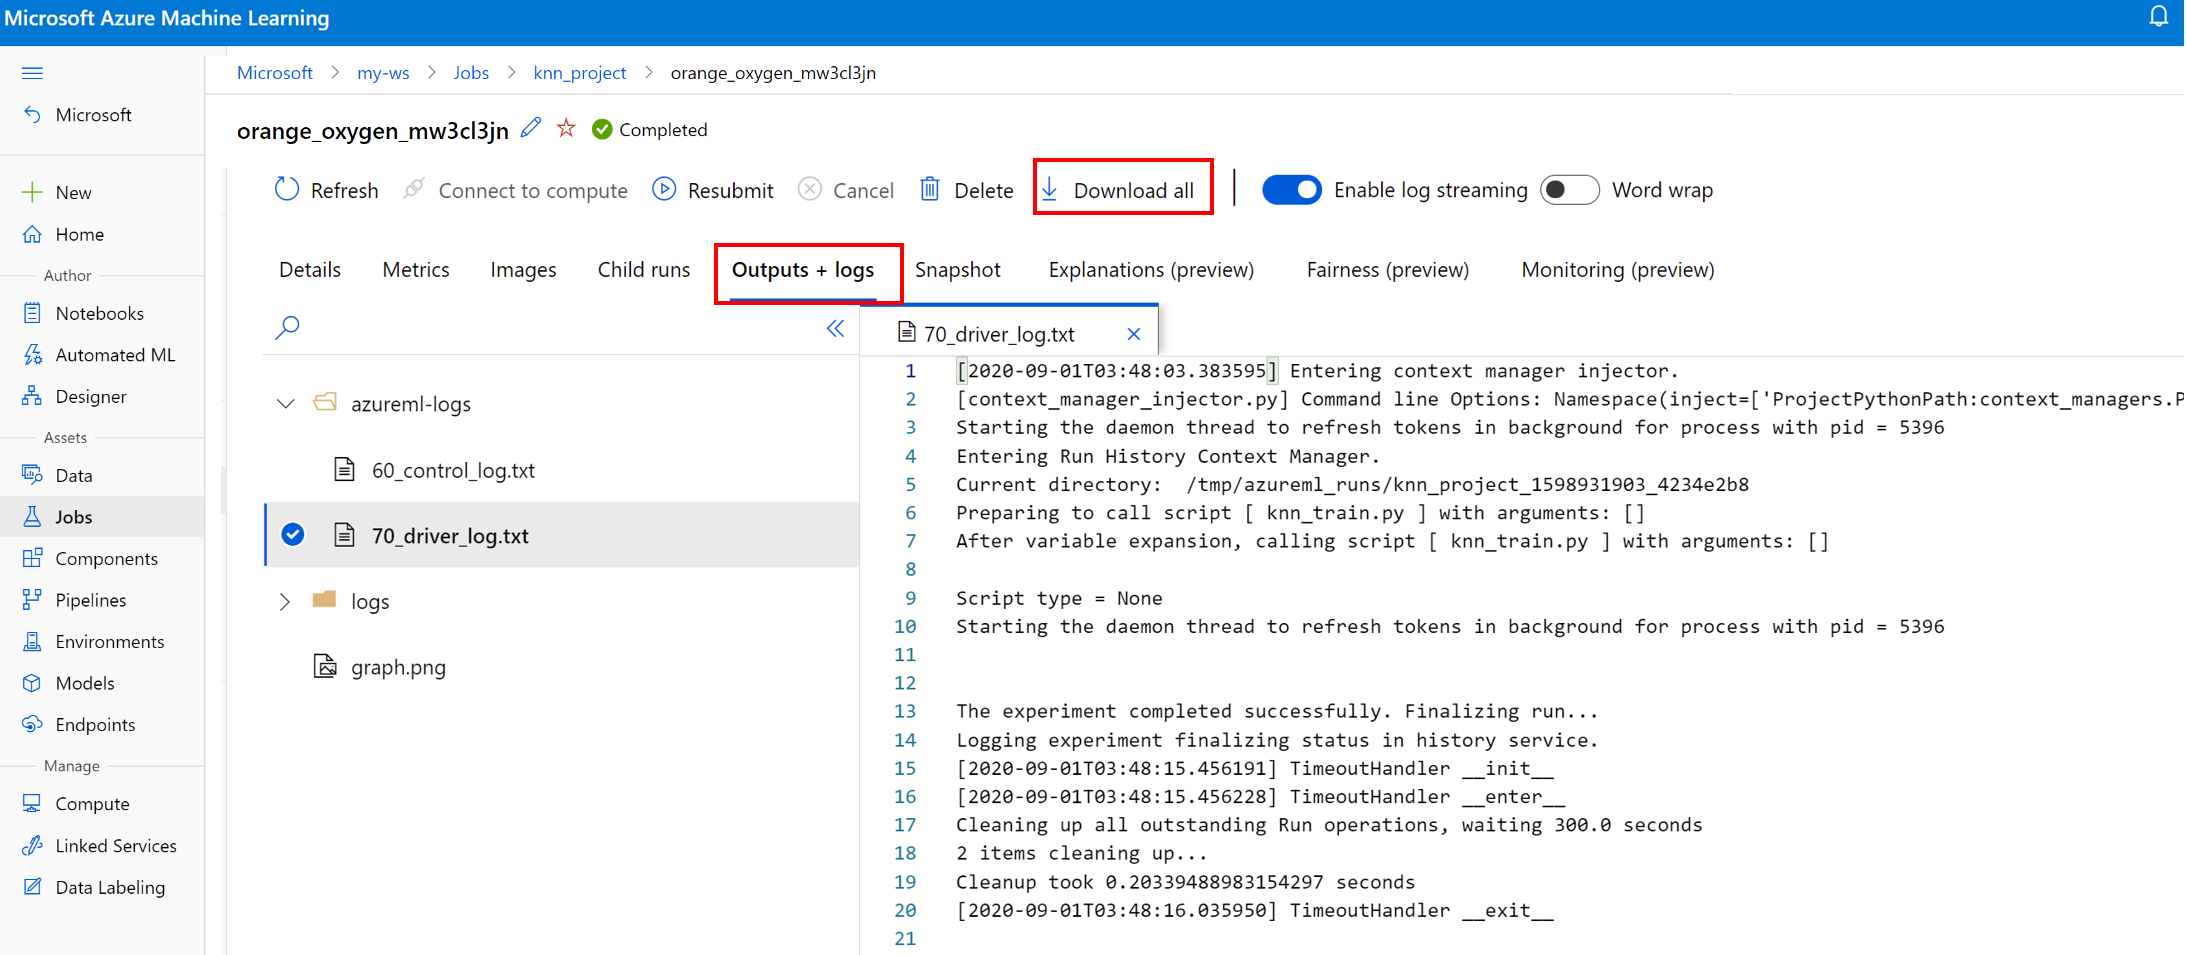
View and download log files for a run
Log files are an essential resource for debugging the Azure Machine Learning workloads. After submitting a training job, drill down to a specific run to view its logs and outputs:
- Navigate to the Experiments tab.
- Select the runID for a specific run.
- Select Outputs and logs at the top of the page.
- Select Download all to download all your logs into a zip folder.
- You can also download individual log files by choosing the log file and selecting Download
user_logs folder
This folder contains information about the user generated logs. This folder is open by default, and the std_log.txt log is selected. The std_log.txt is where your code's logs (for example, print statements) show up. This file contains stdout log and stderr logs from your control script and training script, one per process. In the majority of cases, you will monitor the logs here.
system_logs folder
This folder contains the logs generated by Azure Machine Learning and it will be closed by default. The logs generated by the system are grouped into different folders, based on the stage of the job in the runtime.
Other folders
For jobs training on multi-compute clusters, logs are present for each node IP. The structure for each node is the same as single node jobs. There is one more logs folder for overall execution, stderr, and stdout logs.
Azure Machine Learning logs information from various sources during training, such as AutoML or the Docker container that runs the training job. Many of these logs are not documented. If you encounter problems and contact Microsoft support, they may be able to use these logs during troubleshooting.
Interactive logging session
Interactive logging sessions are typically used in notebook environments. The method Experiment.start_logging() starts an interactive logging session. Any metrics logged during the session are added to the run record in the experiment. The method run.complete() ends the sessions and marks the run as completed.
ScriptRun logs
In this section, you learn how to add logging code inside of runs created when configured with ScriptRunConfig. You can use the ScriptRunConfig class to encapsulate scripts and environments for repeatable runs. You can also use this option to show a visual Jupyter Notebooks widget for monitoring.
This example performs a parameter sweep over alpha values and captures the results using the run.log() method.
Create a training script that includes the logging logic,
train.py.# Copyright (c) Microsoft. All rights reserved. # Licensed under the MIT license. from sklearn.datasets import load_diabetes from sklearn.linear_model import Ridge from sklearn.metrics import mean_squared_error from sklearn.model_selection import train_test_split from azureml.core.run import Run import os import numpy as np import mylib # sklearn.externals.joblib is removed in 0.23 try: from sklearn.externals import joblib except ImportError: import joblib os.makedirs('./outputs', exist_ok=True) X, y = load_diabetes(return_X_y=True) run = Run.get_context() X_train, X_test, y_train, y_test = train_test_split(X, y, test_size=0.2, random_state=0) data = {"train": {"X": X_train, "y": y_train}, "test": {"X": X_test, "y": y_test}} # list of numbers from 0.0 to 1.0 with a 0.05 interval alphas = mylib.get_alphas() for alpha in alphas: # Use Ridge algorithm to create a regression model reg = Ridge(alpha=alpha) reg.fit(data["train"]["X"], data["train"]["y"]) preds = reg.predict(data["test"]["X"]) mse = mean_squared_error(preds, data["test"]["y"]) run.log('alpha', alpha) run.log('mse', mse) model_file_name = 'ridge_{0:.2f}.pkl'.format(alpha) # save model in the outputs folder so it automatically get uploaded with open(model_file_name, "wb") as file: joblib.dump(value=reg, filename=os.path.join('./outputs/', model_file_name)) print('alpha is {0:.2f}, and mse is {1:0.2f}'.format(alpha, mse))Submit the
train.pyscript to run in a user-managed environment. The entire script folder is submitted for training.from azureml.core import ScriptRunConfig src = ScriptRunConfig(source_directory='./scripts', script='train.py', environment=user_managed_env)run = exp.submit(src)The
show_outputparameter turns on verbose logging, which lets you see details from the training process as well as information about any remote resources or compute targets. Use the following code to turn on verbose logging when you submit the experiment.run = exp.submit(src, show_output=True)You can also use the same parameter in the
wait_for_completionfunction on the resulting run.run.wait_for_completion(show_output=True)
Native Python logging
Some logs in the SDK may contain an error that instructs you to set the logging level to DEBUG. To set the logging level, add the following code to your script.
import logging
logging.basicConfig(level=logging.DEBUG)
Other logging sources
Azure Machine Learning can also log information from other sources during training, such as automated machine learning runs, or Docker containers that run the jobs. These logs aren't documented, but if you encounter problems and contact Microsoft support, they may be able to use these logs during troubleshooting.
For information on logging metrics in Azure Machine Learning designer, see How to log metrics in the designer
Example notebooks
The following notebooks demonstrate concepts in this article:
- how-to-use-azureml/training/train-on-local
- how-to-use-azureml/track-and-monitor-experiments/logging-api
Learn how to run notebooks by following the article Use Jupyter notebooks to explore this service.
Next steps
See these articles to learn more on how to use Azure Machine Learning:
- See an example of how to register the best model and deploy it in the tutorial, Train an image classification model with Azure Machine Learning.
Feedback
Coming soon: Throughout 2024 we will be phasing out GitHub Issues as the feedback mechanism for content and replacing it with a new feedback system. For more information see: https://aka.ms/ContentUserFeedback.
Submit and view feedback for