Configure and access Azure Database for MariaDB slow query logs from the Azure portal
Important
Azure Database for MariaDB is on the retirement path. We strongly recommend that you migrate to Azure Database for MySQL. For more information about migrating to Azure Database for MySQL, see What's happening to Azure Database for MariaDB?.
You can configure, list, and download the Azure Database for MariaDB slow query logs from the Azure portal.
Prerequisites
The steps in this article require that you have Azure Database for MariaDB server.
Configure logging
Configure access to the slow query log.
Sign in to the Azure portal.
Select your Azure Database for MariaDB server.
Under the Monitoring section in the sidebar, select Server logs.
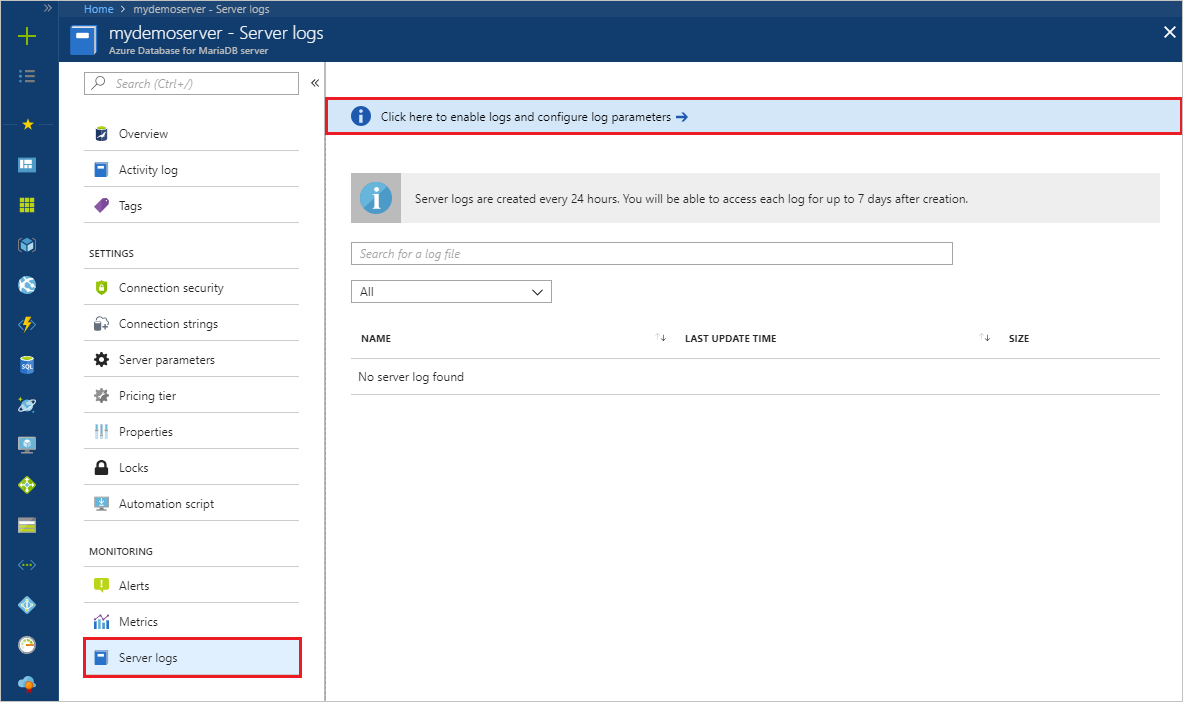
To see the server parameters, select Select here to enable logs and configure log parameters.
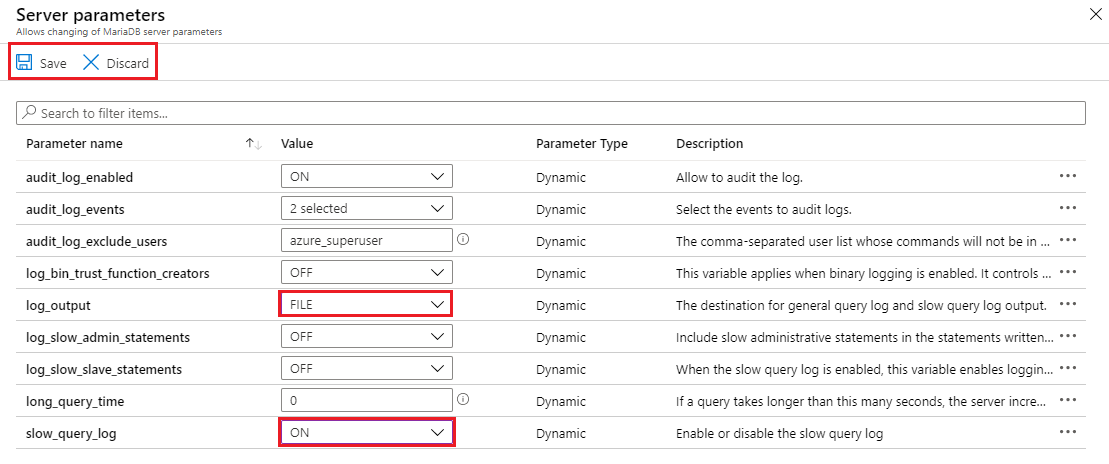
Turn slow_query_log to ON.
Select where to output the logs to using log_output. To send logs to both local storage and Azure Monitor Diagnostic Logs, select File.
Change any other parameters needed.
Select Save.
From the Server Parameters page, you can return to the list of logs by closing the page.
View list and download logs
After logging begins, you can view a list of available slow query logs, and download individual log files.
Open the Azure portal.
Select your Azure Database for MariaDB server.
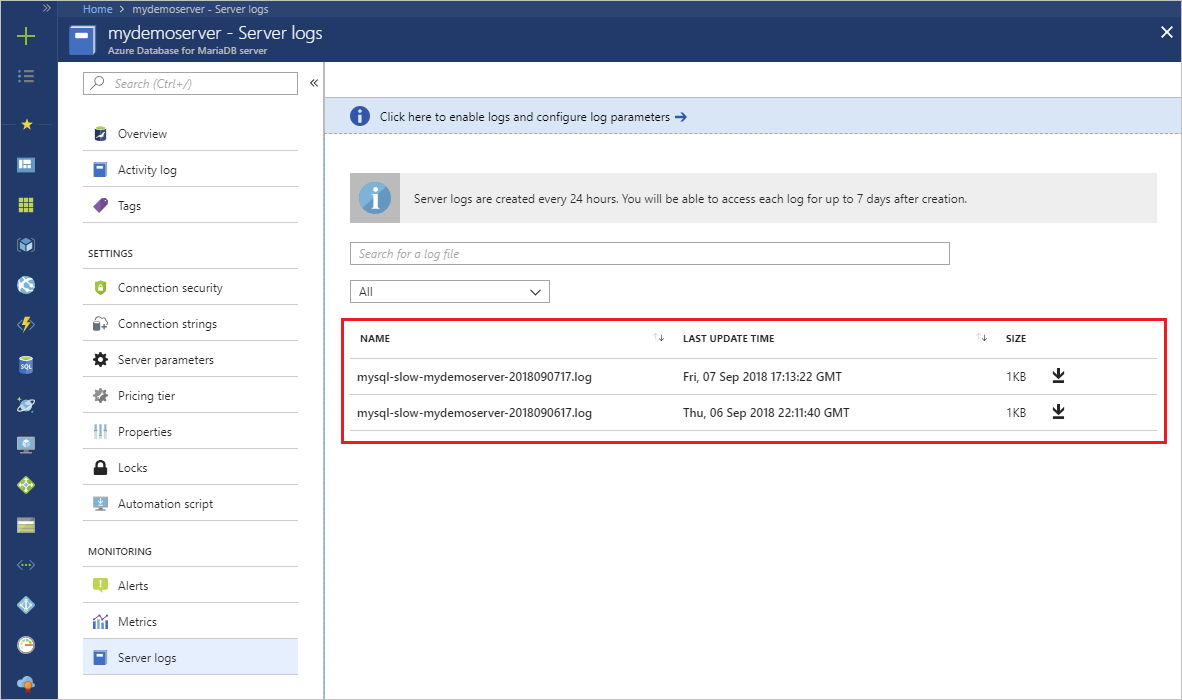
Under the Monitoring section in the sidebar, select Server logs. The page shows a list of your log files.
Tip
The naming convention of the log is mysql-slow-< your server name>-yyyymmddhh.log. The date and time used in the file name is the time when the log was issued. Log files are rotated every 24 hours or 7.5 GB, whichever comes first.
If needed, use the search box to quickly narrow down to a specific log, based on date and time. The search is on the name of the log.
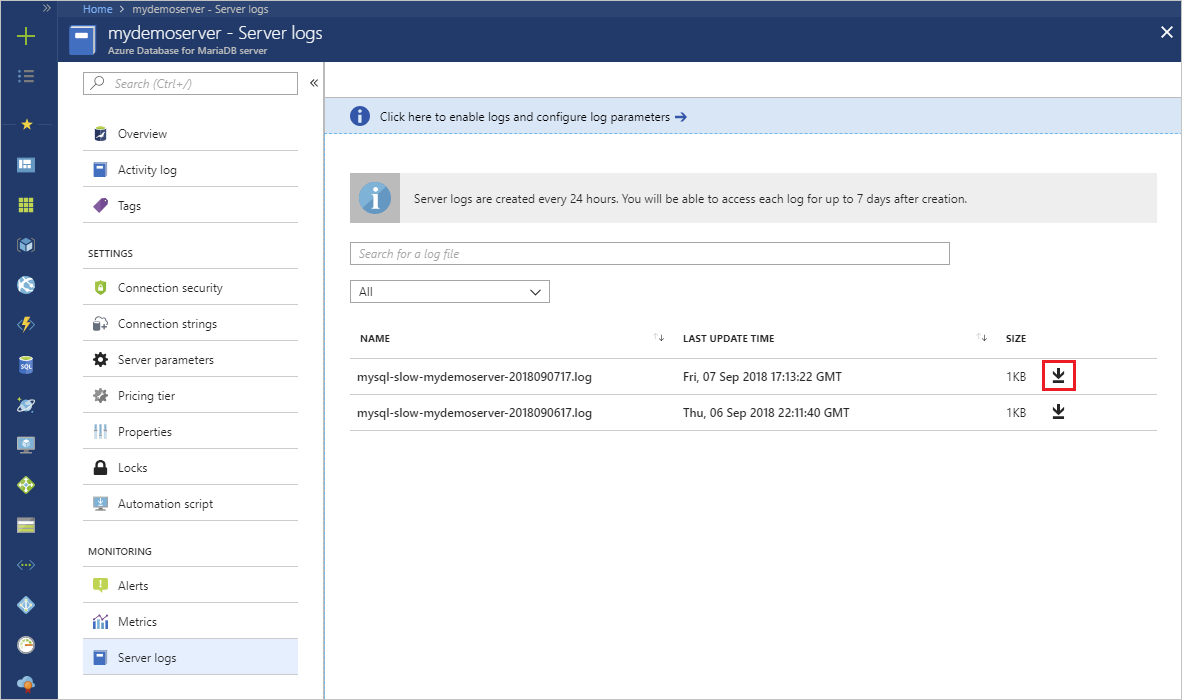
To download individual log files, select the down-arrow icon next to each log file in the table row.
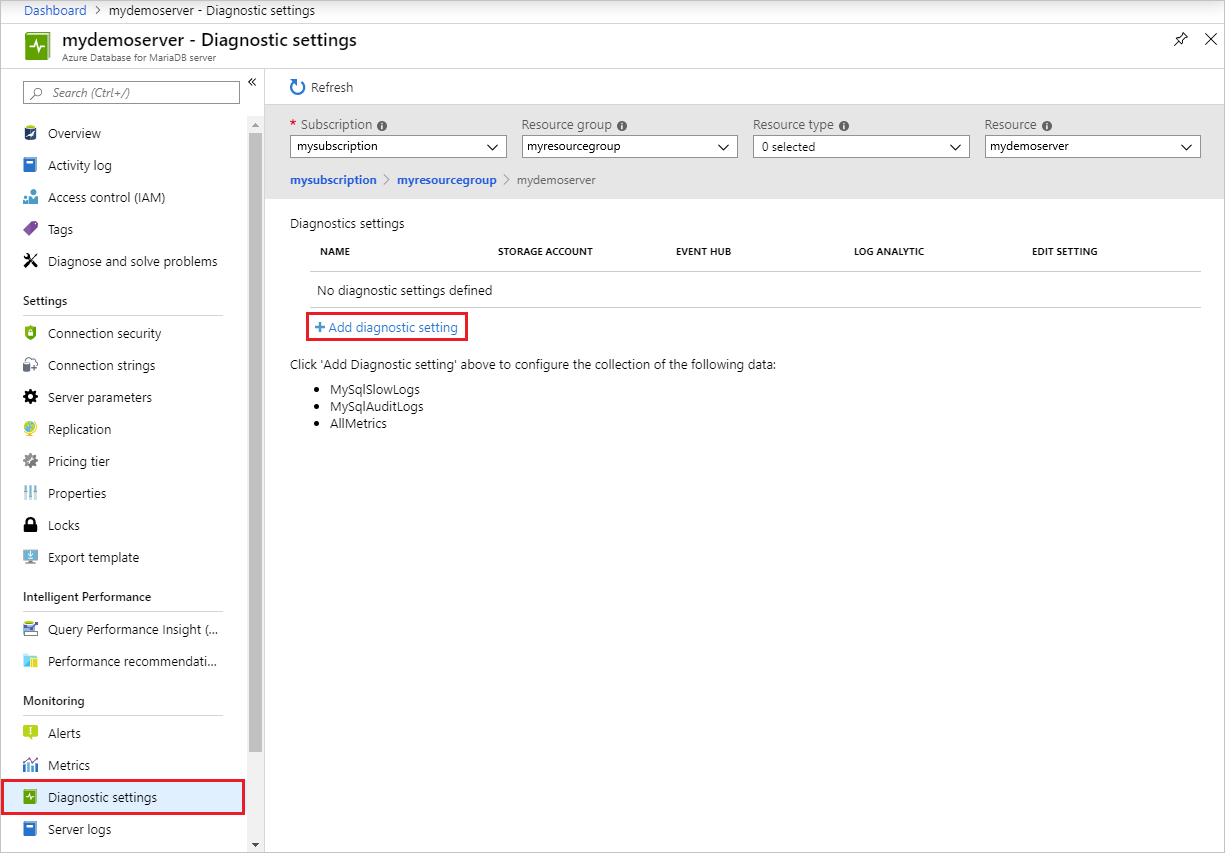
Set up diagnostic logs
Under the Monitoring section in the sidebar, select Diagnostic settings > Add diagnostic setting.
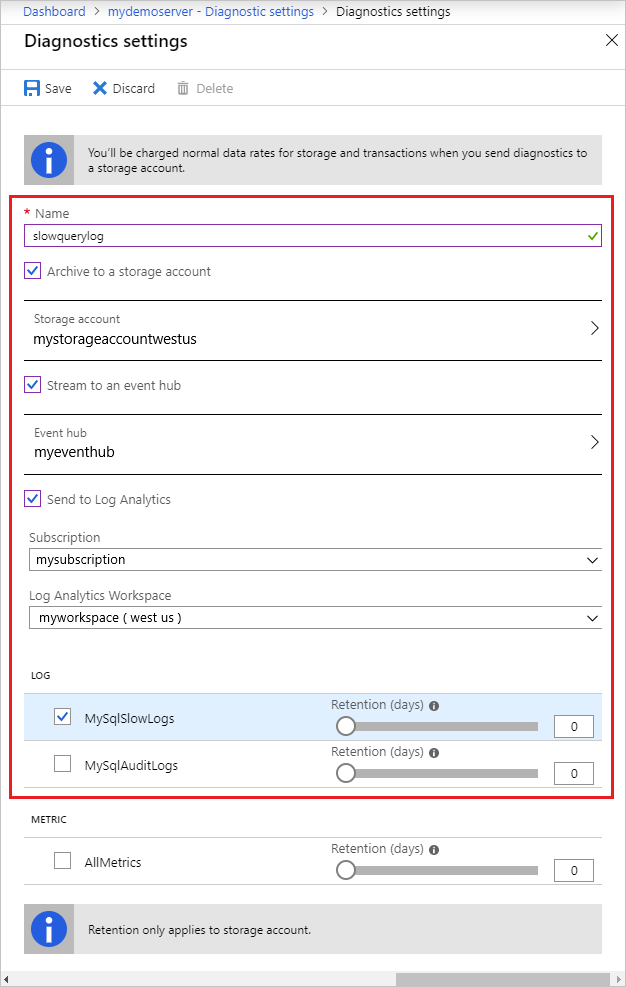
Provide a diagnostic setting name.
Specify which data sinks to send the slow query logs (storage account, event hub, or Log Analytics workspace).
Select MySqlSlowLogs as the log type.
After you've configured the data sinks to pipe the slow query logs to, select Save.
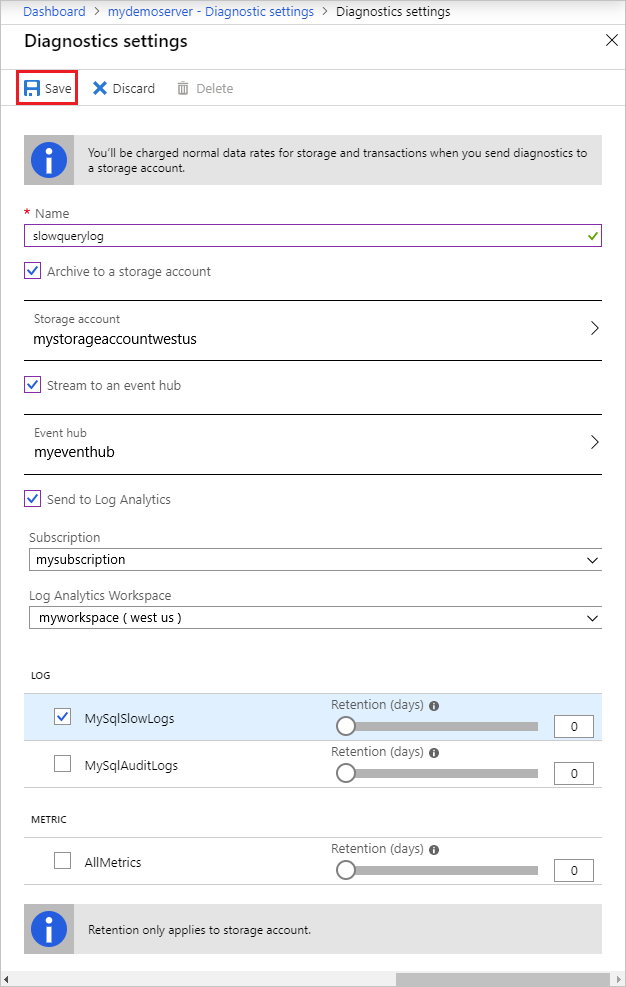
Access the slow query logs by exploring them in the data sinks you configured. It can take up to 10 minutes for the logs to appear.
Next steps
- See Access slow query logs in CLI to learn how to download slow query logs programmatically.
- Learn more about slow query logs in Azure Database for MariaDB.
- For more information about the parameter definitions and logging, see the MariaDB documentation on logs.
Feedback
Coming soon: Throughout 2024 we will be phasing out GitHub Issues as the feedback mechanism for content and replacing it with a new feedback system. For more information see: https://aka.ms/ContentUserFeedback.
Submit and view feedback for