Migrate to Connection monitor from Network performance monitor
In this article, you learn how to migrate your existing tests from Network performance monitor to the new Connection monitor with zero downtime. For more information, see Connection monitor overview.
Important
Network performance monitor is deprecated and no longer available. To minimize service disruption to your current workloads, migrate your tests from Network performance monitor (classic) to the new Connection monitor.
Key benefits of the new Connection monitor
The following are key benefits of the new Connection monitor:
Unified connectivity monitoring experience for Azure and Hybrid endpoints
Azure Monitor agent enabled ARC servers as source and destination endpoints.
Cross subscription, cross workspace and cross region monitoring support.
Virtual machines (VMs) and scale sets support as source and destination endpoints.
Ease of experience with simplified agent support
Lightweight Azure Network Watcher extension compatible with ARC endpoints.
Support for Azure Monitor agent extension with ARC enabled on-premises endpoints.
Auto upgrade of agents with automated agent enablement support.
Visualize & measure end-to-end network path performance with the new Topology (preview)
Deep insights into network performance metrics with synthetic monitoring across TCP, ICMP, and HTTP protocols.
Enhanced visibility into end-to-end network path and connections with per hop latency and path loss across path components, highlighting links with high latency or packet loss.
Geo meta data and ASN data available across internet hops.
Highlight last mile, middle mile, and last mile latency with Microsoft edge discovery.
Enhanced troubleshooting with clear actionable insights
Fast detection with real-time alerting network connectivity issues.
Smart insights into changes across networking path components to highlight the underlying cause for connectivity errors.
Identification of blocking rules, resources responsible for causing endpoint connectivity failures.
Network performance monitor vs new Connection monitor
The following table compares Network performance monitor and the new Connection monitor:
| Feature | Network performance monitor | Connection monitor |
|---|---|---|
| Unified experience for Azure and hybrid monitoring | Not available | Available |
| Cross subscription, cross-region, and cross-workspace monitoring | Limited availability | Available |
| Centralized workspace support | Not available | Available |
| Support for ARC enabled Azure Monitor agent supported endpoints as source and destination endpoints | Not available | Available |
| Support for Azure VMs and compound resources (Virtual networks, subnets, scale sets) | Not available | Available |
| Unified topology across on-premises, internet, and Azure hops | Not available | Available |
| HTTP status code checks | Not available | Available |
| Enhanced connectivity diagnostics with actionable insights | Not available | Available |
| Connectivity metrics and dimension measurements | Not available | Available |
| Automation – PowerShell, the Azure CLI, Terraform | Not available | Available |
| Support for Linux | Performance monitoring supports Linux. Service Connectivity Monitor and ExpressRoute don't support Linux. | Available |
| Support for public, Government, China, and air-gapped cloud | Available | Available |
Key points to note
The migration helps produce the following results:
- On-premises agents and firewall settings work as is. No changes are required. Log Analytics agents that are installed on Azure virtual machines need to be replaced with the Network Watcher extension.
- Existing tests are mapped to Connection monitor > Test group > Test format. By selecting Edit, you can view and modify the properties of the new Connection monitor, download a template to make changes to it, and submit the template via Azure Resource Manager.
- Agents send data to both the Log Analytics workspace and the metrics.
- Data monitoring:
- Data in Log Analytics: Before migration, the data remains in the workspace in which Network performance monitor is configured in the NetworkMonitoring table. After the migration, the data goes to the NetworkMonitoring table, NWConnectionMonitorTestResult table and NWConnectionMonitorPathResult table in the same workspace. After the tests are disabled in Network performance monitor, the data is stored only in the NWConnectionMonitorTestResult table and NWConnectionMonitorPathResult table.
- Log-based alerts, dashboards, and integrations: You must manually edit the queries based on the new NWConnectionMonitorTestResult table and NWConnectionMonitorPathResult table. To re-create the alerts in metrics, see Metrics in Azure Monitor.
- For ExpressRoute monitoring:
- End to end loss and latency: This is easier in Connection monitor than in Network performance monitor, as you don't need to configure which circuits and peerings to monitor. Circuits in the path are automatically discovered, data is available in metrics (faster than LA, which was where Network performance monitor stored the results).
- Bandwidth measurements: With the launch of bandwidth related metrics, Network performance monitor’s log analytics based approach wasn't effective in bandwidth monitoring for ExpressRoute customers. This capability is now not available in Connection monitor.
Prerequisites
- Ensure that Network Watcher is enabled in the subscription and region of the Log Analytics workspace. If not done, you see an error stating "Before you attempt to migrate, enable Network watcher extension in subscription and location of LA workspace selected."
- In case Azure virtual machine (VM) is in a different region/subscription than Log Analytics workspace that's used as an endpoint, make sure Network Watcher is enabled for that subscription and region.
- Azure virtual machines with Log Analytics agents installed must be enabled with the Network Watcher extension.
Migrate the tests
To migrate the tests from Network performance monitor to Connection monitor, follow these steps:
In Network Watcher, select Connection monitor, and then select the Import tests from NPM tab.
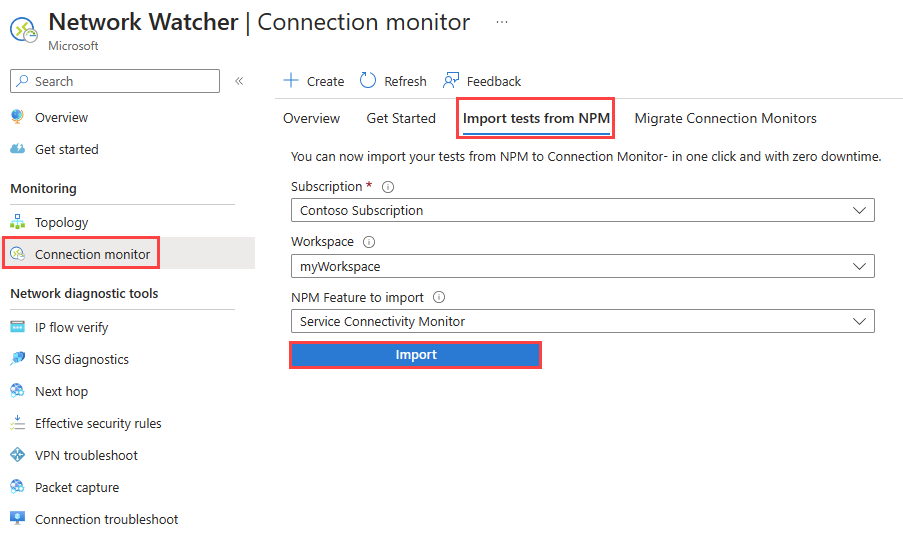
In the drop-down lists, select your subscription and workspace, and then select the Network performance monitor feature you want to migrate.
Select Import to migrate the tests.
- If Network performance monitor isn't enabled on the workspace, you see an error stating "No valid NPM config found".
- If no tests exist in the feature you chose in step 2, you see an error stating "Workspace selected doesn't have <feature> config".
- If there are no valid tests, you see an error stating "Workspace selected does not have valid tests"
- Your tests might contain agents that are no longer active, but have been active in the past. You'll see an error stating "Few tests contain agents that are no longer active. These agents might be running in the past but are shut down/not running anymore. Enable agents and migrate to Connection monitor. Select continue to migrate the tests that do not contain agents that are not active."

After the migration begins, the following changes take place:
- A new connection monitor resource is created.
- One connection monitor per region and subscription is created. For tests with on-premises agents, the new connection monitor name is formatted as
<workspaceName>_<workspace_region_name>. For tests with Azure agents, the new connection monitor name is formatted as<workspaceName>_<Azure_region_name>. - Monitoring data is now stored in the same Log Analytics workspace in which Network performance monitor is enabled, in new tables called NWConnectionMonitorTestResult table and NWConnectionMonitorPathResult table.
- The test name is carried forward as the test group name. The test description isn't migrated.
- Source and destination endpoints are created and used in the new test group. For on-premises agents, the endpoints are formatted as
<workspaceName>_<FQDN of on-premises machine>. The Agent description isn't migrated. - Destination port and probing interval are moved to a test configuration called
TC_<protocol>_<port>andTC_<protocol>_<port>_AppThresholds. The protocol is set based on the port values. For ICMP, the test configurations are named asTC_<protocol>andTC_<protocol>_AppThresholds. Success thresholds and other optional properties if set, are migrated, otherwise are left blank. - If the migrating tests contain agents that aren't running, you need to enable the agents and migrate again.
- One connection monitor per region and subscription is created. For tests with on-premises agents, the new connection monitor name is formatted as
- Network performance monitor isn't disabled, so the migrated tests can continue to send data to the NetworkMonitoring table, NWConnectionMonitorTestResult table and NWConnectionMonitorPathResult table. This approach ensures that existing log-based alerts and integrations are unaffected.
- The newly created connection monitor is visible in Connection monitor.
After the migration, be sure to:
- Manually disable the tests in Network performance monitor. Until you do so, you continue to be charged for them.
- While you're disabling Network performance monitor, re-create your alerts on the NWConnectionMonitorTestResult and NWConnectionMonitorPathResult tables or use metrics.
- Migrate any external integrations to the NWConnectionMonitorTestResult and NWConnectionMonitorPathResult tables. Examples of external integrations are dashboards in Power BI and Grafana, and integrations with Security Information and Event Management (SIEM) systems.
Common errors encountered
The following table list common errors that you might encounter during the migration:
| Error | Reason |
|---|---|
| No valid NPM config found. Go to NPM UI to check config | This error occurs when User is selecting Import Tests from Network performance monitor to migrate the tests but Network performance monitor isn't enabled in the workspace. |
| Workspace selected does not have 'Service Connectivity Monitor' config | This error occurs when User is migrating tests from Network performance monitor’s Service Connectivity Monitor to Connection monitor but there are no tests configured in Service Connectivity Monitor. |
| Workspace selected does not have 'ExpressRoute Monitor' config | This error occurs when User is migrating tests from Network performance monitor’s ExpressRoute Monitor to Connection monitor but there are no tests configured in ExpressRoute Monitor. |
| Workspace selected does not have 'Performance Monitor' config | This error occurs when User is migrating tests from Network performance monitor’s performance monitor to Connection monitor but there are no tests configured in performance monitor. |
| Workspace selected does not have valid '{0}' tests | This error occurs when User is migrating tests from Network performance monitor to Connection monitor but there are no valid tests present in the feature chosen by User to migrate. |
| Before you attempt to migrate, enable Network watcher extension in selection subscription and location of LA workspace selected | This error occurs when User is migrating tests from Network performance monitor to Connection monitor and Network Watcher Extension isn't enabled in the LA workspace selected. User needs to enable NW Extension before migrating tests. |
| Few {1} tests contain agents that are no longer active. List of inactive agents - {0}. These agents might be running in the past but are shut down/not running anymore. Enable agents and migrate to Connection monitor. Select continue to migrate the tests that do not contain agents that are not active. | This error occurs when User is migrating tests from Network performance monitor to Connection monitor and some selected tests contain inactive Network Watcher Agents or such NW Agents, which are no longer active but used to be active in the past and have been shut down. User can deselect these tests and continue to select and migrate the tests, which don't contain any such inactive agents. |
| Your {1} tests contain agents that are no longer active. List of inactive agents - {0}. These agents might be running in the past but are shut down/not running anymore. Enable agents and migrate to Connection monitor | This error occurs when User is migrating tests from Network performance monitor to Connection monitor and selected tests contain inactive Network Watcher Agents or such NW Agents, which are no longer active but used to be active in the past and have been shut down. User needs to enable the agents and then continue to migrate these tests to Connection monitor. |
| An error occurred while importing tests to connection monitor | This error occurs when the User is trying to migrate tests from Network performance monitor to CM but the migration isn't successful due to errors. |
Related content
Feedback
Coming soon: Throughout 2024 we will be phasing out GitHub Issues as the feedback mechanism for content and replacing it with a new feedback system. For more information see: https://aka.ms/ContentUserFeedback.
Submit and view feedback for