Tutorial: Log network traffic to and from a virtual machine using the Azure portal
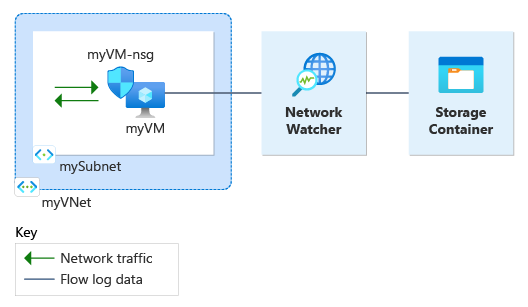
Network security group flow logging is a feature of Azure Network Watcher that allows you to log information about IP traffic flowing through a network security group. For more information about network security group flow logging, see NSG flow logs overview.
This tutorial helps you use NSG flow logs to log a virtual machine's network traffic that flows through the network security group associated to its network interface.
In this tutorial, you learn how to:
- Create a virtual network
- Create a virtual machine with a network security group associated to its network interface
- Register Microsoft.insights provider
- Enable flow logging for a network security group using Network Watcher flow logs
- Download logged data
- View logged data
Prerequisites
- An Azure account with an active subscription. If you don't have one, create a free account before you begin.
Create a virtual network
In this section, you create myVNet virtual network with one subnet for the virtual machine.
Sign in to the Azure portal.
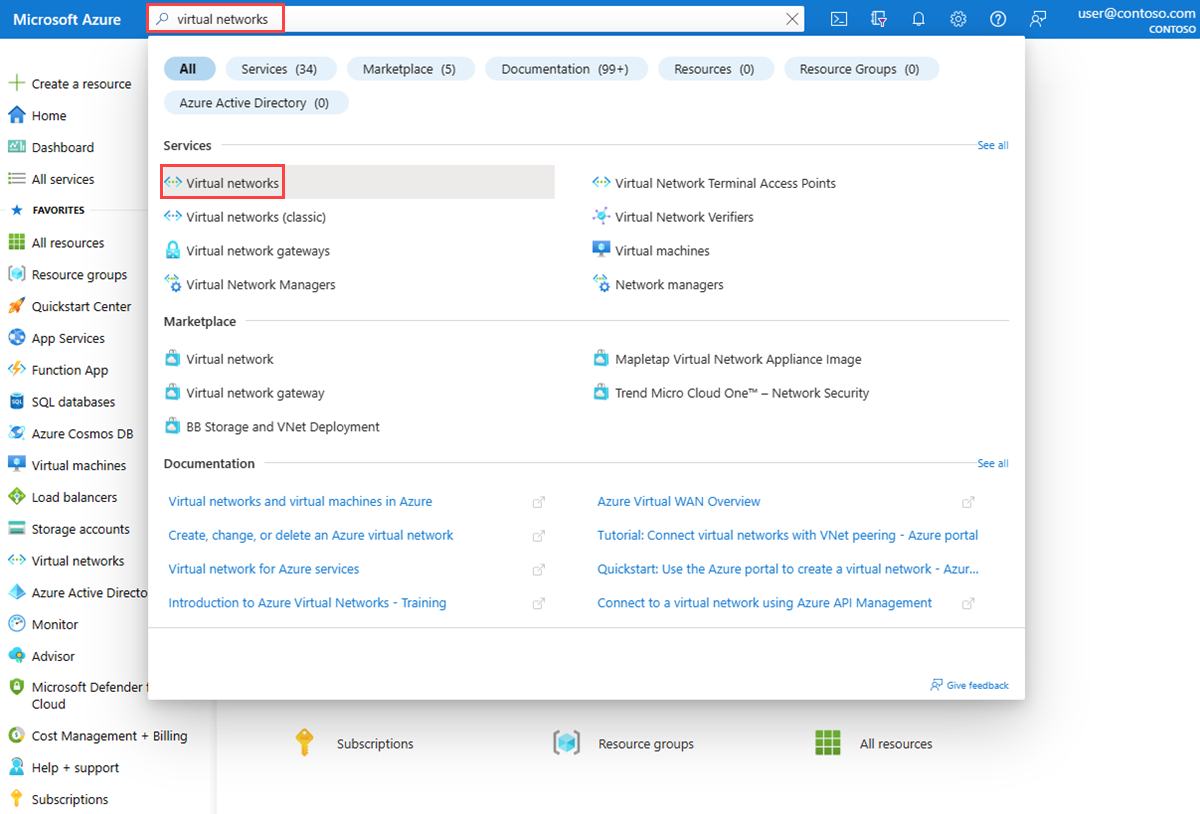
In the search box at the top of the portal, enter virtual networks. Select Virtual networks from the search results.
Select + Create. In Create virtual network, enter or select the following values in the Basics tab:
Setting Value Project details Subscription Select your Azure subscription. Resource Group Select Create new.
Enter myResourceGroup in Name.
Select OK.Instance details Name Enter myVNet. Region Select (US) East US. Select Review + create.
Review the settings, and then select Create.
Create a virtual machine
In this section, you create myVM virtual machine.
In the search box at the top of the portal, enter virtual machines. Select Virtual machines from the search results.
Select + Create and then select Azure virtual machine.
In Create a virtual machine, enter or select the following values in the Basics tab:
Setting Value Project Details Subscription Select your Azure subscription. Resource Group Select myResourceGroup. Instance details Virtual machine name Enter myVM. Region Select (US) East US. Availability Options Select No infrastructure redundancy required. Security type Select Standard. Image Select Windows Server 2022 Datacenter: Azure Edition - x64 Gen2. Size Choose a size or leave the default setting. Administrator account Username Enter a username. Password Enter a password. Confirm password Reenter password. Select the Networking tab, or select Next: Disks, then Next: Networking.
In the Networking tab, select the following values:
Setting Value Network interface Virtual network Select myVNet. Subnet Select mySubnet. Public IP Select (new) myVM-ip. NIC network security group Select Basic. This setting creates a network security group named myVM-nsg and associates it with the network interface of myVM virtual machine. Public inbound ports Select Allow selected ports. Select inbound ports Select RDP (3389). Caution
Leaving the RDP port open to the internet is only recommended for testing. For production environments, it's recommended to restrict access to the RDP port to a specific IP address or range of IP addresses. You can also block internet access to the RDP port and use Azure Bastion to securely connect to your virtual machine from the Azure portal.
Select Review + create.
Review the settings, and then select Create.
Once the deployment is complete, select Go to resource to go to the Overview page of myVM.
Select Connect then select RDP.
Select Download RDP File and open the downloaded file.
Select Connect and then enter the username and password that you created in the previous steps. Accept the certificate if prompted.
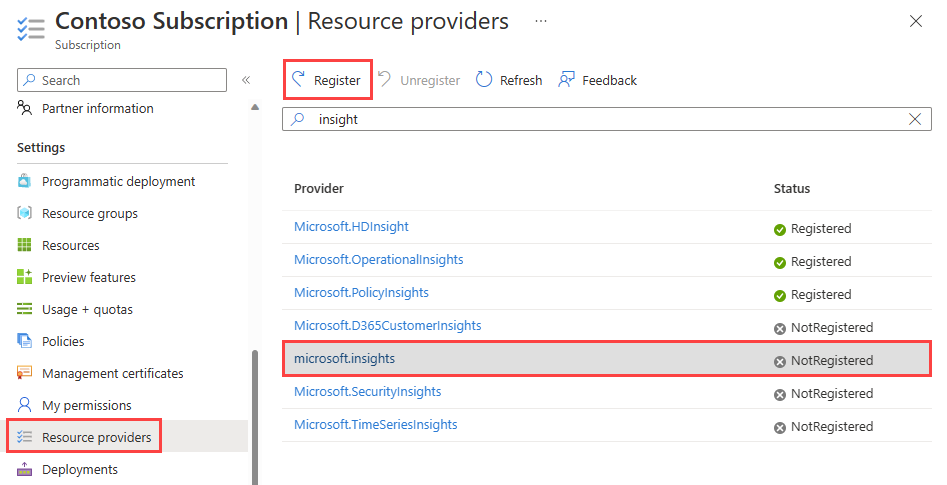
Register Insights provider
NSG flow logging requires the Microsoft.Insights provider. To check its status, follow these steps:
In the search box at the top of the portal, enter subscriptions. Select Subscriptions in the search results.
Select the Azure subscription that you want to enable the provider for in Subscriptions.
Select Resource providers under Settings of your subscription.
Enter insight in the filter box.
Confirm the status of the provider displayed is Registered. If the status is NotRegistered, select the Microsoft.Insights provider then select Register.
Create a storage account
In this section, you create a storage account to use it to store the flow logs.
In the search box at the top of the portal, enter storage accounts. Select Storage accounts in the search results.
Select + Create. In Create a storage account, enter or select the following values in the Basics tab:
Setting Value Project details Subscription Select your Azure subscription. Resource Group Select myResourceGroup. Instance details Storage account name Enter a unique name. This tutorial uses mynwstorageaccount. Region Select (US) East US. The storage account must be in the same region as the virtual machine and its network security group. Performance Select Standard. NSG flow logs only support Standard-tier storage accounts. Redundancy Select Locally-redundant storage (LRS) or different replication strategy that matches your durability requirements. Select the Review tab or select the Review button at the bottom.
Review the settings, and then select Create.
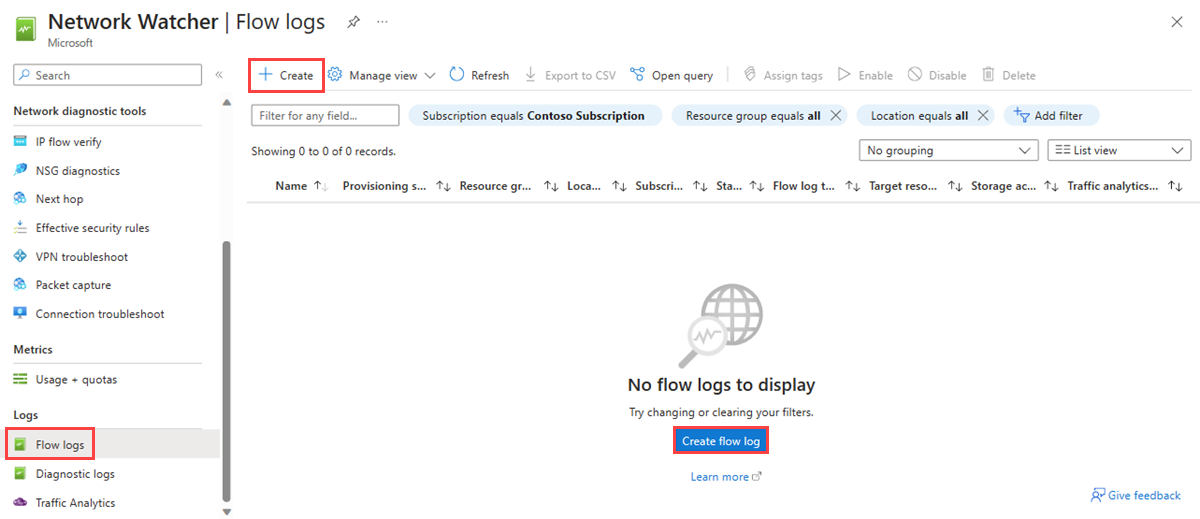
Create an NSG flow log
In this section, you create an NSG flow log that's saved into the storage account created previously in the tutorial.
In the search box at the top of the portal, enter network watcher. Select Network Watcher in the search results.
Under Logs, select Flow logs.
In Network Watcher | Flow logs, select + Create or Create flow log blue button.
Enter or select the following values in Create a flow log:
Setting Value Project details Subscription Select the Azure subscription of your network security group that you want to log. Network security group Select + Select resource.
In Select network security group, select myVM-nsg. Then, select Confirm selection.Flow Log Name Leave the default of myVM-nsg-myResourceGroup-flowlog. Instance details Subscription Select the Azure subscription of your storage account. Storage Accounts Select the storage account you created in the previous steps. This tutorial uses mynwstorageaccount. Retention (days) Enter 0 to retain the flow logs data in the storage account forever (until you delete it from the storage account). To apply a retention policy, enter the retention time in days. For information about storage pricing, see Azure Storage pricing. 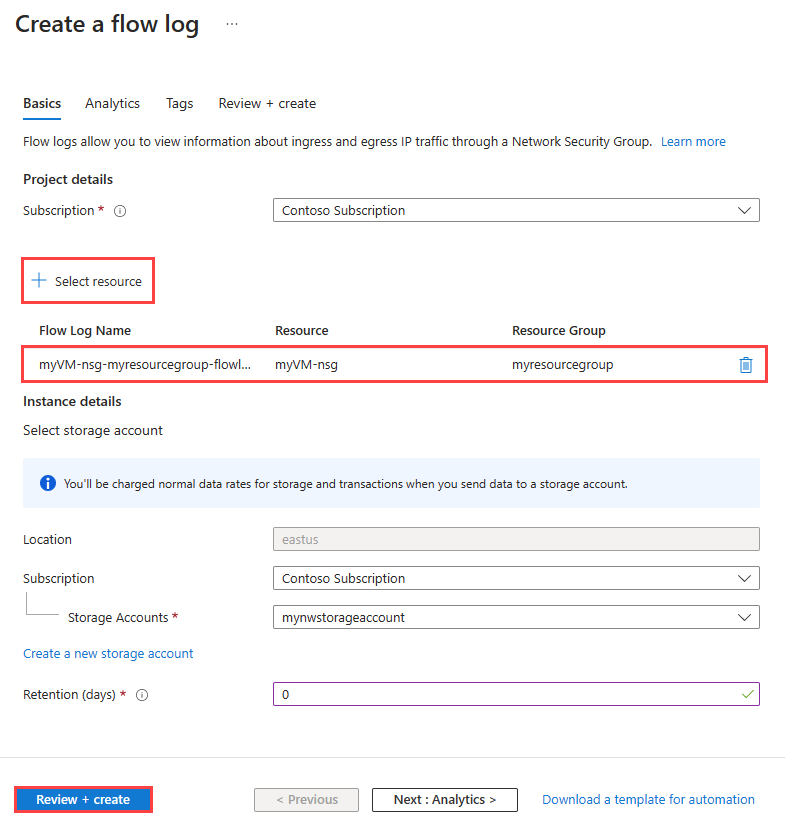
Note
The Azure portal creates NSG flow logs in the NetworkWatcherRG resource group.
Select Review + create.
Review the settings, and then select Create.
Once the deployment is complete, select Go to resource to confirm the flow log created and listed in the Flow logs page.

Go back to your RDP session with myVM virtual machine.
Open Microsoft Edge and go to
www.bing.com.


Download the flow log
In this section, you go to the storage account you previously selected and download the NSG flow log created in the previous section.
In the search box at the top of the portal, enter storage accounts. Select Storage accounts in the search results.
Select mynwstorageaccount or the storage account you previously created and selected to store the logs.
Under Data storage, select Containers.
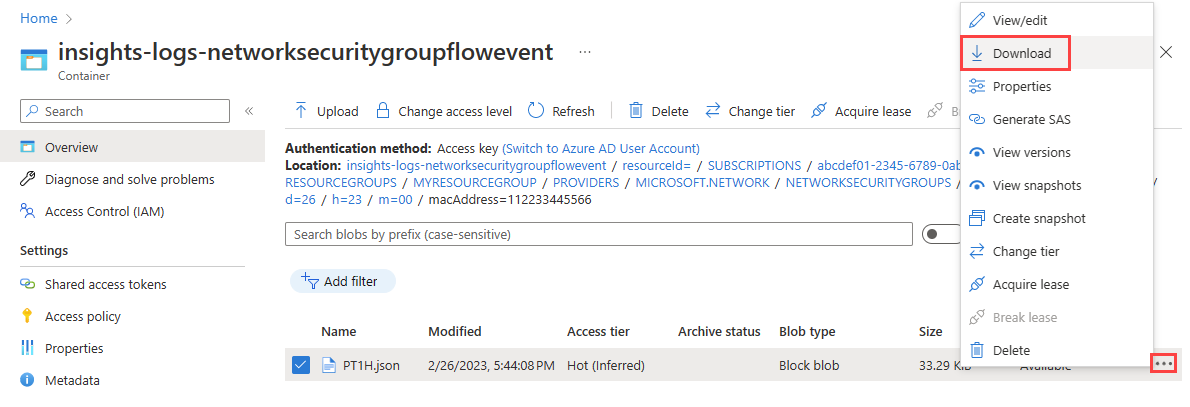
Select the insights-logs-networksecuritygroupflowevent container.
In the container, navigate the folder hierarchy until you get to the
PT1H.jsonfile. NSG log files are written to a folder hierarchy that follows the following naming convention:https://{storageAccountName}.blob.core.windows.net/insights-logs-networksecuritygroupflowevent/resourceId=/SUBSCRIPTIONS/{subscriptionID}/RESOURCEGROUPS/{resourceGroupName}/PROVIDERS/MICROSOFT.NETWORK/NETWORKSECURITYGROUPS/{networSecurityGroupName}/y={year}/m={month}/d={day}/h={hour}/m=00/macAddress={acAddress}/PT1H.jsonSelect the ellipsis ... to the right of the PT1H.json file, then select Download.
Note
You can use Azure Storage Explorer to access and download flow logs from your storage account. Fore more information, see Get started with Storage Explorer.
View the flow log
Open the downloaded PT1H.json file using a text editor of your choice. The following example is a section taken from the downloaded PT1H.json file, which shows a flow processed by the rule DefaultRule_AllowInternetOutBound.
{
    "time": "2023-02-26T23:45:44.1503927Z",
    "systemId": "00000000-0000-0000-0000-000000000000",
    "macAddress": "112233445566",
    "category": "NetworkSecurityGroupFlowEvent",
    "resourceId": "/SUBSCRIPTIONS/abcdef01-2345-6789-0abc-def012345678/RESOURCEGROUPS/MYRESOURCEGROUP/PROVIDERS/MICROSOFT.NETWORK/NETWORKSECURITYGROUPS/MYVM-NSG",
    "operationName": "NetworkSecurityGroupFlowEvents",
    "properties": {
        "Version": 2,
        "flows": [
            {
                "rule": "DefaultRule_AllowInternetOutBound",
                "flows": [
                    {
                        "mac": "112233445566",
                        "flowTuples": [
                            "1677455097,10.0.0.4,13.107.21.200,49982,443,T,O,A,C,7,1158,12,8143"
                        ]
                    }
                ]
            }
        ]
    }
}
The comma-separated information for flowTuples is as follows:
| Example data | What data represents | Explanation |
|---|---|---|
| 1677455097 | Time stamp | The time stamp of when the flow occurred in UNIX EPOCH format. In the previous example, the date converts to February 26, 2023 11:44:57 PM UTC/GMT. |
| 10.0.0.4 | Source IP address | The source IP address that the flow originated from. 10.0.0.4 is the private IP address of the VM you previously created. |
| 13.107.21.200 | Destination IP address | The destination IP address that the flow was destined to. 13.107.21.200 is the IP address of www.bing.com. Since the traffic is destined outside Azure, the security rule DefaultRule_AllowInternetOutBound processed the flow. |
| 49982 | Source port | The source port that the flow originated from. |
| 443 | Destination port | The destination port that the flow was destined to. |
| T | Protocol | The protocol of the flow. T: TCP. |
| O | Direction | The direction of the flow. O: Outbound. |
| A | Decision | The decision made by the security rule. A: Allowed. |
| C | Flow State Version 2 only | The state of the flow. C: Continuing for an ongoing flow. |
| 7 | Packets sent Version 2 only | The total number of TCP packets sent to destination since the last update. |
| 1158 | Bytes sent Version 2 only | The total number of TCP packet bytes sent from source to destination since the last update. Packet bytes include the packet header and payload. |
| 12 | Packets received Version 2 only | The total number of TCP packets received from destination since the last update. |
| 8143 | Bytes received Version 2 only | The total number of TCP packet bytes received from destination since the last update. Packet bytes include packet header and payload. |
Clean up resources
When no longer needed, delete myResourceGroup resource group and all of the resources it contains:
In the search box at the top of the portal, enter myResourceGroup. Select myResourceGroup from the search results.
Select Delete resource group.
In Delete a resource group, enter myResourceGroup, and then select Delete.
Select Delete to confirm the deletion of the resource group and all its resources.
Note
The myVM-nsg-myResourceGroup-flowlog flow log is in the NetworkWatcherRG resource group, but it'll be deleted after deleting the myVM-nsg network security group (by deleting the myResourceGroup resource group).
Related content
- To learn more about NSG flow logs, see Flow logging for network security groups.
- To learn how to create, change, enable, disable, or delete NSG flow logs, see Manage NSG flow logs.
- To learn about Traffic analytics, see Traffic analytics overview.
Feedback
Coming soon: Throughout 2024 we will be phasing out GitHub Issues as the feedback mechanism for content and replacing it with a new feedback system. For more information see: https://aka.ms/ContentUserFeedback.
Submit and view feedback for