Get fine-tuning recommendations for your analytics rules in Microsoft Sentinel
Important
Detection tuning is currently in PREVIEW. See the Supplemental Terms of Use for Microsoft Azure Previews for additional legal terms that apply to Azure features that are in beta, preview, or otherwise not yet released into general availability.
Fine-tuning threat detection rules in your SIEM can be a difficult, delicate, and continuous process of balancing between maximizing your threat detection coverage and minimizing false positive rates. Microsoft Sentinel simplifies and streamlines this process by using machine learning to analyze billions of signals from your data sources as well as your responses to incidents over time, deducing patterns and providing you with actionable recommendations and insights that can significantly lower your tuning overhead and allow you to focus on detecting and responding to actual threats.
Tuning recommendations and insights are now built in to your analytics rules. This article will explain what these insights show, and how you can implement the recommendations.
View rule insights and tuning recommendations
To see if Microsoft Sentinel has any tuning recommendations for any of your analytics rules, select Analytics from the Microsoft Sentinel navigation menu.
Any rules that have recommendations will display a lightbulb icon, as shown here:

Edit the rule to view the recommendations along with the other insights. They will appear together on the Set rule logic tab of the analytics rule wizard, below the Results simulation display.

Types of insights
The Tuning insights display consists of several panes that you can scroll or swipe through, each showing you something different. The time frame - 14 days - for which the insights are displayed is shown at the top of the frame.
The first insight pane displays some statistical information - the average number of alerts per incident, the number of open incidents, and the number of closed incidents, grouped by classification (true/false positive). This insight helps you figure out the load on this rule, and understand if any tuning is required - for example, if the grouping settings need to be adjusted.
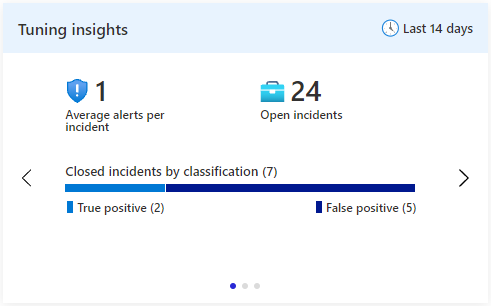
This insight is the result of a Log Analytics query. Selecting Average alerts per incident will take you to the query in Log Analytics that produced the insight. Selecting Open incidents will take you to the Incidents blade.
The second insight pane recommends for you a list of entities to be excluded. These entities are highly correlated with incidents that you closed and classified as false positive. Select the plus-sign next to each listed entity to exclude it from the query in future executions of this rule.
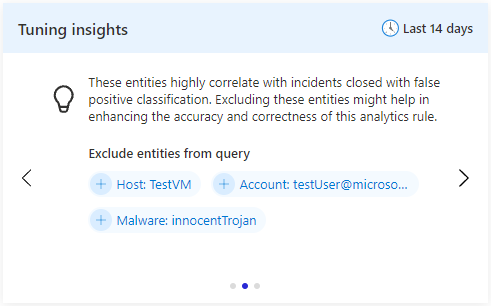
This recommendation is produced by Microsoft's advanced data science and machine learning models. This pane's inclusion in the Tuning insights display is dependent on there being any recommendations to show.
The third insight pane shows the four most frequently-appearing mapped entities across all alerts produced by this rule. Entity mapping must be configured on the rule for this insight to produce any results. This insight might help you become aware of any entities that are "hogging the spotlight" and drawing attention away from other ones. You might want to handle these entities separately in a different rule, or you might decide that they are false positives or otherwise noise, and exclude them from the rule.
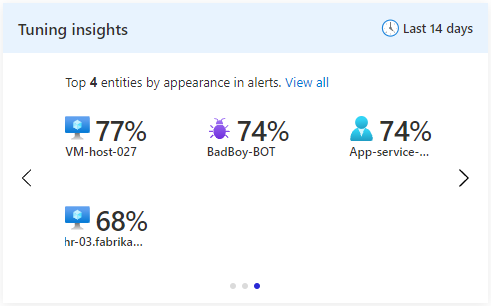
This insight is the result of a Log Analytics query. Selecting any of the entities will take you to the query in Log Analytics that produced the insight.
Next steps
For more information, see:
Feedback
Coming soon: Throughout 2024 we will be phasing out GitHub Issues as the feedback mechanism for content and replacing it with a new feedback system. For more information see: https://aka.ms/ContentUserFeedback.
Submit and view feedback for