Track your Microsoft Sentinel migration with a workbook
As your organization's Security Operations Center (SOC) handles growing amounts of data, it's essential to plan and monitor your deployment status. While you can track your migration process using generic tools such as Microsoft Project, Microsoft Excel, Teams, or Azure DevOps, these tools aren’t specific to SIEM migration tracking. To help you with tracking, we provide a dedicated workbook in Microsoft Sentinel named Microsoft Sentinel Deployment and Migration.
The workbook helps you to:
- Visualize migration progress
- Deploy and track data sources
- Deploy and monitor analytics rules and incidents
- Deploy and utilize workbooks
- Deploy and perform automation
- Deploy and customize user and entity behavioral analytics (U E B A)
This article describes how to track your migration with the Microsoft Sentinel Deployment and Migration workbook, how to customize and manage the workbook, and how to use the workbook tabs to deploy and monitor data connectors, analytics, incidents, playbooks, automation rules, U E B A, and data management. Learn more about how to use Azure Monitor workbooks in Microsoft Sentinel.
Deploy the workbook content and view the workbook
- In the Azure portal, select Microsoft Sentinel and then select Workbooks.
- From the search bar, search for
migration. - From the search results, select the Microsoft Sentinel Deployment and Migration workbook and select Save. Microsoft Sentinel deploys the workbook and saves the workbook in your environment.
- To view the workbook, select Open saved workbook.
Deploy the watchlist
- In the Microsoft Sentinel GitHub repository, select the DeploymentandMigration folder, and select Deploy to Azure to begin the template deployment in Azure.
- Provide the Microsoft Sentinel resource group and workspace name.
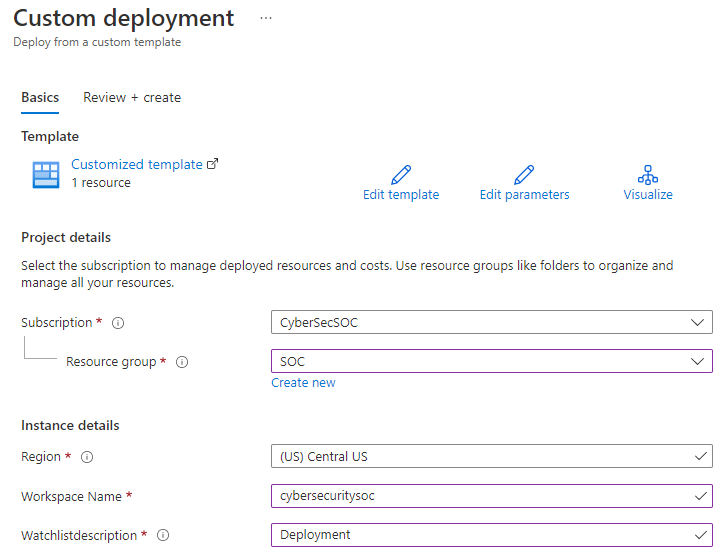
- Select Review and create.
- After the information is validated, select Create.
Update the watchlist with deployment and migration actions
This step is crucial to the tracking setup process. If you skip this step, the workbook won't reflect the items for tracking.
To update the watchlist with deployment and migration actions:
- In the Azure portal, select Microsoft Sentinel and then select Watchlist.
- Locate the watchlist with the Deployment alias.
- Select the watchlist, and then select Update watchlist > edit watchlist items on the bottom right.

- Provide the information for the actions needed for the deployment and migration, and select Save.

You can now view the watchlist within the migration tracker workbook. Learn how to manage watchlists.
In addition, your team might update or complete tasks during the deployment process. To address these changes, you can update existing actions or add new actions as you identify new use cases or set new requirements. To update or add actions, edit the Deployment watchlist that you deployed previously. To simplify the process, select Edit Deployment Watchlist on the bottom left to open the watchlist directly from the workbook.
View deployment status
To quickly view the deployment progress, in the Microsoft Sentinel Deployment and Migration workbook, select Deployment and scroll down to locate the Summary of progress. This area displays the deployment status, including the following information:
- Tables reporting data
- Number of tables reporting data
- Number of reported logs and which tables report the log data
- Number of enabled rules vs. undeployed rules
- Recommended workbooks deployed
- Total number of workbooks deployed
- Total number of playbooks deployed
Deploy and monitor data connectors
To monitor deployed resources and deploy new connectors, in the Microsoft Sentinel Deployment and Migration workbook, select Data Connectors > Monitor. The Monitor view lists:
- Current ingestion trends
- Tables ingesting data
- How much data each table is reporting
- Endpoints reporting with Microsoft Monitoring Agent (MMA)
- Endpoints reporting with Azure Monitoring Agent (AMA)
- Endpoints reporting with both the MMA and AMA agents
- Data collection rules in the resource group and the devices linked to the rules
- Data connector health (changes and failures)
- Health logs within the specified time range

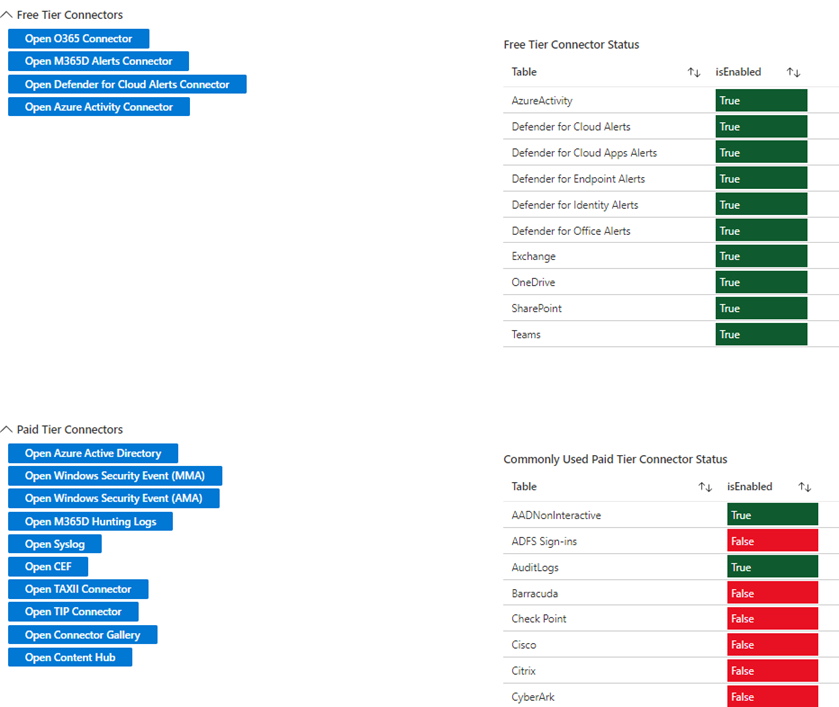
To configure a data connector:
- Select the Configure view.
- Select the button with the name of the connector you want to configure.
- Configure the connector in the connector status screen that opens. If you can't find a connector you need, select the connector name to open the connector gallery or solution gallery.
Deploy and monitor analytics and incidents
Once the data is reported in the workspace, you can now configure and monitor analytics rules. In the Microsoft Sentinel Deployment and Migration workbook, select Analytics to view all deployed rule templates and lists. This view indicates which rules are currently in use and how often the rules generate incidents.

If you need more coverage, select Review MITRE coverage below the table on the left. Use this option to define which areas receive more coverage and which rules are deployed, at any stage of the migration project.

Once the desired analytics rules are deployed and the Defender product connector is configured to send the alerts, you can monitor incident creation and frequency under Deployment > Summary of progress. This area displays metrics regarding alert generation by product, title, and classification, to indicate the health of the SOC and which alerts require the most attention. If alerts are generating too much volume, return to the Analytics tab to modify the logic.

Deploy and utilize workbooks
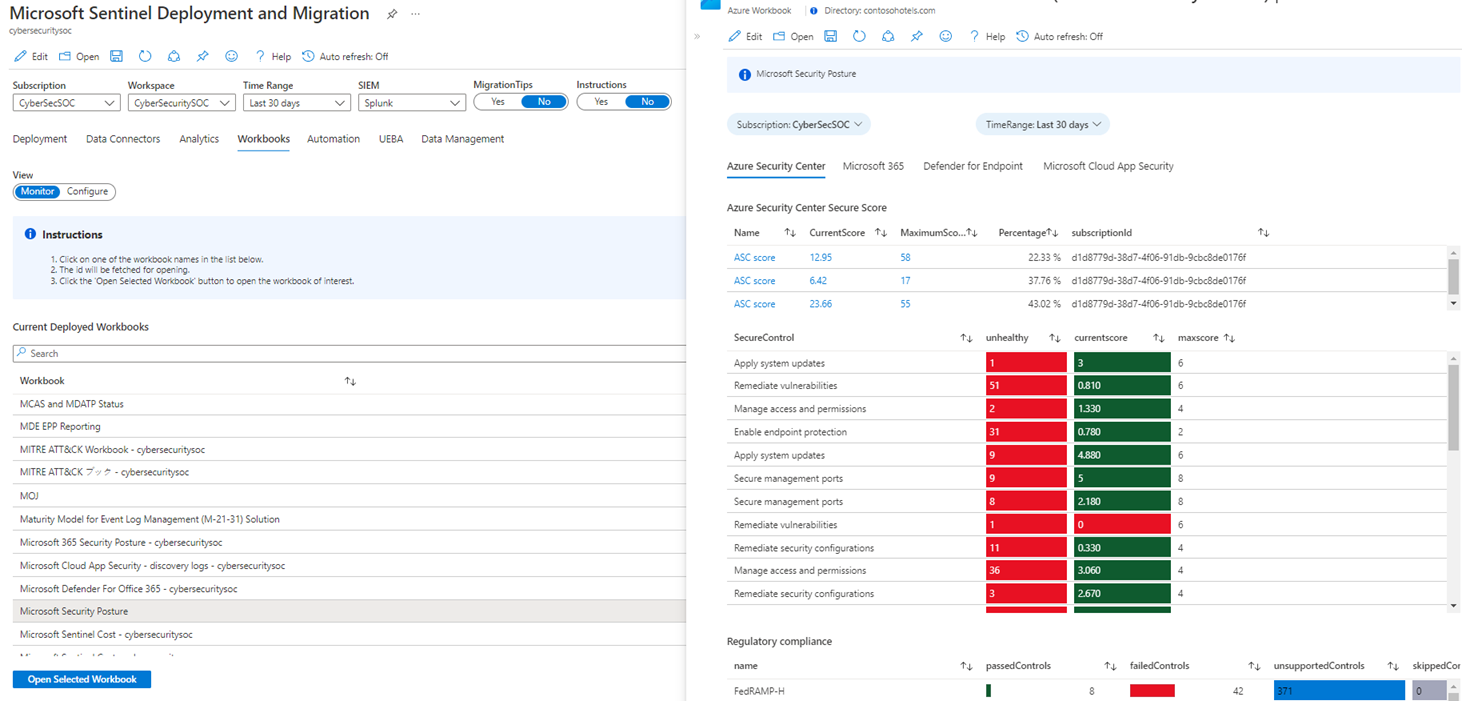
To visualize information regarding the data ingestion and detections that Microsoft Sentinel performs, in the Microsoft Sentinel Deployment and Migration workbook, select Workbooks. Similar to the Data Connectors tab, you can use the Monitor and Configure views to view monitoring and configuration information.
Here are some useful tasks you can perform in the Workbooks tab:
To view a list of all workbooks in the environment and how many workbooks are deployed, select Monitor.
To view a specific workbook within the Microsoft Sentinel Deployment and Migration workbook, select a workbook and then select Open Selected Workbook.
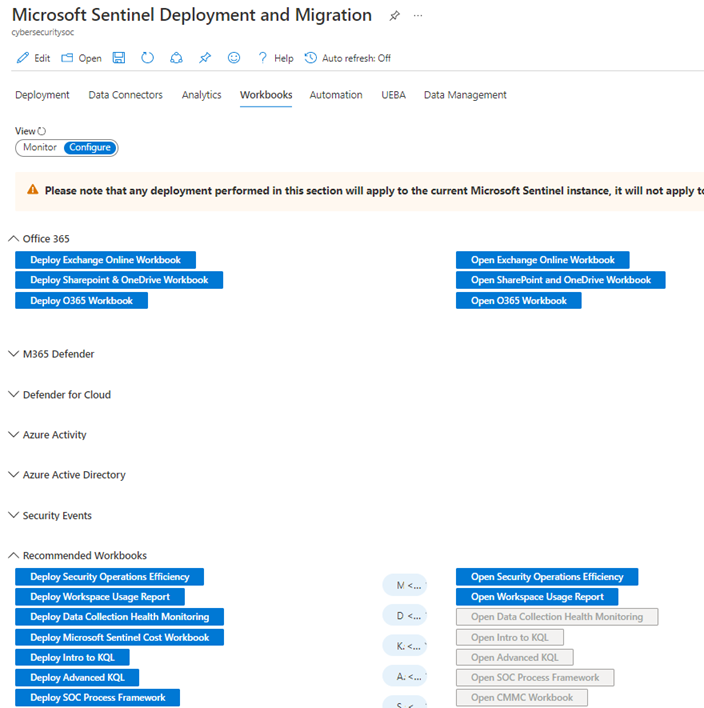
If you haven't yet deployed workbooks, select Configure to view a list of commonly used and recommended workbooks. If a workbook isn't listed, select Go to Workbook Gallery or Go to Content Hub to deploy the relevant workbook.

Deploy and monitor playbooks and automation rules
Once you configure data ingestion, detections, and visualizations, you can now look into automation. In the Microsoft Sentinel Deployment and Migration workbook, select Automation to view deployed playbooks, and to see which playbooks are currently connected to an automation rule. If automation rules exist, the workbook highlights the following information regarding each rule:
- Name
- Status
- Action or actions of the rule
- The last date the rule was modified and the user that modified the rule
- The date the rule was created
To view, deploy, and test automation within the current section of the workbook, select Deploy automation resources on the bottom left.
Learn about Microsoft Sentinel SOAR capabilities for playbooks and for automation rules.

Deploy and monitor U E B A
Because data reporting and detections happen at the entity level, it's essential to monitor entity behavior and trends. To enable the U E B A feature within Microsoft Sentinel, in the Microsoft Sentinel Deployment and Migration workbook, select UEBA. Here you can customize the entity timelines for entity pages, and view which entity related tables are populated with data.
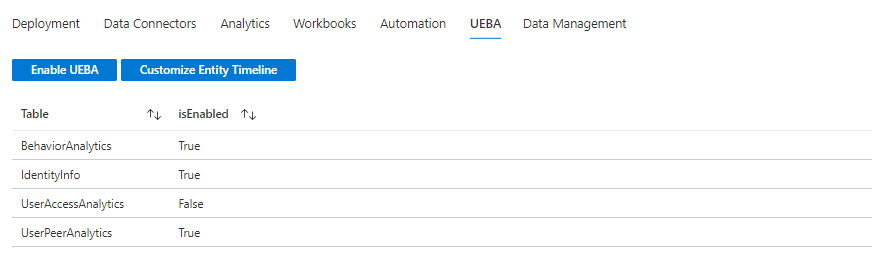
To enable U E B A:
- Select Enable UEBA above the list of tables.
- To enable U E B A, select On.
- Select the data sources you want to use to generate insights.
- Select Apply.
After you enable U E B A, you can monitor and ensure that Microsoft Sentinel is generating U E B A data.
To customize the timeline:
- Select Customize Entity Timeline above the list of tables.
- Create a custom item, or select one of the out-of-the-box templates.
- To deploy the template and complete the wizard, select Create.
Learn more about U E B A or learn how to customize the timeline.
Configure and manage the data lifecycle
When you deploy or migrate to Microsoft Sentinel, it's essential to manage the usage and lifecycle of the incoming logs. To assist with this, in the Microsoft Sentinel Deployment and Migration workbook, select Data Management to view and configure table retention and archival.

You can view information regarding:
- Tables configured for basic log ingestion
- Tables configured for analytics tier ingestion
- Tables configured to be archived
- Tables on the default workspace retention
To modify the existing retention policy for tables:
- Select the Default Retention Tables view.
- Select the table you want to modify, and select Update Retention. You can edit the following information:
- Current retention in the workspace
- Current retention in the archive
- Total number of days the data will live in the environment
- Edit the TotalRetention value to set a new total number of days that the data should exist within the environment.
The ArchiveRetention value is calculated by subtracting the TotalRetention value from the InteractiveRetention value. If you need to adjust the workspace retention, the change doesn't impact tables that include configured archives and data isn't lost. If you edit the InteractiveRetention value and the TotalRetention value doesn't change, Azure Log Analytics adjusts the archive retention to compensate the change.
If you prefer to make changes in the UI, select Update Retention in UI to open the relevant blade.
Learn about data lifecycle management.
Enable migration tips and instructions
To assist with the deployment and migration process, the workbook includes tips that explain how to use the different tabs, and links to relevant resources. The tips are based on Microsoft Sentinel migration documentation and are relevant to your current SIEM. To enable tips and instructions, in the Microsoft Sentinel Deployment and Migration workbook, on the top right, set MigrationTips and Instruction to Yes.

Next steps
In this article, you learned how to track your migration with the Microsoft Sentinel Deployment and Migration workbook.
Feedback
Coming soon: Throughout 2024 we will be phasing out GitHub Issues as the feedback mechanism for content and replacing it with a new feedback system. For more information see: https://aka.ms/ContentUserFeedback.
Submit and view feedback for