Java memory management
Note
Azure Spring Apps is the new name for the Azure Spring Cloud service. Although the service has a new name, you'll see the old name in some places for a while as we work to update assets such as screenshots, videos, and diagrams.
This article applies to: ✔️ Basic/Standard ✔️ Enterprise
This article describes various concepts related to Java memory management to help you understand the behavior of Java applications hosted in Azure Spring Apps.
Java memory model
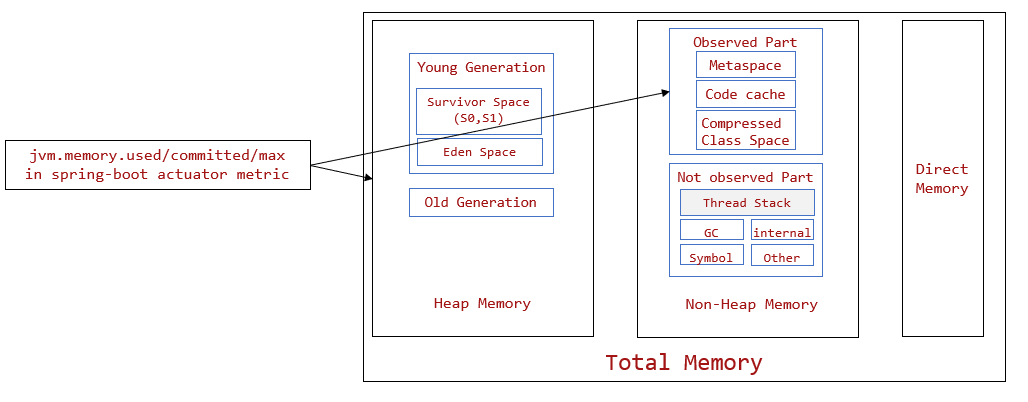
A Java application's memory has several parts, and there are different ways to divide the parts. This article discusses Java memory as divided into heap memory, non-heap memory, and direct memory.
Heap memory
Heap memory stores all class instances and arrays. Each Java virtual machine (JVM) has only one heap area, which is shared among threads.
Spring Boot Actuator can observe the value of heap memory. Spring Boot Actuator takes the heap value as part of jvm.memory.used/committed/max. For more information, see the jvm.memory.used/committed/max section in Tools to troubleshoot memory issues.
Heap memory is divided into young generation and old generation. These terms are described in the following list, along with related terms.
Young generation: all new objects are allocated and aged in young generation.
- Eden space: new objects are allocated in Eden space.
- Survivor space: objects will be moved from Eden to survivor space after surviving one garbage collection cycle. Survivor space can be divided to two parts: s1 and s2.
Old generation: also called tenured space. Objects that have remained in the survivor spaces for a long time will be moved to old generation.
Before Java 8, another section called permanent generation was also part of the heap. Starting with Java 8, permanent generation was replaced by metaspace in non-heap memory.
Non-heap memory
Non-heap memory is divided into the following parts:
The part of non-heap memory that replaced the permanent generation (or permGen) starting with Java 8. Spring Boot Actuator observes this section and takes it as part of
jvm.memory.used/committed/max. In other words,jvm.memory.used/committed/maxis the sum of heap memory and the former permGen part of non-heap memory. The former permanent generation is composed of the following parts:- Metaspace, which stores the class definitions loaded by class loaders.
- Compressed class space, which is for compressed class pointers.
- Code cache, which stores native code compiled by JIT.
Other memory such as the thread stack, which isn't observed by Spring Boot Actuator.
Direct memory
Direct memory is native memory allocated by java.nio.DirectByteBuffer, which is used in third party libraries like nio and gzip.
Spring Boot Actuator doesn't observe the value of direct memory.
The following diagram summarizes the Java memory model described in the previous section.
Java garbage collection
There are three terms regarding of Java Garbage Collection (GC): "Minor GC", "Major GC", and "Full GC". These terms aren't clearly defined in the JVM specification. Here, we consider "Major GC" and "Full GC" to be equivalent.
Minor GC performs when Eden space is full. It removes all dead objects in young generation and moves live objects to from Eden space to s1 of survivor space, or from s1 to s2.
Full GC or major GC does garbage collection in the entire heap. Full GC can also collect parts like metaspace and direct memory, which can be cleaned only by full GC.
The maximum heap size influences the frequency of minor GC and full GC. The maximum metaspace and maximum direct memory size influence full GC.
When you set the maximum heap size to a lower value, garbage collections occur more frequently, which slow the app a little, but better limits the memory usage. When you set the maximum heap size to a higher value, garbage collections occur less frequently, which may create more out-of-memory (OOM) risk. For more information, see the Types of out-of-memory issues section of App restart issues caused by out-of-memory issues.
Metaspace and direct memory can be collected only by full GC. When metaspace or direct memory is full, full GC will occur.
Java memory configurations
The following sections describe important aspects of Java memory configuration.
Java containerization
Applications in Azure Spring Apps run in container environments. For more information, see Containerize your Java applications.
Important JVM options
You can configure the maximum size of each part of memory by using JVM options. You can set JVM options by using Azure CLI commands or through the Azure portal. For more information, see the Modify configurations to fix problems section of Tools to troubleshoot memory issues.
The following list describes the JVM options:
Heap size configuration
-Xmssets the initial heap size by absolute value.-Xmxsets the maximum heap size by absolute value.-XX:InitialRAMPercentagesets the initial heap size by the percentage of heap size / app memory size.-XX:MaxRAMPercentagesets the maximum heap size by the percentage of heap size / app memory size.
Direct memory size configuration
-XX:MaxDirectMemorySizesets the maximum direct memory size by absolute value. For more information, see MaxDirectMemorySize in the Oracle documentation.
Metaspace size configuration
-XX:MaxMetaspaceSizesets the maximum metaspace size by absolute value.
Default maximum memory size
The following sections describe how default maximum memory sizes are set.
Default maximum heap size
Azure Spring Apps sets the default maximum heap memory size to about 50%-80% of app memory for Java apps. Specifically, Azure Spring Apps uses the following settings:
- If the app memory < 1 GB, the default maximum heap size will be 50% of app memory.
- If 1 GB <= the app memory < 2 GB, the default maximum heap size will be 60% of app memory.
- If 2 GB <= the app memory < 3 GB, the default maximum heap size will be 70% of app memory.
- If 3 GB <= the app memory, the default maximum heap size will be 80% of app memory.
Default maximum direct memory size
When the maximum direct memory size isn't set using JVM options, the JVM automatically sets the maximum direct memory size to the value returned by Runtime.getRuntime.maxMemory(). This value is approximately equal to the maximum heap memory size. For more information, see the JDK 8 VM.java file.
Memory usage layout
Heap size is influenced by your throughput. Basically, when configuring, you can keep the default maximum heap size, which leaves reasonable memory for other parts.
The metaspace size depends on the complexity of your code, such as the number of classes.
The direct memory size depends on your throughput and your use of third party libraries like nio and gzip.
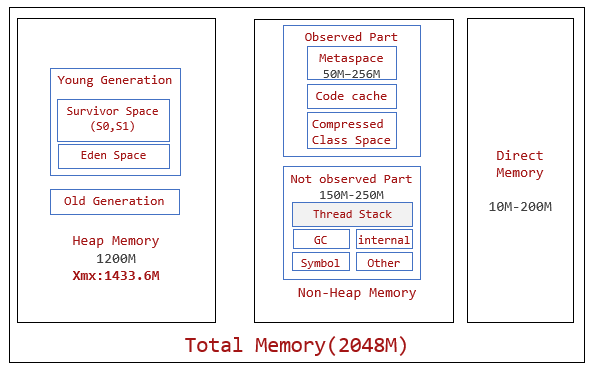
The following list describes a typical memory layout sample for 2-GB apps. You can refer to this list to configure your memory size settings.
- Total Memory (2048M)
- Heap memory: Xmx is 1433.6M (70% of total memory). The reference value of daily memory usage is 1200M.
- Young generation
- Survivor space (S0, S1)
- Eden space
- Old generation
- Young generation
- Non-heap memory
- Observed part (observed by Spring Boot Actuator)
- Metaspace: the daily usage reference value is 50M-256M
- Code cache
- Compressed class space
- Not observed part (not observed by Spring Boot Actuator): the daily usage reference value is 150M-250M.
- Thread stack
- GC, internal symbol and other
- Observed part (observed by Spring Boot Actuator)
- Direct memory: the daily usage reference value is 10M-200M.
The following diagram shows the same information. Numbers in grey are the reference values of daily memory usage.
Overall, when configuring maximum memory sizes, you should consider the usage of each part in memory, and the sum of all maximum sizes shouldn't exceed total available memory.
Java OOM
OOM means the application is out of memory. There are two different concepts: container OOM and JVM OOM. For more information, see App restart issues caused by out-of-memory issues.
See also
Feedback
Coming soon: Throughout 2024 we will be phasing out GitHub Issues as the feedback mechanism for content and replacing it with a new feedback system. For more information see: https://aka.ms/ContentUserFeedback.
Submit and view feedback for