Connect to an app instance for troubleshooting
Note
Azure Spring Apps is the new name for the Azure Spring Cloud service. Although the service has a new name, you'll see the old name in some places for a while as we work to update assets such as screenshots, videos, and diagrams.
This article applies to: ✔️ Basic/Standard ✔️ Enterprise
This article describes how to access the shell environment inside your application instances to do advanced troubleshooting.
Although Azure Spring Apps offers various managed troubleshooting approaches, you may want to do advanced troubleshooting using the shell environment. For example, you may want to accomplish the following troubleshooting tasks:
- Directly use Java Development Kit (JDK) tools.
- Diagnose against an app’s back-end services for network connection and API call latency for both virtual-network and non-virtual-network instances.
- Diagnose storage capacity, performance, and CPU/memory issues.
Prerequisites
Azure CLI with the Azure Spring Apps extension. Use the following command to remove previous versions and install the latest extension. If you previously installed the
spring-cloudextension, uninstall it to avoid configuration and version mismatches.az extension remove --name spring az extension add --name spring az extension remove --name spring-cloudA deployed application in Azure Spring Apps.
If you've deployed a custom container, a shell program. The default is
/bin/sh.
Assign an Azure role
Before connecting to an app instance, you must be granted the role Azure Spring Apps Connect Role. Connecting to an app instance requires the data action permission Microsoft.AppPlatform/Spring/apps/deployments/connect/action.
You can assign an Azure role using the Azure portal or Azure CLI.
Use the following steps to assign an Azure role using the Azure portal.
Open the Azure portal.
Open your existing Azure Spring Apps service instance.
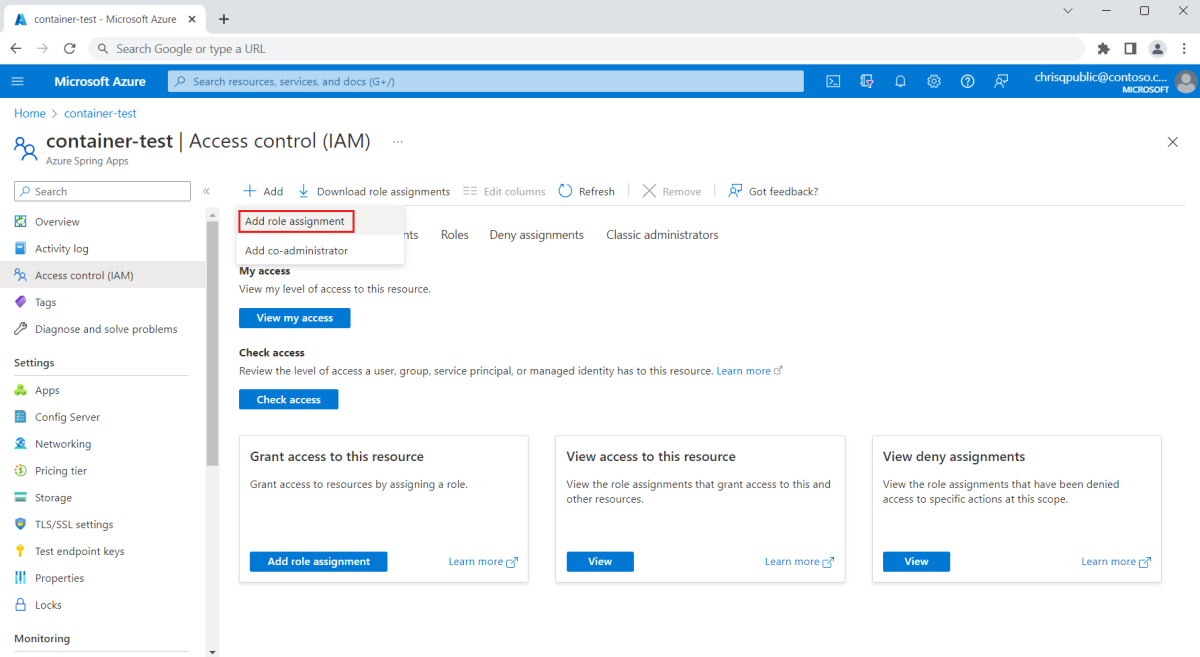
Select Access Control (IAM) from the left menu.
Select Add in the command bar, and then select Add role assignment.
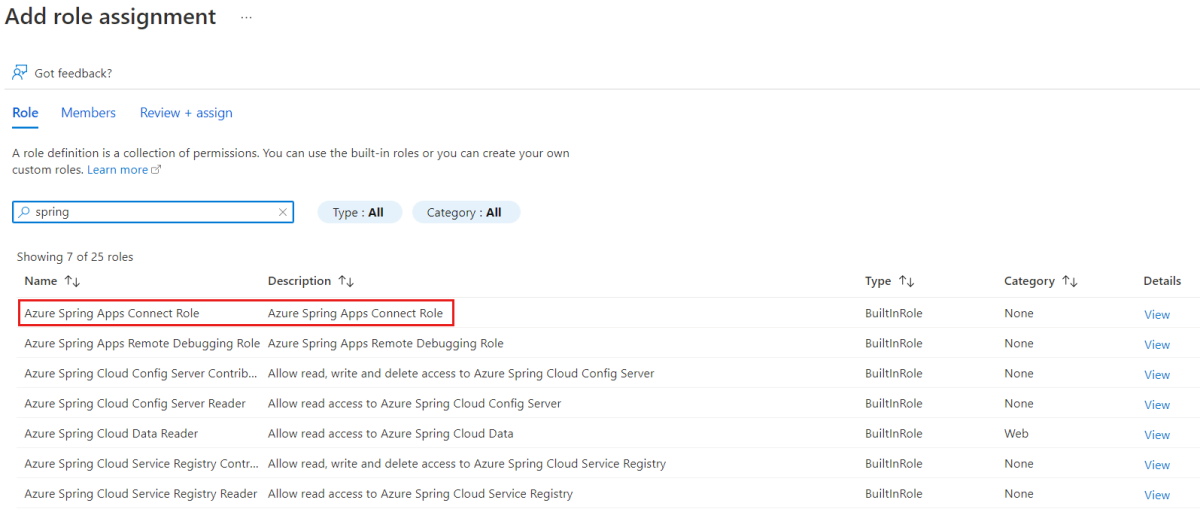
Search for Azure Spring Apps Connect Role in the list, and then select Next.
Select Select members, and then search for your username.
Select Review + assign.


Connect to an app instance
You can connect to an app instance using the Azure portal or Azure CLI.
Use the following steps to connect to an app instance using the Azure portal.
Open the Azure portal.
Open your existing Azure Spring Apps service instance.
Select Apps from left the menu, then select one of your apps.
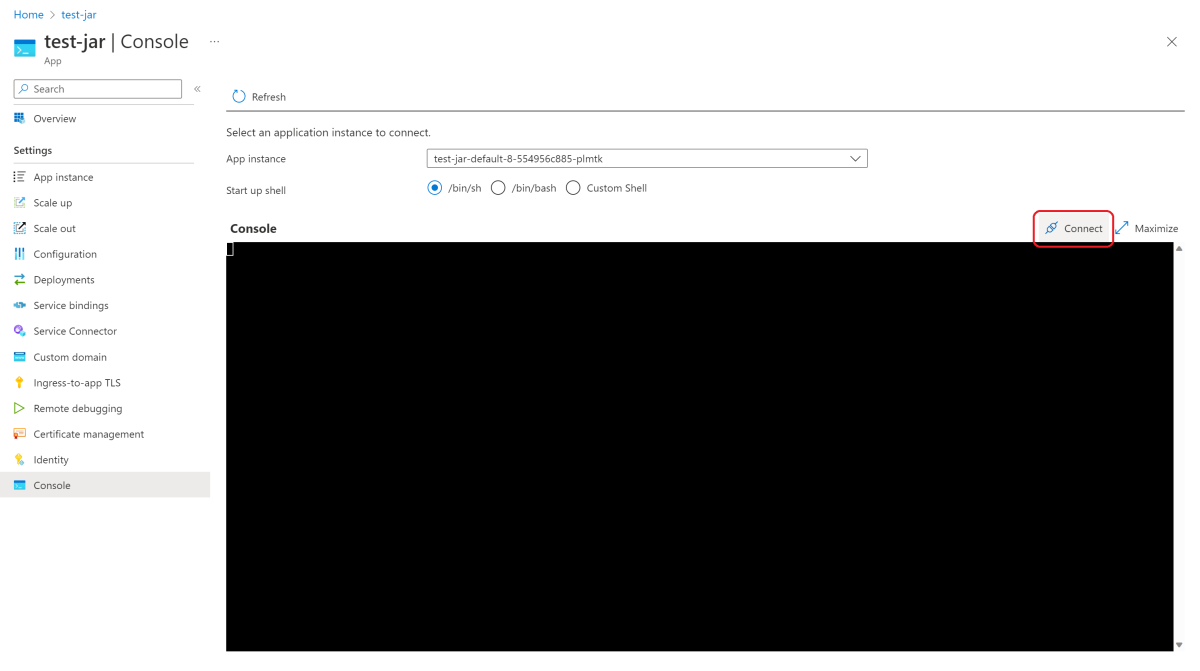
Select Console from the left menu.
Select an application instance.

Select or input a shell to run in the container.

Select Connect.


Troubleshoot your app instance
After you connect to an app instance, you can check the status of the heap memory.
Use the following command to find the Java process ID, which is usually 1:
jps
The output should look like the following example:

Then use the following command to run the JDK tool to check the result:
jstat -gc 1
The output should look like the following example:

Disconnect from your app instance
When you're done troubleshooting, use the exit command to disconnect from the app instance, or press Ctrl+d.
Troubleshooting tools
The following list describes some of the pre-installed tools that you can use for troubleshooting:
lsof- Lists open files.top- Displays system summary information and current utilization.ps- Gets a snapshot of the running process.netstat- Prints network connections and interface statistics.nslookup- Queries internet name servers interactively.ping- Tests whether a network host can be reached.nc- Reads from and writes to network connections using TCP or UDP.wget- Lets you download files and interact with REST APIs.df- Displays the amount of available disk space.
You can also use JDK-bundled tools such as jps, jcmd, and jstat.
The following list shows the tools available, which depend on your service plan and type of app deployment:
- Source Code, JAR, and artifacts deployment:
- Basic, Standard, and Standard Consumption & Dedicated Plan:
- Common tools - Yes
- JDK tools - Yes, for Java workloads only.
- Enterprise Plan:
- Common tools - Depends on which OS Stack you've chosen in your builder. Yes, for full OS Stack. No, for base OS Stack.
- JDK tools - Yes, for Java workloads only.
- Basic, Standard, and Standard Consumption & Dedicated Plan:
- Custom image deployment: Depends on the installed tool set in your image.
Note
JDK tools aren't included in the path for the source code deployment type. Run export PATH="$PATH:/layers/tanzu-buildpacks_microsoft-openjdk/jdk/bin" before running any JDK commands.
Limitations
Using the shell environment inside your application instances has the following limitations:
Because the app is running as a non-root user, you can't execute some actions requiring root permission. For example, you can't install new tools by using the system package manager
apt / yum.Because some Linux capabilities are prohibited, tools that require special privileges, such as
tcpdump, don't work.
Next steps
Feedback
Coming soon: Throughout 2024 we will be phasing out GitHub Issues as the feedback mechanism for content and replacing it with a new feedback system. For more information see: https://aka.ms/ContentUserFeedback.
Submit and view feedback for