Quickstart: Monitoring Azure Spring Apps apps with logs, metrics, and tracing
Note
Azure Spring Apps is the new name for the Azure Spring Cloud service. Although the service has a new name, you'll see the old name in some places for a while as we work to update assets such as screenshots, videos, and diagrams.
This article applies to: ✔️ Basic/Standard ❌ Enterprise
With the built-in monitoring capability in Azure Spring Apps, you can debug and monitor complex issues. Azure Spring Apps integrates Steeltoe distributed tracing with Azure's Application Insights. This integration provides powerful logs, metrics, and distributed tracing capability from the Azure portal.
The following procedures explain how to use Log Streaming, Log Analytics, Metrics, and Distributed Tracing with the sample app that you deployed in the preceding quickstarts.
Prerequisites
Complete the previous quickstarts in this series:
Logs
There are two ways to see logs on Azure Spring Apps: Log Streaming of real-time logs per app instance or Log Analytics for aggregated logs with advanced query capability.
Log streaming
You can use log streaming in the Azure CLI with the following command.
az spring app logs --name solar-system-weather --follow
You're shown output similar to the following example:
=> ConnectionId:0HM2HOMHT82UK => RequestPath:/weatherforecast RequestId:0HM2HOMHT82UK:00000003, SpanId:|e8c1682e-46518cc0202c5fd9., TraceId:e8c1682e-46518cc0202c5fd9, ParentId: => Microsoft.Azure.SpringCloud.Sample.SolarSystemWeather.Controllers.WeatherForecastController.Get (Microsoft.Azure.SpringCloud.Sample.SolarSystemWeather)
Executing action method Microsoft.Azure.SpringCloud.Sample.SolarSystemWeather.Controllers.WeatherForecastController.Get (Microsoft.Azure.SpringCloud.Sample.SolarSystemWeather) - Validation state: Valid
←[40m←[32minfo←[39m←[22m←[49m: Microsoft.Azure.SpringCloud.Sample.SolarSystemWeather.Controllers.WeatherForecastController[0]

=> ConnectionId:0HM2HOMHT82UK => RequestPath:/weatherforecast RequestId:0HM2HOMHT82UK:00000003, SpanId:|e8c1682e-46518cc0202c5fd9., TraceId:e8c1682e-46518cc0202c5fd9, ParentId: => Microsoft.Azure.SpringCloud.Sample.SolarSystemWeather.Controllers.WeatherForecastController.Get (Microsoft.Azure.SpringCloud.Sample.SolarSystemWeather)
Retrieved weather data from 4 planets
←[40m←[32minfo←[39m←[22m←[49m: Microsoft.AspNetCore.Mvc.Infrastructure.ControllerActionInvoker[2]

=> ConnectionId:0HM2HOMHT82UK => RequestPath:/weatherforecast RequestId:0HM2HOMHT82UK:00000003, SpanId:|e8c1682e-46518cc0202c5fd9., TraceId:e8c1682e-46518cc0202c5fd9, ParentId: => Microsoft.Azure.SpringCloud.Sample.SolarSystemWeather.Controllers.WeatherForecastController.Get (Microsoft.Azure.SpringCloud.Sample.SolarSystemWeather)
Executing ObjectResult, writing value of type 'System.Collections.Generic.KeyValuePair`2[[System.String, System.Private.CoreLib, Version=4.0.0.0, Culture=neutral, PublicKeyToken=7cec85d7bea7798e],[System.String, System.Private.CoreLib, Version=4.0.0.0, Culture=neutral, PublicKeyToken=7cec85d7bea7798e]][]'.
←[40m←[32minfo←[39m←[22m←[49m: Microsoft.AspNetCore.Mvc.Infrastructure.ControllerActionInvoker[2]
Tip
Use az spring app logs -h to explore more parameters and log stream functionality.
Log Analytics
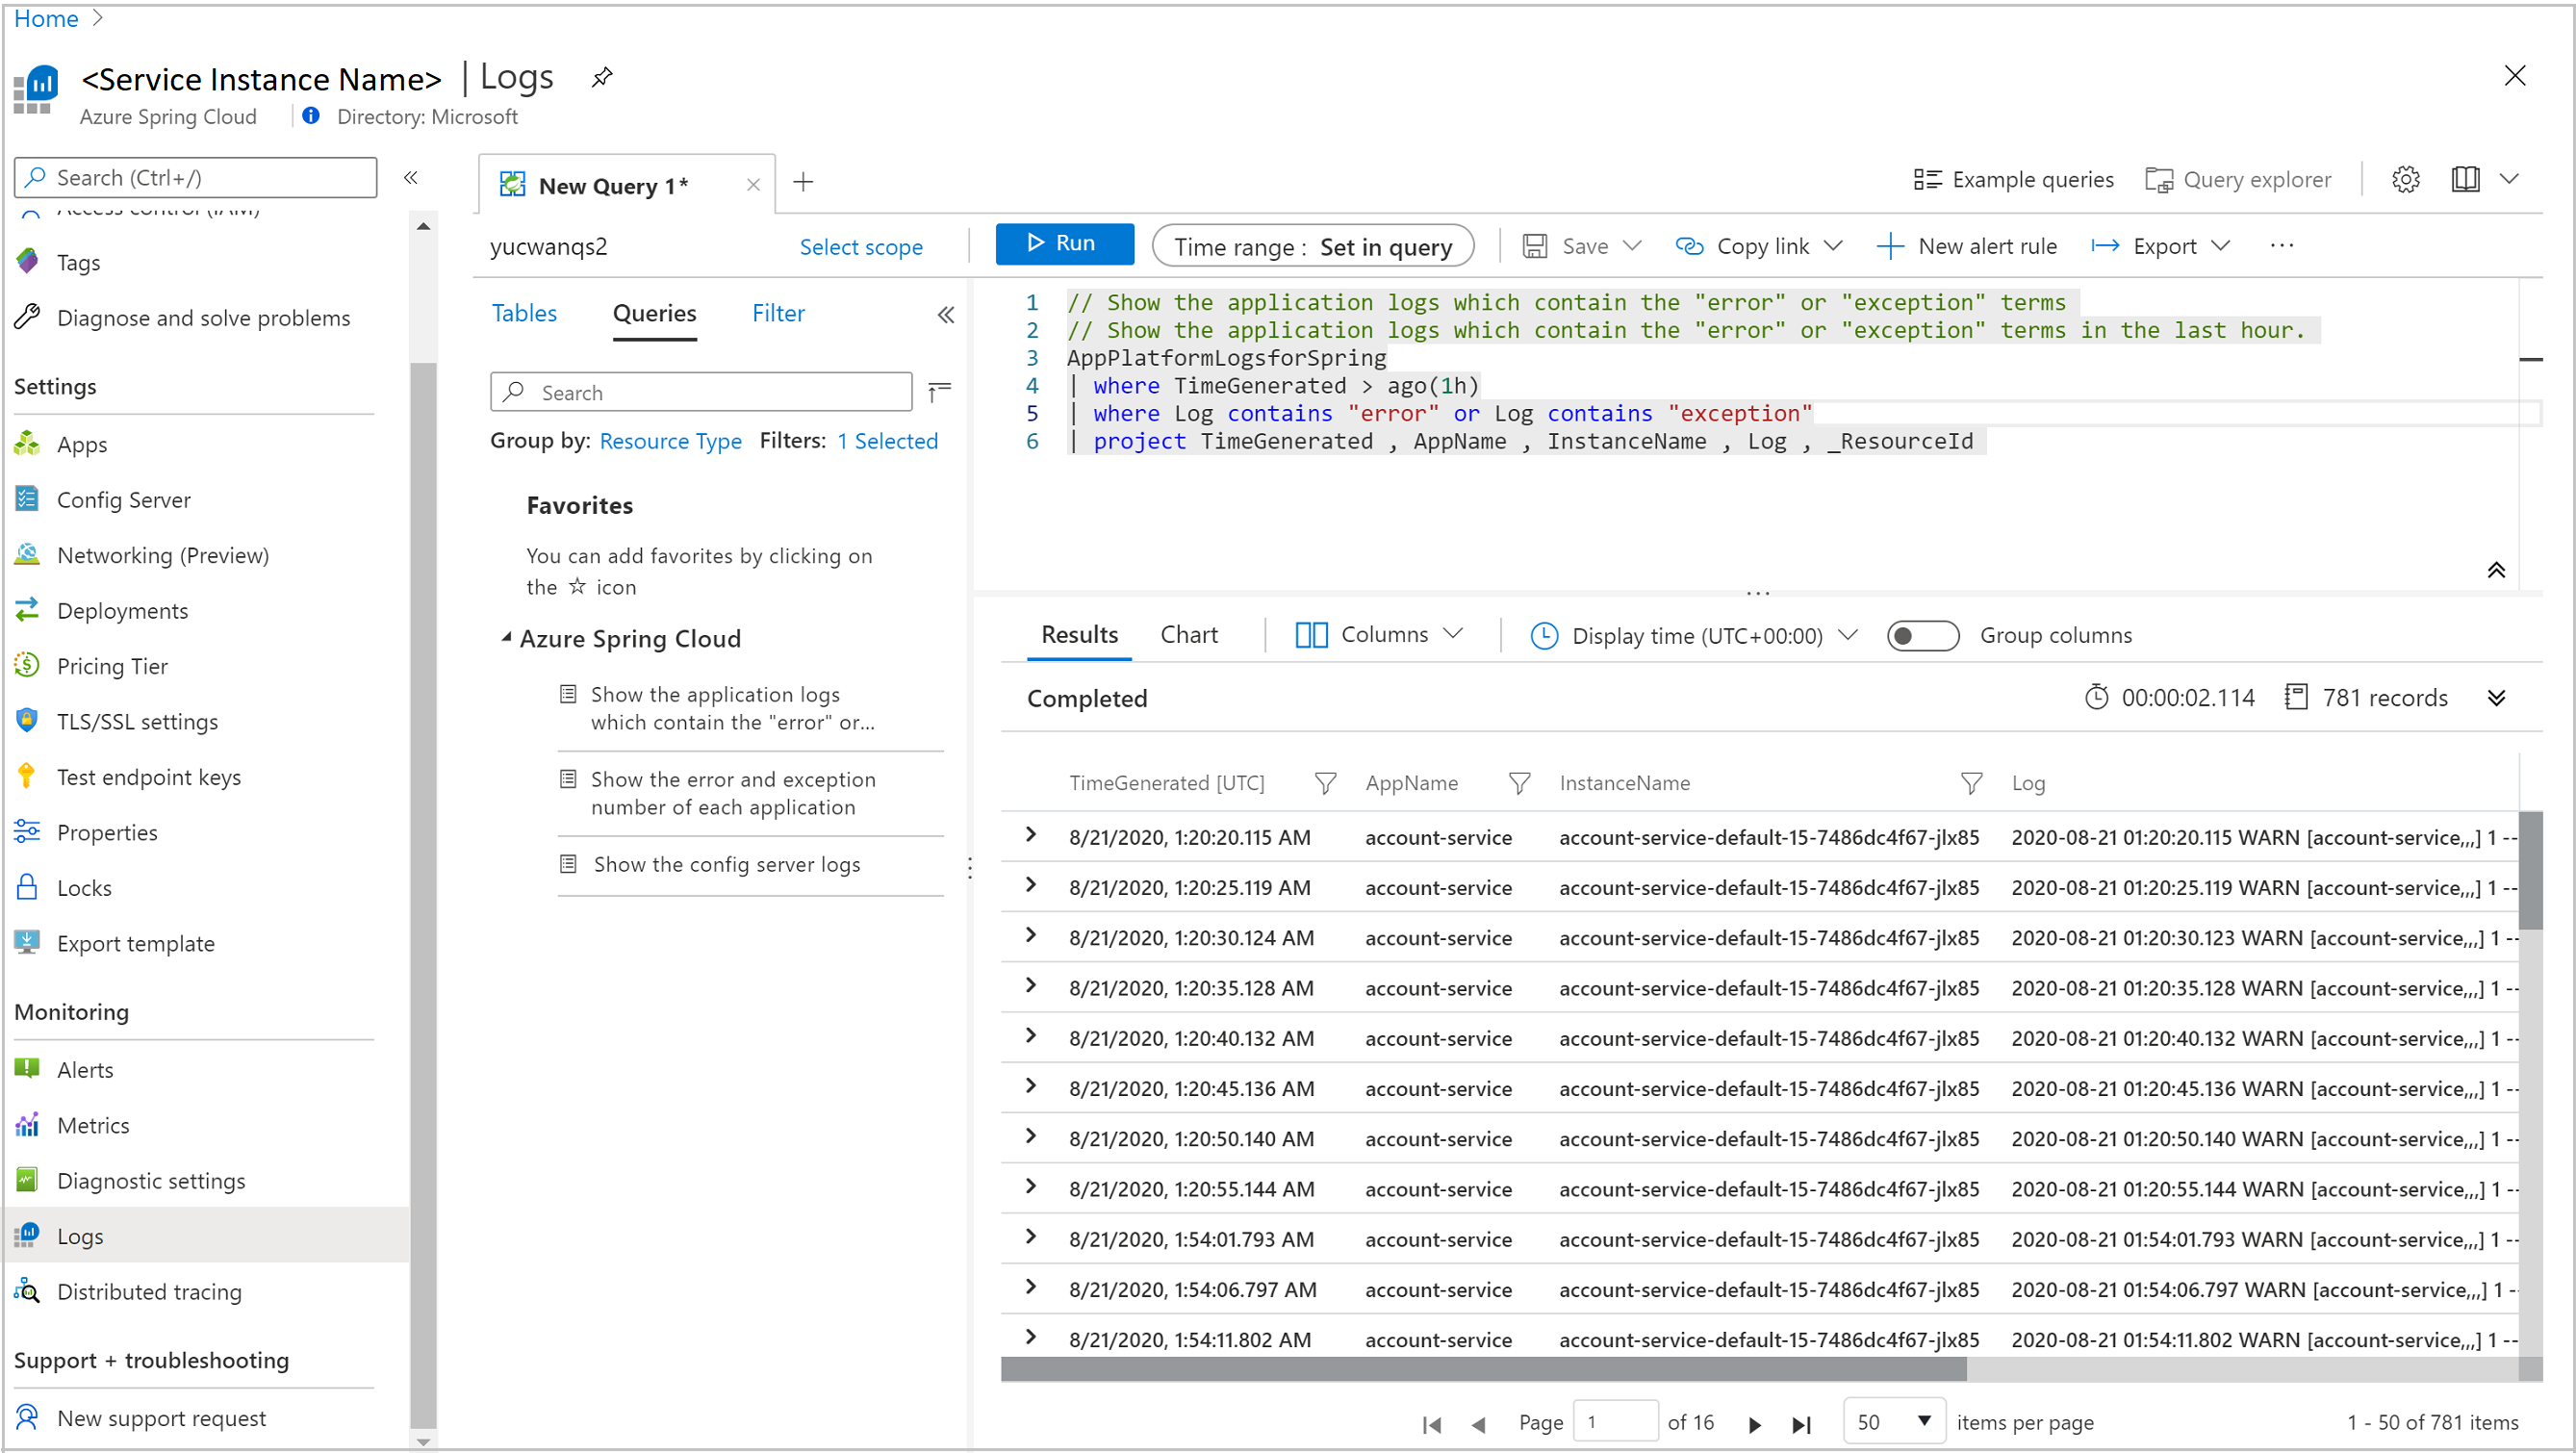
In the Azure portal, go to the service | Overview page and select Logs in the Monitoring section. Select Run on one of the sample queries for Azure Spring Apps.

Edit the query to remove the Where clauses that limit the display to warning and error logs.
Select Run. You're shown logs. For more information, see Get started with log queries in Azure Monitor.

To learn more about the query language that's used in Log Analytics, see Azure Monitor log queries. To query all your Log Analytics logs from a centralized client, check out Azure Data Explorer.


Metrics
In the Azure portal, go to the service | Overview page and select Metrics in the Monitoring section. Add your first metric by selecting one of the .NET metrics under Performance (.NET) or Request (.NET) in the Metric drop-down, and Avg for Aggregation to see the timeline for that metric.

Select Add filter in the toolbar, select
App=solar-system-weatherto see CPU usage only for the solar-system-weather app.
Dismiss the filter created in the preceding step, select Apply Splitting, and select App for Values to see the CPU usage by different apps.


Distributed tracing
In the Azure portal, go to the service | Overview page and select Distributed tracing in the Monitoring section. Then select the View application map tab on the right.

You can now see the status of calls between apps.

Select the link between solar-system-weather and planet-weather-provider to see more details such as the slowest calls by HTTP methods.

Finally, select Investigate Performance to explore more powerful built-in performance analysis.


With the built-in monitoring capability in Azure Spring Apps, you can debug and monitor complex issues. Azure Spring Apps integrates Spring Cloud Sleuth with Azure's Application Insights. This integration provides powerful logs, metrics, and distributed tracing capability from the Azure portal. The following procedures explain how to use Log Streaming, Log Analytics, Metrics, and Distributed tracing with deployed PetClinic apps.
Prerequisites
Complete the previous quickstarts in this series:
Logs
There are two ways to see logs on Azure Spring Apps: Log Streaming of real-time logs per app instance or Log Analytics for aggregated logs with advanced query capability.
Log streaming
You can use log streaming in the Azure CLI with the following command.
az spring app logs \
    --resource-group <resource-group-name> \
    --service <service-instance-name> \
    --name api-gateway \
    --follow
You're shown logs like this:

Tip
Use az spring app logs -h to explore more parameters and log stream functionalities.
To learn more about the query language that's used in Log Analytics, see Azure Monitor log queries. To query all your Log Analytics logs from a centralized client, check out Azure Data Explorer.


Log Analytics
Go to the service | Overview page and select Logs in the Monitoring section. Select Run on one of the sample queries for Azure Spring Apps.
Then you're shown filtered logs. For more information, see Get started with log queries in Azure Monitor.

Metrics
Navigate to the Application insights page, and then navigate to the Metrics page. You can see metrics contributed by Spring Boot apps, Spring modules, and dependencies.
The following chart shows gateway_requests (Spring Cloud Gateway), hikaricp_connections (JDBC Connections), and http_client_requests.

Spring Boot registers several core metrics, including JVM, CPU, Tomcat, and Logback. The Spring Boot autoconfiguration enables the instrumentation of requests handled by Spring MVC. All three REST controllers (OwnerResource, PetResource, and VisitResource) are instrumented by the @Timed Micrometer annotation at the class level.
The customers-service application has the following custom metrics enabled:
- @Timed:
petclinic.owner - @Timed:
petclinic.pet
The visits-service application has the following custom metrics enabled:
- @Timed:
petclinic.visit
You can see these custom metrics in the Metrics page:

You can use the Availability Test feature in Application Insights and monitor the availability of applications:

Navigate to the Live Metrics page to see live metrics with low latencies (less than one second):

Tracing
Open the Application Insights created by Azure Spring Apps and start monitoring Spring applications.
Navigate to the Application Map page:
![]()
Navigate to the Performance page:

Navigate to the Dependencies tab, where you can see the performance number for dependencies, particularly SQL calls:

Select a SQL call to see the end-to-end transaction in context:

Navigate to the Failures page and the Exceptions tab, where you can see a collection of exceptions:

Select an exception to see the end-to-end transaction and stacktrace in context:

Clean up resources
If you plan to continue working with subsequent quickstarts and tutorials, you might want to leave these resources in place. When no longer needed, delete the resource group, which deletes the resources in the resource group. To delete the resource group by using Azure CLI, use the following commands:
echo "Enter the Resource Group name:" &&
read resourceGroupName &&
az group delete --name $resourceGroupName &&
echo "Press [ENTER] to continue ..."
In an earlier quickstart, you also set the default resource group name. If you don't intend to continue to the next quickstart, clear out that default by running the following CLI command:
az config set defaults.group=
Next steps
To explore more monitoring capabilities of Azure Spring Apps, see:
Feedback
Coming soon: Throughout 2024 we will be phasing out GitHub Issues as the feedback mechanism for content and replacing it with a new feedback system. For more information see: https://aka.ms/ContentUserFeedback.
Submit and view feedback for